. 2016 Feb 2:7:10164.
doi: 10.1038/ncomms10164.

Genome assembly and geospatial phylogenomics of the bed bug Cimex lectularius

Affiliations

Genome assembly and geospatial phylogenomics of the bed bug Cimex lectularius

Jeffrey A Rosenfeld et al. Nat Commun. .

Abstract

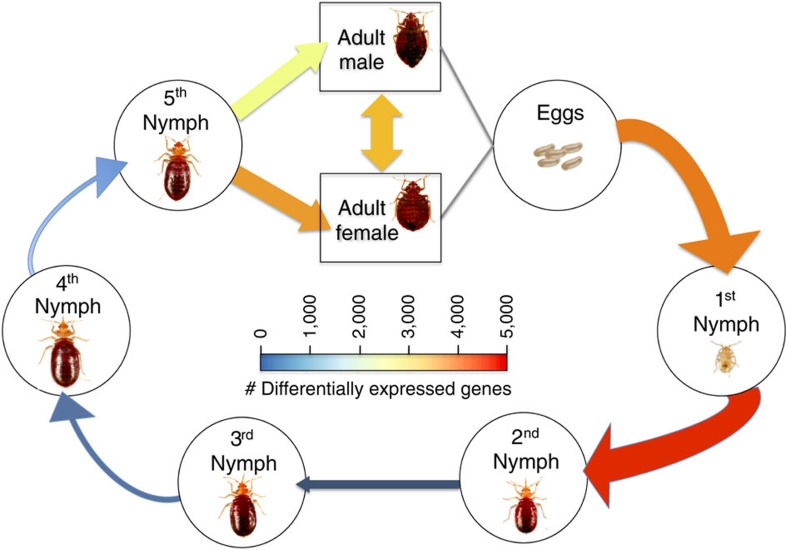
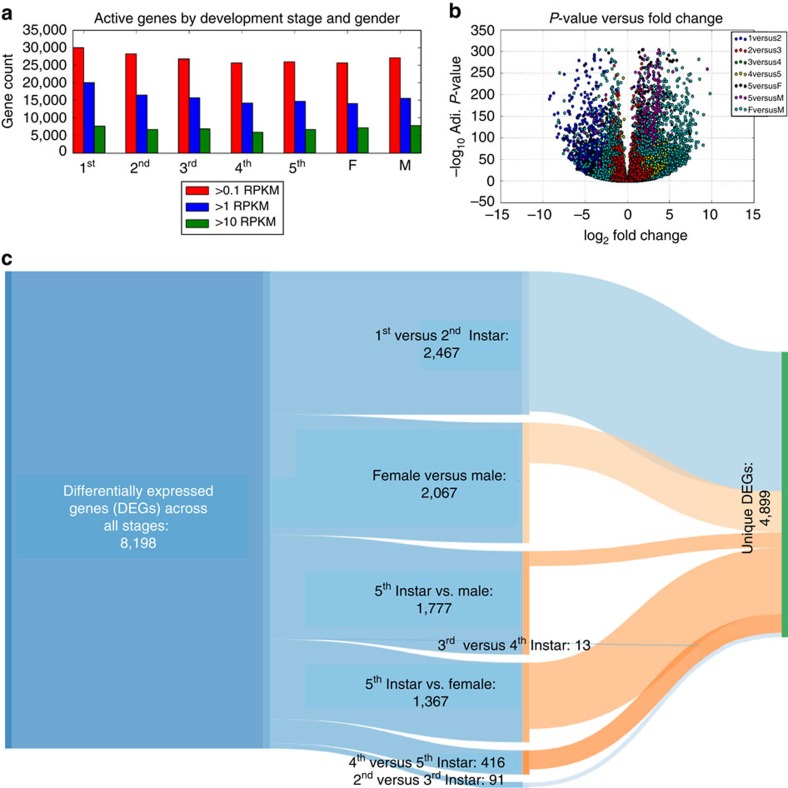
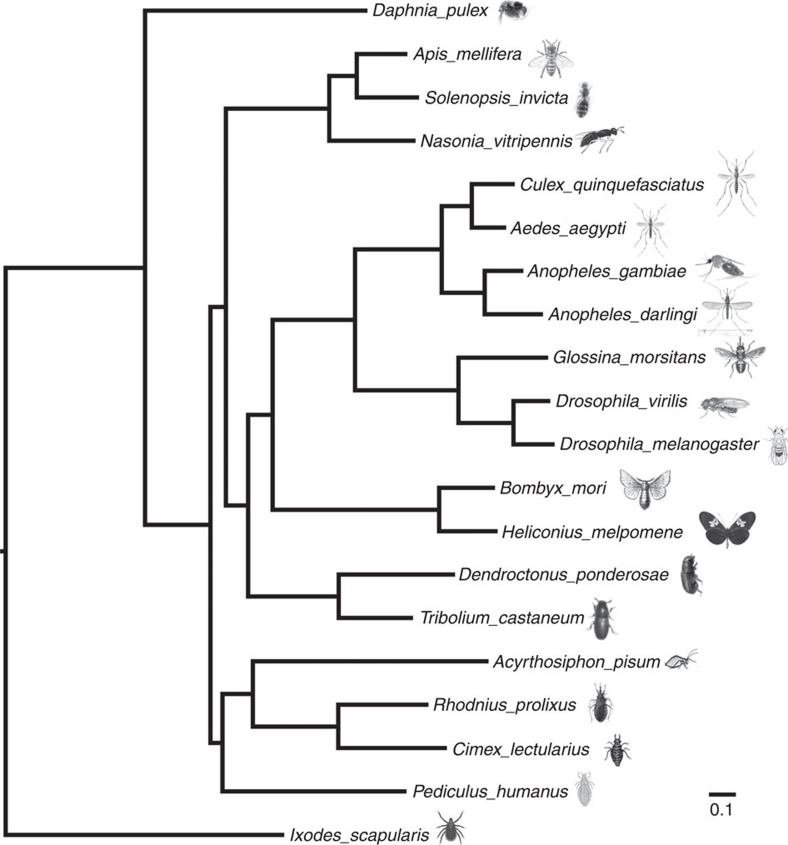
The common bed bug (Cimex lectularius) has been a persistent pest of humans for thousands of years, yet the genetic basis of the bed bug's basic biology and adaptation to dense human environments is largely unknown. Here we report the assembly, annotation and phylogenetic mapping of the 697.9-Mb Cimex lectularius genome, with an N50 of 971 kb, using both long and short read technologies. A RNA-seq time course across all five developmental stages and male and female adults generated 36,985 coding and noncoding gene models. The most pronounced change in gene expression during the life cycle occurs after feeding on human blood and included genes from the Wolbachia endosymbiont, which shows a simultaneous and coordinated host/commensal response to haematophagous activity. These data provide a rich genetic resource for mapping activity and density of C. lectularius across human hosts and cities, which can help track, manage and control bed bug infestations.


Figures

Figure 1
Figure 1. The bed bug life cycle and developmental gene expression profile.
The seven stages of the life cycle for C. lectularius are shown, starting from an egg and proceeding through five nymphal instar stages, with final differentiation into adult male and female. We used the annotation and RNA-seq data (five individuals per time point in triplicate) to calculate the number of DEGs between all developmental stages and sexes. The DEGs from both adult male and female comprise the arrow from eggs to first instar. The width of the arrows and their colour are proportional to the number of statistically significant DEGs (false discovery rate <0.05, log(fold-change) ≥1.5 and RPKM ≥1).
Figure 2
Figure 2. Total and unique genes active in developmental stages.
(a) Overall transcriptional output and complexity are similar between all the stages of development, yet the number of DEGs is highly variable between different life stages. (b) A volcano plot showing the genes with significant differential expression (log fold-change of >2, false discovery rate 0.05 and RPKM of at least 1.0), with the –log10 of the P value on the y axis and the fold-change on the x axis. (c) A Sankey diagram shows the total number of DEGs for all comparisons (n=8,198) between different life stages, and the proportion of each comparison (middle), as well as the DEGs that are unique to each comparison (middle) and those unique across all stages (right, n=4,912).
Figure 3
Figure 3. A closeup view of the ATP-binding pocket of DDL.
(a) Two structure models of the DDL protein, the reference C. lectularius Wolbachia DDL (magenta) and the DDL mined from our C. lectularius genome sequence (green), are superposed for visual comparison. ATP from a reference model is shown in orange and our protein in yellow sticks. Other amino-acid residues are shown as sticks and colour-coded by chemical element scheme. Arrows indicate a shifted position of the strand 95–98 and a new hydrogen bond between ATP and Asn265 in our protein. (b) A new hydrogen bond network in our protein between Thr98, Lys168 and Asp96 is highlighted by red circle.
Figure 4
Figure 4. Arthropod phylogenomic relationships.
Maximum likelihood estimation of the phylogenetic relationships among genome-enabled arthropods with the blacklegged tick (Ixodes scapularis) set as outgroup. All nodes were robust at 100% bootstrap support. The scale bar denotes substitutions per site.
Figure 5
Figure 5. Phylogeographic distribution of bed bug DNA across New York City.
(a) A comparison of the DNA found on subway benches across different boroughs. (b) A comparison of the DNA found aboveground and belowground. (c) The seven subway line and (d) the L subway line bed bug relationships are overlaid on a map of New York. The phylogenetic subgroup (colours) showed the same branch point for these two lines, both exhibiting an early split between the red and yellow subgroups across the different areas of the city.

References

    1. Usinger R. Monograph of Cimicidae Vol. 7, (Entomological Society of America, Thomas Say Foundation (1966).
    1. Schuh R. T. & Slater J. A. True Bugs of the World (Hemiptera: Heteroptera): Classification and Natural History Cornell University Press (1995).
    1. Foottit R. G., Adler P. H. & Henry T. J. in Insect Biodiversity: Science and Society 223–263Blackwell Publishing Ltd (2009).
    1. Mellanby K. A comparison of the physiology of the two species of bed-bug which attack man. Parasitology 27, 111–122 (1935).
    1. Potter M. F. The history of bed bug management. Am. Entomol. 57, 14–25 (2011).

Publication types