. 2015 Dec 10;54(35):10376-96.
doi: 10.1364/AO.54.010376.

Comparison of two methodologies for calibrating satellite instruments in the visible and near-infrared

Comparison of two methodologies for calibrating satellite instruments in the visible and near-infrared

Robert A Barnes et al. Appl Opt. .

Abstract

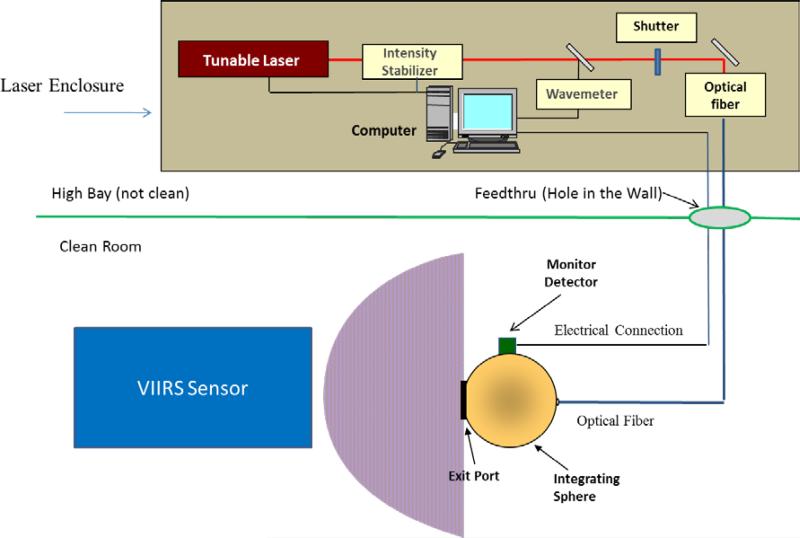
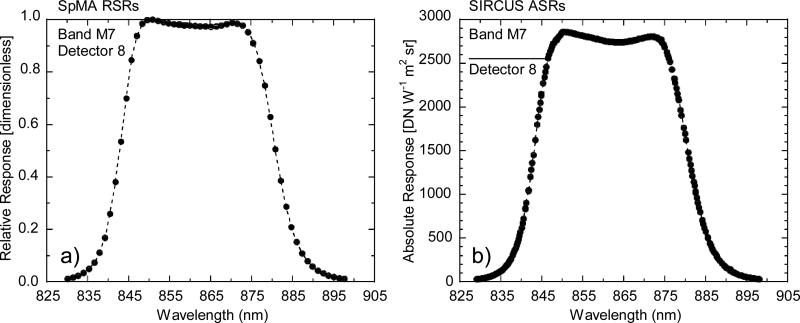
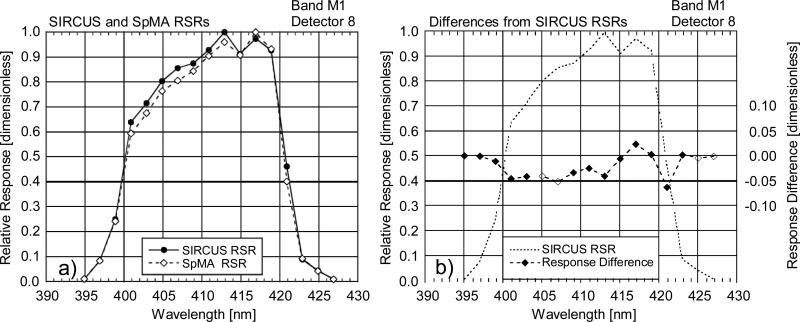
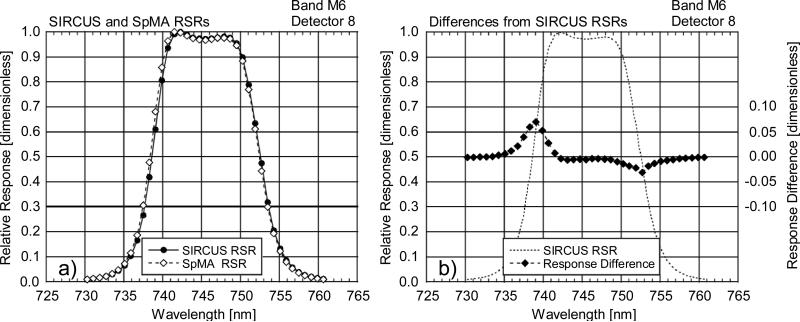
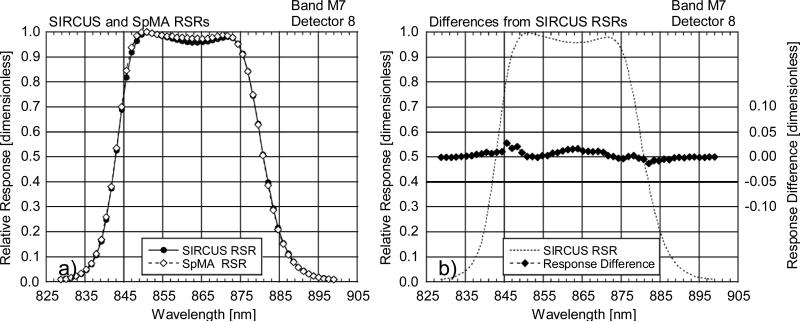
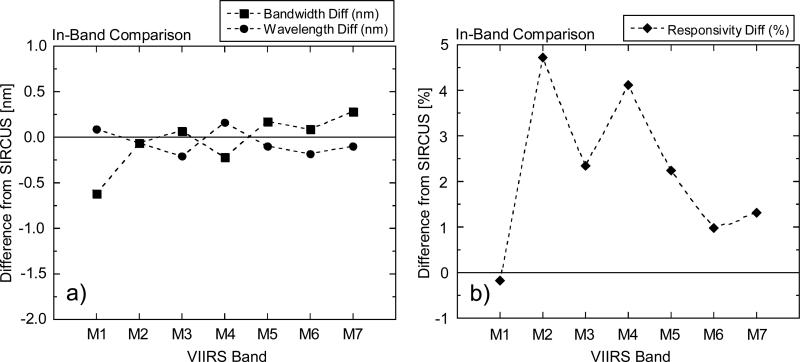
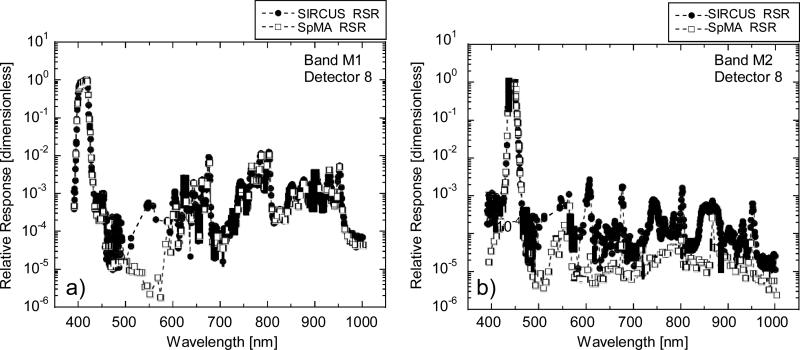
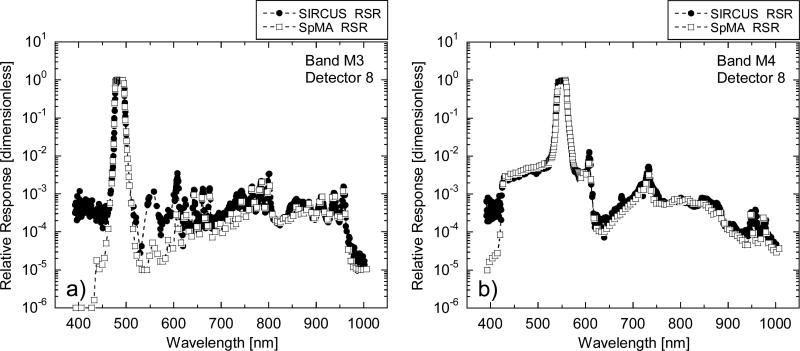
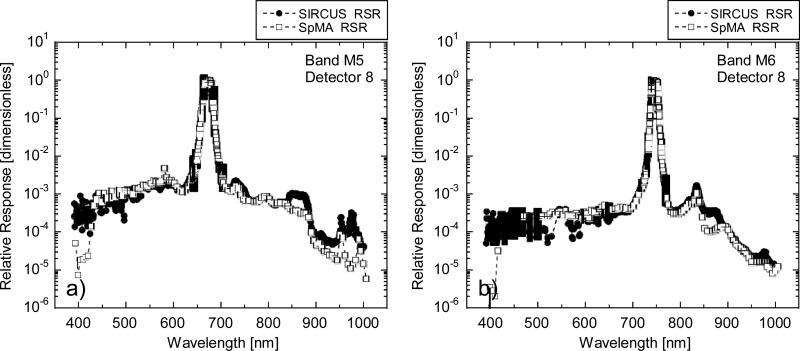
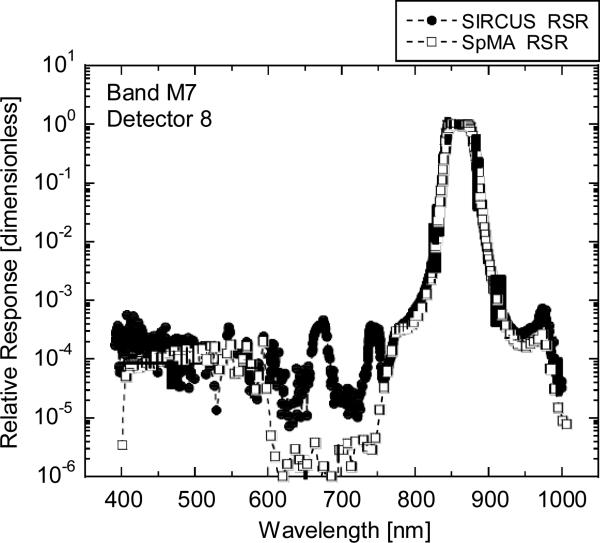
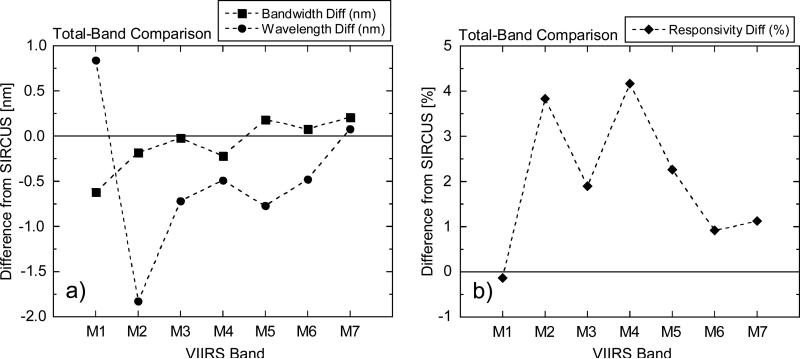
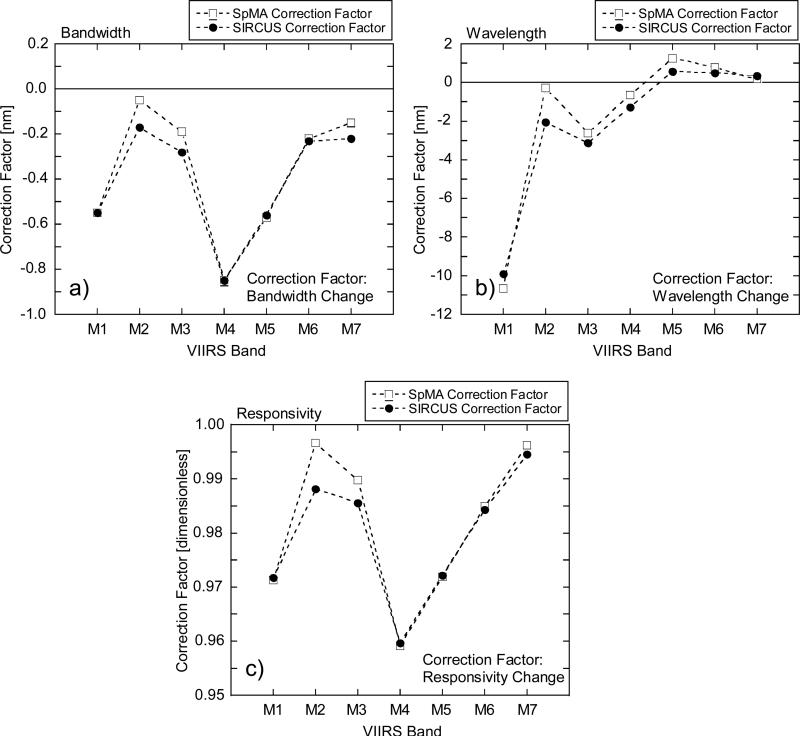
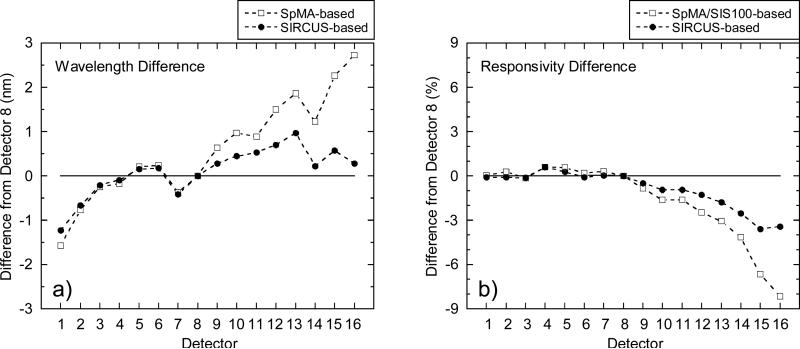
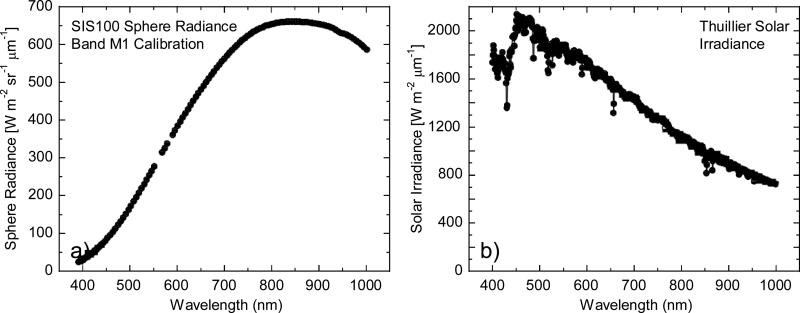
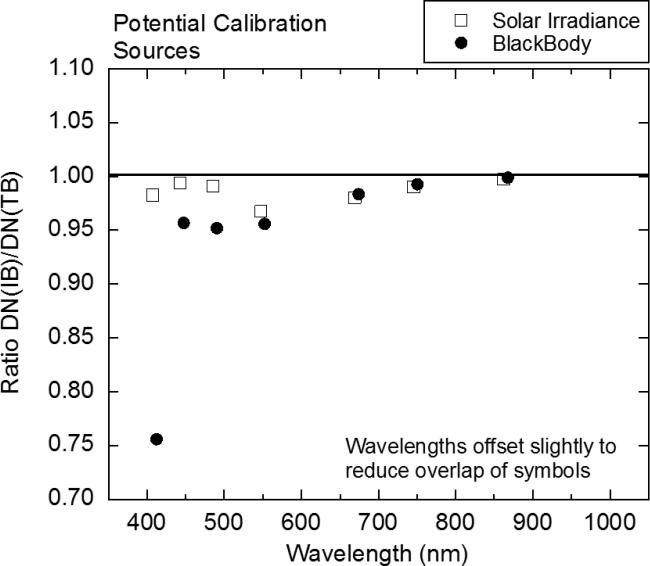
Traditionally, satellite instruments that measure Earth-reflected solar radiation in the visible and near infrared wavelength regions have been calibrated for radiance responsivity in a two-step method. In the first step, the relative spectral response (RSR) of the instrument is determined using a nearly monochromatic light source such as a lamp-illuminated monochromator. These sources do not typically fill the field of view of the instrument nor act as calibrated sources of light. Consequently, they only provide a relative (not absolute) spectral response for the instrument. In the second step, the instrument views a calibrated source of broadband light, such as a lamp-illuminated integrating sphere. The RSR and the sphere's absolute spectral radiance are combined to determine the absolute spectral radiance responsivity (ASR) of the instrument. More recently, a full-aperture absolute calibration approach using widely tunable monochromatic lasers has been developed. Using these sources, the ASR of an instrument can be determined in a single step on a wavelength-by-wavelength basis. From these monochromatic ASRs, the responses of the instrument bands to broadband radiance sources can be calculated directly, eliminating the need for calibrated broadband light sources such as lamp-illuminated integrating spheres. In this work, the traditional broadband source-based calibration of the Suomi National Preparatory Project Visible Infrared Imaging Radiometer Suite sensor is compared with the laser-based calibration of the sensor. Finally, the impact of the new full-aperture laser-based calibration approach on the on-orbit performance of the sensor is considered.


Figures

Figure 1
Figure 1
Schematic diagram of the Traveling SIRCUS facility.
Figure 2
Figure 2
Photograph of the Traveling SIRCUS SIS in front of the SNPP VIIRS sensor nadir doors
Figure 3
Figure 3
Spectral Response Measurements for VIIRS band M7, detector 8. Measurements are shown over the In-Band response region, where the responses are 1 % of full scale and greater. a) SpMA-based RSR and b) Tunable laser-based ASR.
Figure 4
Figure 4
Comparison of RSRs from the SpMA and SIRCUS for VIIRS band M1, detector 8. This comparison shows differences (SpMA from SIRCUS) at the SpMA wavelengths. The SIRCUS ASRs have been normalized to unity and interpolated to the SpMA wavelengths. Since SIRCUS provides a greater number of measurements per unit wavelength, the interpolation has removed details from the set of SIRCUS RSRs. a) SIRCUS and SpMA RSRs. b) Response Differences (SpMA from SIRCUS). The scale for the differences is given at the right-hand ordinate. The units for the differences are the same as those for the responses, themselves. An outline of the SIRCUS RSR is provided as a visual reference for the locations of the band edges.
Figure 5
Figure 5
Comparison of RSRs from the SpMA and SIRCUS for VIIRS band M2, detector 8. This comparison shows differences (SpMA from SIRCUS) at the SpMA wavelengths. The SIRCUS ASRs have been normalized to unity and interpolated to the SpMA wavelengths. Since SIRCUS provides a greater number of measurements per unit wavelength, the interpolation has removed details from the set of SIRCUS RSRs. a) SIRCUS and SpMA RSRs. b) Response Differences (SpMA from SIRCUS). The scale for the differences is given at the right-hand ordinate. The units for the differences are the same as those for the responses, themselves. An outline of the SIRCUS RSR is provided as a visual reference for the locations of the band edges.
Figure 6
Figure 6
Comparison of RSRs from the SpMA and SIRCUS for VIIRS band M3, detector 8. This comparison shows differences (SpMA from SIRCUS) at the SpMA wavelengths. The SIRCUS ASRs have been normalized to unity and interpolated to the SpMA wavelengths. Since SIRCUS provides a greater number of measurements per unit wavelength, the interpolation has removed details from the set of SIRCUS RSRs. a) SIRCUS and SpMA RSRs. b) Response Differences (SpMA from SIRCUS). The scale for the differences is given at the right-hand ordinate. The units for the differences are the same as those for the responses, themselves. An outline of the SIRCUS RSR is provided as a visual reference for the locations of the band edges.
Figure 7
Figure 7
Comparison of RSRs from the SpMA and SIRCUS for VIIRS band M4, detector 8. This comparison shows differences (SpMA from SIRCUS) at the SpMA wavelengths. The SIRCUS ASRs have been normalized to unity and interpolated to the SpMA wavelengths. Since SIRCUS provides a greater number of measurements per unit wavelength, the interpolation has removed details from the set of SIRCUS RSRs. a) SIRCUS and SpMA RSRs. b) Response Differences (SpMA from SIRCUS). The scale for the differences is given at the right-hand ordinate. The units for the differences are the same as those for the responses, themselves. An outline of the SIRCUS RSR is provided as a visual reference for the locations of the band edges.
Figure 8
Figure 8
Comparison of RSRs from the SpMA and SIRCUS for VIIRS band M5, detector 8. This comparison shows differences (SpMA from SIRCUS) at the SpMA wavelengths. The SIRCUS ASRs have been normalized to unity and interpolated to the SpMA wavelengths. Since SIRCUS provides a greater number of measurements per unit wavelength, the interpolation has removed details from the set of SIRCUS RSRs. a) SIRCUS and SpMA RSRs. b) Response Differences (SpMA from SIRCUS). The scale for the differences is given at the right-hand ordinate. The units for the differences are the same as those for the responses, themselves. An outline of the SIRCUS RSR is provided as a visual reference for the locations of the band edges.
Figure 9
Figure 9
Comparison of RSRs from the SpMA and SIRCUS for VIIRS band M6, detector 8. This comparison shows differences (SpMA from SIRCUS) at the SpMA wavelengths. The SIRCUS ASRs have been normalized to unity and interpolated to the SpMA wavelengths. Since SIRCUS provides a greater number of measurements per unit wavelength, the interpolation has removed details from the set of SIRCUS RSRs. a) SIRCUS and SpMA RSRs. b) Response Differences (SpMA from SIRCUS). The scale for the differences is given at the right-hand ordinate. The units for the differences are the same as those for the responses, themselves. An outline of the SIRCUS RSR is provided as a visual reference for the locations of the band edges.
Figure 10
Figure 10
Comparison of RSRs from the SpMA and SIRCUS for VIIRS band M7, detector 8. This comparison shows differences (SpMA from SIRCUS) at the SpMA wavelengths. The SIRCUS ASRs have been normalized to unity and interpolated to the SpMA wavelengths. Since SIRCUS provides a greater number of measurements per unit wavelength, the interpolation has removed details from the set of SIRCUS RSRs. a) SIRCUS and SpMA RSRs. b) Response Differences (SpMA from SIRCUS). The scale for the differences is given at the right-hand ordinate. The units for the differences are the same as those for the responses, themselves. An outline of the SIRCUS RSR is provided as a visual reference for the locations of the band edges.
Figure 11
Figure 11
Differences from SIRCUS of the In-Band bandwidths, center wavelengths, and responsivities of the laboratory-based calibration by the instrument manufacturer. a) Differences of the SpMA-based bandwidths and center wavelengths from SIRCUS (in nm). b) Differences of the SpMA-based responsivities from SIRCUS (in percent).
Figure 12
Figure 12
Total-Band RSRs for bands M1 and M2. The open squares come from SpMA measurements; the closed circles from SIRCUS. a) RSRs for VIIRS band M1. b) RSRs for VIIRS band M2.
Figure 13
Figure 13
Total-Band RSRs for bands M3 and M4. The open squares come from SpMA measurements; the closed circles from SIRCUS. a) RSRs for VIIRS band M3. b) RSRs for VIIRS band M4.
Figure 14
Figure 14
Total-Band RSRs for bands M5 and M6. The open squares come from SpMA measurements; the closed circles from SIRCUS. a) RSRs for VIIRS band M5. b) RSRs for VIIRS band M5.
Figure 15
Figure 15
Total-Band RSRs for band M7. The open squares come from SpMA measurements; the closed circles from SIRCUS.
Figure 16
Figure 16
Differences from SIRCUS of the Total-Band bandwidths, center wavelengths, and responsivities of the laboratory-based calibration by the instrument manufacturer. a) Differences of the SpMA-based bandwidths, and center wavelengths from SIRCUS (in nm). b) Differences of the SpMA/SIS100-based responsivities from SIRCUS (in percent).
Figure 17
Figure 17
Correction factors changing Total-Band bandwidths and responsivities to their In-Band counterparts. a) Correction factors for bandwidth. b) Correction factors for band-center center wavelength. c) Correction factors for responsivity.
Figure 18
Figure 18
Detector-to-detector differences for VIIRS band M1. The differences are normalized to detector 8. The SpMA-based differences are shown as open squares; the SIRCUS-based differences as solid circles. a) Center wavelength differences in nm. b) Responsivity differences in percent.
Figure 19
Figure 19
Comparison of a laboratory and an on-orbit source .spectrum. a) SIS100 radiance spectrum used in the laboratory to calibrate SNPP VIIRS band M1. b) Solar irradiance spectrum from the Thuillier et al. (ref. ) solar model. Note the marked difference in their respective spectral distributions.
Figure 20
Figure 20
The In-Band to Total-Band ratios (IB/TB) for bands M1 through M7 for a source with a solar distribution and a source with a 2856 K distribution. These are the errors arising from the Out-of-Band responses in the bands. The source spectra are shown in Fig. 19.
Figure 21
Figure 21
Three nominal Top-of-the-Atmosphere (TOA) radiance spectra (ref. ). The symbols give the model TOA radiances without trace gas absorption. The dashed lines give the radiances with trace gas absorption included. See the reference for details on the derivation of the spectra. a) TOA radiances over a blue ocean. b) TOA radiances over a grassland. c) TOA radiances over a desert.
Figure 22
Figure 22
IB/TB ratios for three Earth scenes relative to a solar calibration spectrum (open symbols) and a 2856 K blackbody spectrum (closed symbols). The ratios show the errors arising from the use of calibration spectra that are different from the spectra measured on orbit. a) Full Scale. b) Expanded scale.
Figure 23
Figure 23
Effect of trace gas absorption on the measurements (ratio of with absorption to without). These are the errors due to trace gas absorption.
Figure 24
Figure 24
Histograms of out-of-band measurement biases arising from different VIIRS calibration sources, shown in bold type on the top left hand side of each graph. A total of 275 spectra with different atmospheric and oceanic properties were used to develop the histograms.

References

    1. Schueler C, Clement JE, Darnton L, DeLuccia F, Scalione T, Swenson H. VIIRS sensor performance. International Geosciences and Remote Sensing Symposium (IGSRSS) Proceedings. 2003 Jul;
    1. Murphy R, Barnes W, Lyapustin A, Privette J, Welsch C, DeLuccia F, Swenson H, Schueler C, Ardanuy P, Kealy P. Using VIIRS to provide data continuity with MODIS. International Geosciences and Remote Sensing Symposium (IGARSS) Proceedings. 2001 Jul;
    1. Schueler C, Clement JE, Ardanuy P, Welsch C, DeLuccia F, Swenson H. NPOESS VIIRS sensor design overview. Proc. SPIE. 2002;4483:11–23.
    1. Butler JJ, Johnson BC, Brown SW, Saunders RD, Biggar SF, Zalweski EF, Markham BL, Gracey PN, Young JB, Barnes RA. Radiometric measurement comparison on the integrating sphere source used to calibrate the Moderate Imaging Spectroradiometer (MODIS) and the Landsat 7 Enhanced Thematic Mapper (ETM+) J. Res. Natl. Inst. Stand. Technol. 2003;108:199–228. - PMC - PubMed
    1. Brown SW, Eppeldauer GP, Lykke KR. Facility for spectral irradiance and radiance responsivity calibrations using uniform sources. Appl. Opt. 2006;45:8218–8237. - PubMed