. 2016 May;128(2):195-214.
doi: 10.1007/s11120-016-0219-0. Epub 2016 Feb 2.

Deconvolution of ferredoxin, plastocyanin, and P700 transmittance changes in intact leaves with a new type of kinetic LED array spectrophotometer

Affiliations

Deconvolution of ferredoxin, plastocyanin, and P700 transmittance changes in intact leaves with a new type of kinetic LED array spectrophotometer

Christof Klughammer et al. Photosynth Res. 2016 May.

Abstract

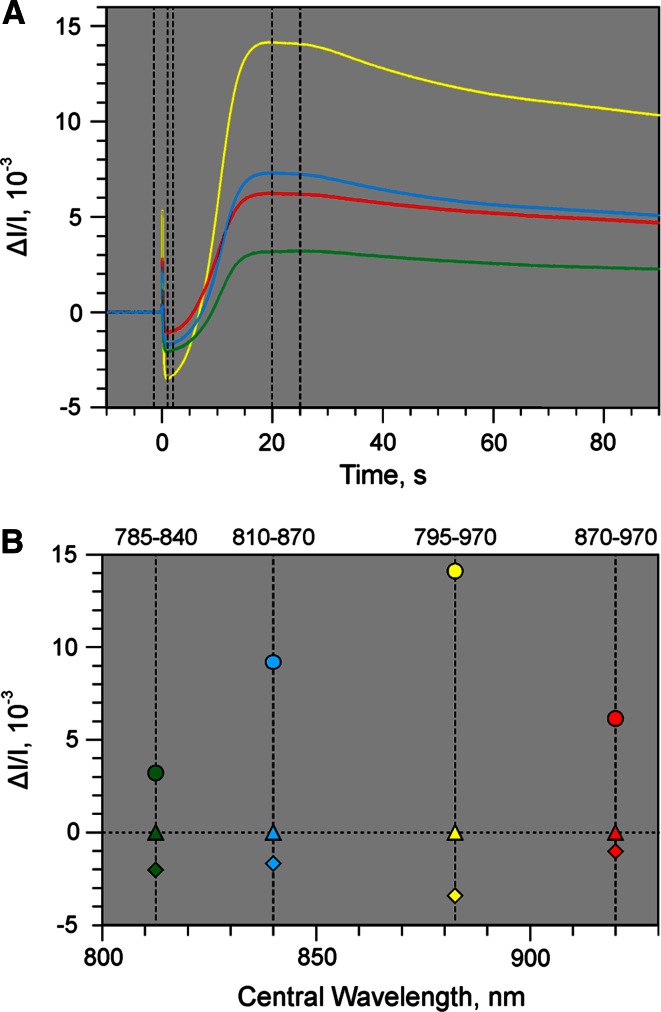
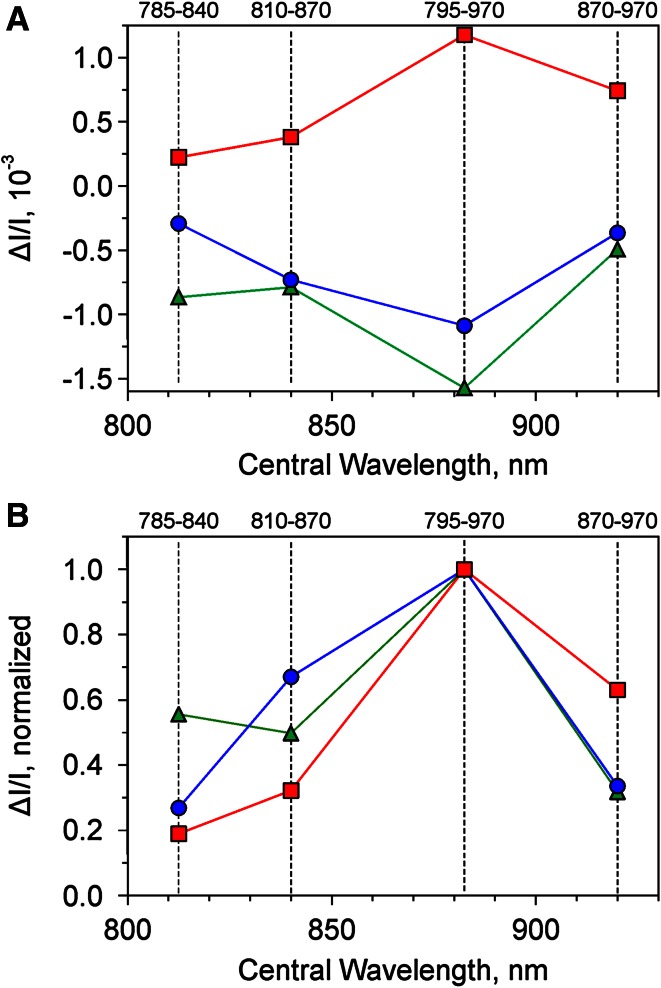
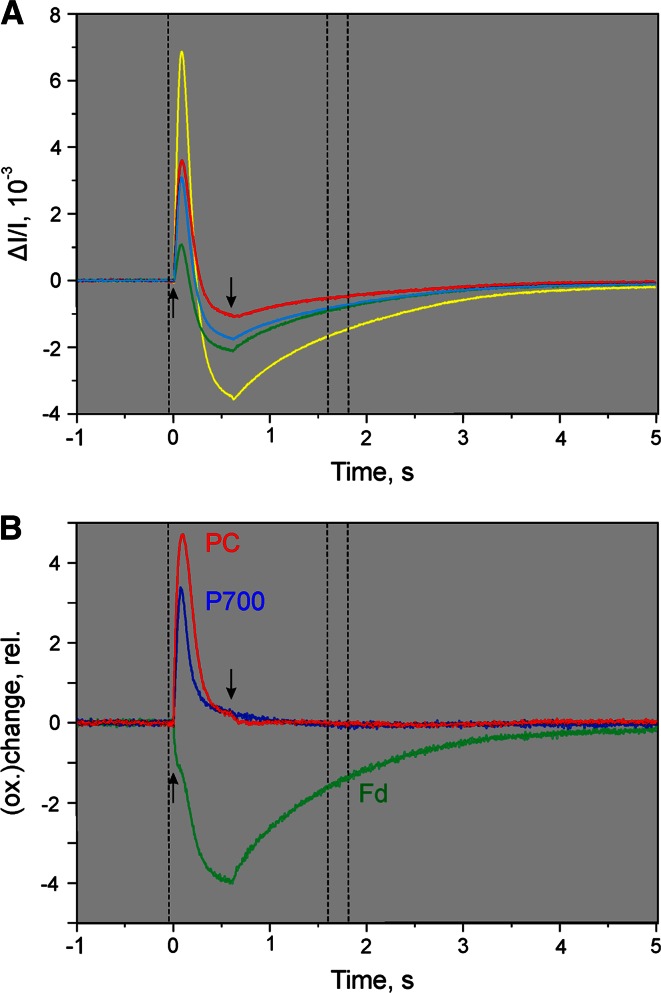
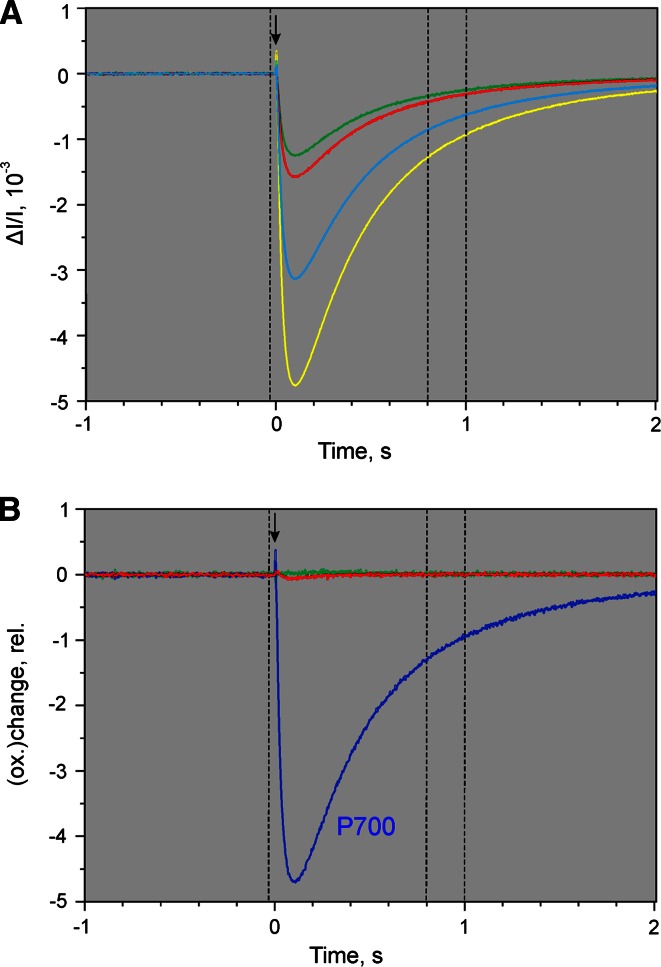
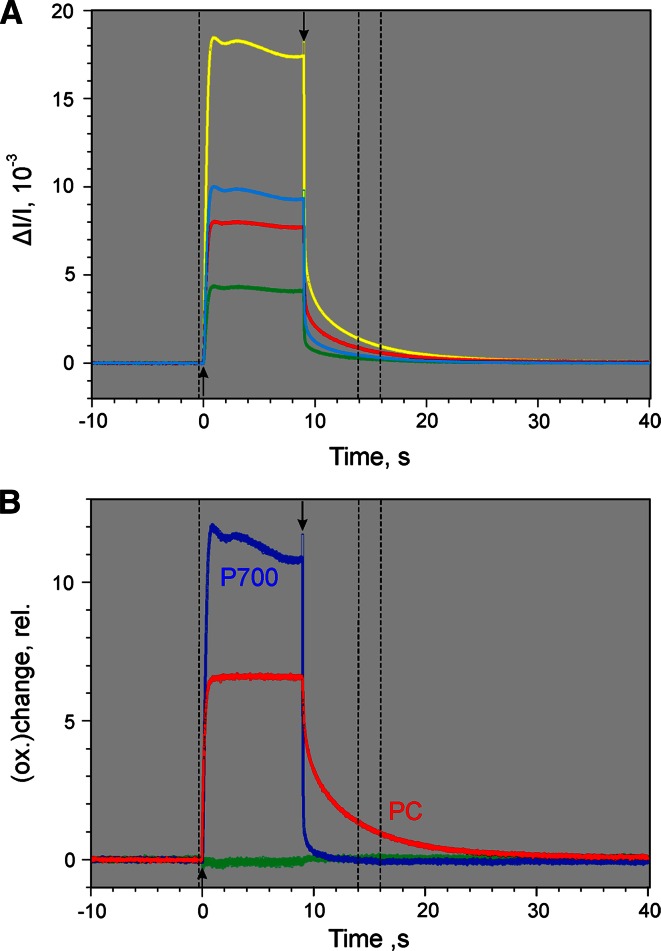
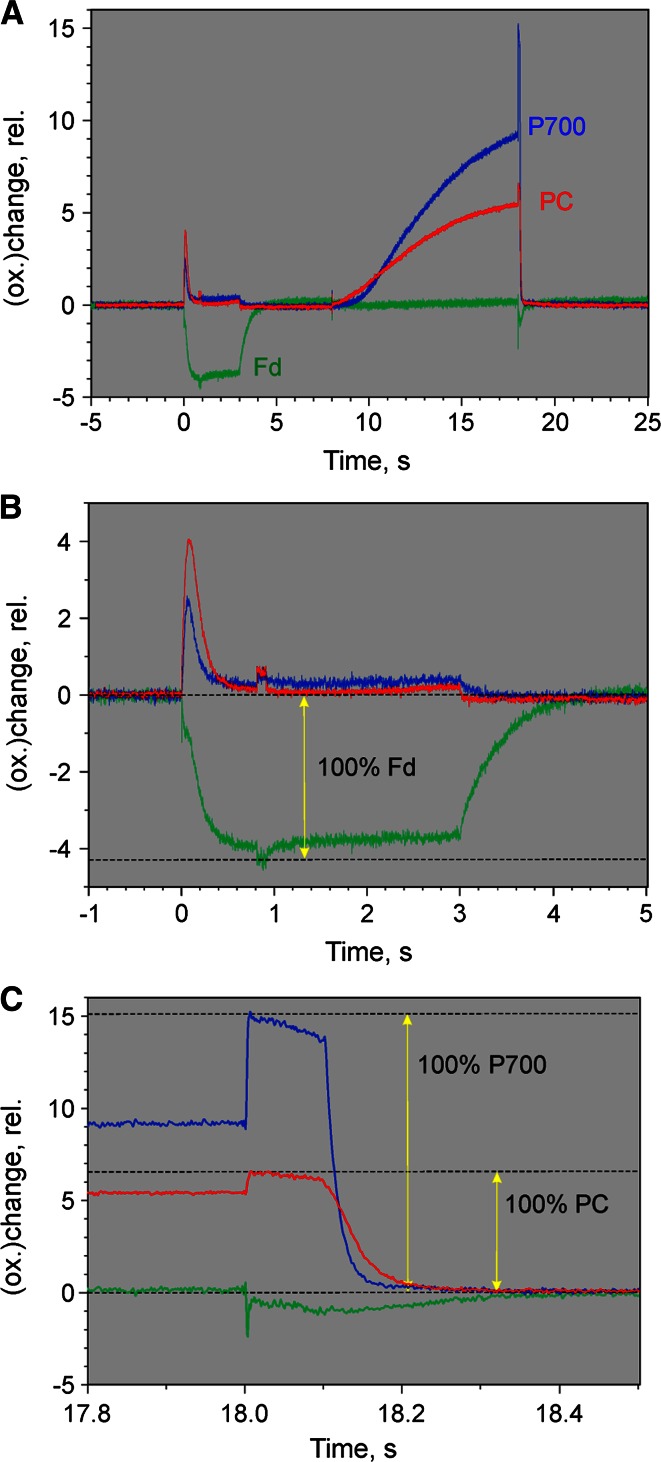
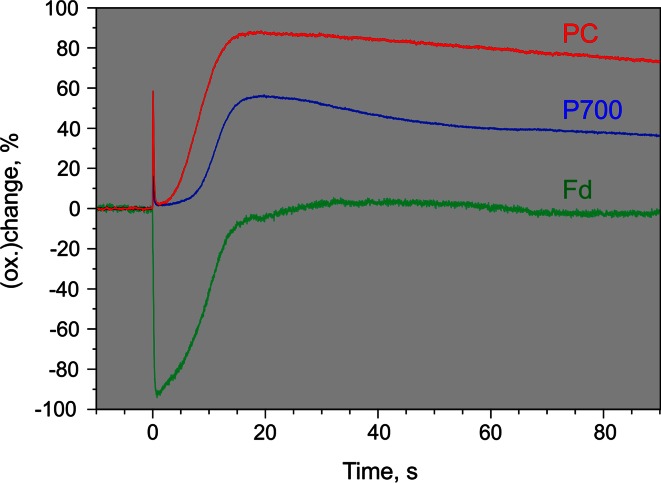
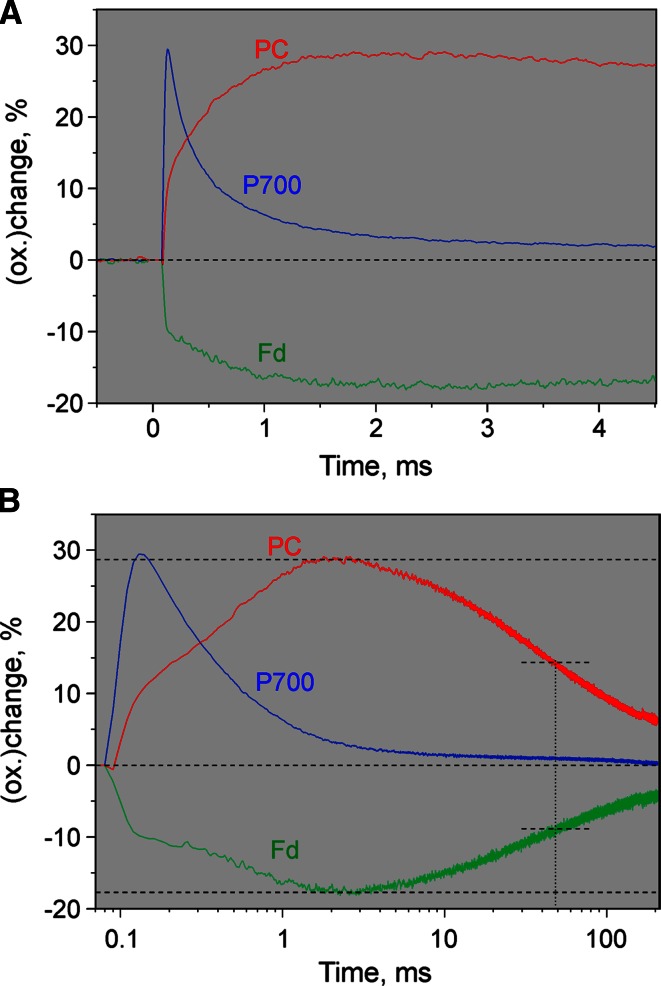
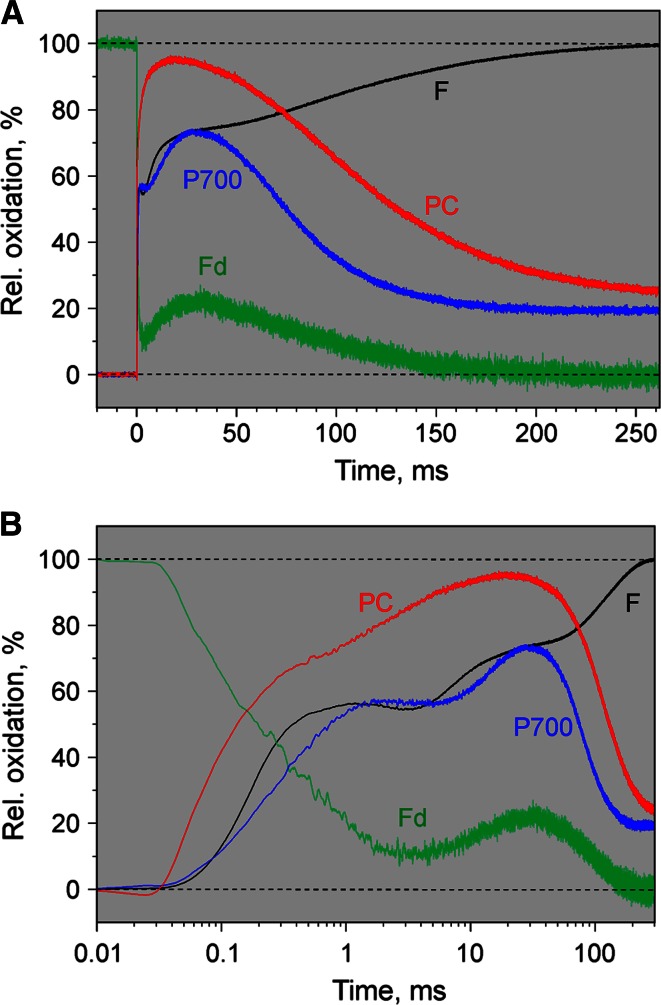
A newly developed compact measuring system for assessment of transmittance changes in the near-infrared spectral region is described; it allows deconvolution of redox changes due to ferredoxin (Fd), P700, and plastocyanin (PC) in intact leaves. In addition, it can also simultaneously measure chlorophyll fluorescence. The major opto-electronic components as well as the principles of data acquisition and signal deconvolution are outlined. Four original pulse-modulated dual-wavelength difference signals are measured (785-840 nm, 810-870 nm, 870-970 nm, and 795-970 nm). Deconvolution is based on specific spectral information presented graphically in the form of 'Differential Model Plots' (DMP) of Fd, P700, and PC that are derived empirically from selective changes of these three components under appropriately chosen physiological conditions. Whereas information on maximal changes of Fd is obtained upon illumination after dark-acclimation, maximal changes of P700 and PC can be readily induced by saturating light pulses in the presence of far-red light. Using the information of DMP and maximal changes, the new measuring system enables on-line deconvolution of Fd, P700, and PC. The performance of the new device is demonstrated by some examples of practical applications, including fast measurements of flash relaxation kinetics and of the Fd, P700, and PC changes paralleling the polyphasic fluorescence rise upon application of a 300-ms pulse of saturating light.

Keywords: Chlorophyll fluorescence; Cyclic electron transport; FeS proteins; Flash relaxation kinetics; Photosystem I; Polyphasic fluorescence rise; Thioredoxin.


Figures

Fig. 1
Fig. 1
Schematic view of the major components of the newly developed measuring system. At the core of the Emitter unit is the chip-on-board LED array COB #1 which provides the NIR-ML for the four difference signals. Actinic illumination (AL) single and multiple turnover flashes (ST and MT) are applied at both sides of the green leaf using COBs #2 and #3 in the Emitter and Detector units, respectively. The various light qualities are guided and randomly mixed via Perspex rods (14). The transmitted light passes the filter set (5) eliminating wavelengths <720 nm. For further explanations see text
Fig. 2
Fig. 2
Normalized emission spectra of the four NIR-ML wavelength pairs employed for measuring the four transmittance difference signals 785–840 nm (green ‘Fd’), 795–970 nm (yellow ‘All’), 810–870 nm (blue ‘P700’), and 870–970 nm (red ‘PC’). See text for further explanations
Fig. 3
Fig. 3
Scheme outlining data acquisition and deconvolution. Transmittance signals originating from four pairs of pulse-modulated NIR-ML are zeroed and calibrated before recording of light-induced changes. On-line deconvolution of Fd, P700, and PC redox changes is based on ‘differential model plots’ saved in computer memory. See text for further explanations
Fig. 4
Fig. 4
Light-induced changes of the four transmittance difference signals 785–840 nm (green), 795–970 nm (yellow), 810–870 nm (blue), and 870–970 nm (red). Dark-adapted ivy leaf, 300 µmol photons m−2s−1 (630 nm) actinic illumination. a Original kinetic recordings (single measurement). Broken vertical lines refer to time windows defining the zero baseline (before AL-on) and the sampling periods (1–2 s and 20–25 s), over which the ΔI/I values are averaged that are used for the ‘differential plots’ in panel b. b Graphical presentation of the two sets of averaged values derived for the two time periods defined in panel a in the form of ‘differential plots’: positive values for 20–25 s window, negative values for 1–2 s window. The averaged ΔI/I values of the four difference signals are plotted against the central wavelengths of the four wavelength pairs
Fig. 5
Fig. 5
Selective dual-wavelength difference transmittance changes in a dark-green leaf of Hedera helix of Fd (green), P700 (blue), and PC (red) measured with the new device under the specific conditions outlined in the text, presented in the form of ‘differential plots’. Central wavelength refers to the mean values of the wavelengths of the four pairs indicated by the four broken vertical lines. a Original values of ΔI/I describing selective reduction of Fd, selective reduction of P700, and selective oxidation of PC. The original measurements of these selective changes will be presented below under ‘Results and discussion’ (Figs. 6, 7, 8). b Normalized values of ΔI/I derived from the original values in panel A, representative for selective oxidation of Fd, P700, and PC. The spectral information contained in this normalized plot (called differential model plot) is applied for deconvolution of redox changes of Fd, P700, and PC with the new device
Fig. 6
Fig. 6
Determination of differential model plot of Fd (Fd-DMP). Dark-adapted ivy leaf illuminated for 0.6 s at 300 µmol photons m−2s−1. 1 min before AL-on a 5-ms MT pulse with 10,000 µmol photons m−2s−1 was applied. Average of four recordings measured with 10 min repetition rate. Broken vertical lines refer to time windows defining zero baseline and ΔI/I values for DMP. a Original recording of difference signals: Green 785–840 nm; yellow 795–970 nm; blue 810–870 nm; red 870–970 nm. b Kinetics of Fd, P700, and PC deconvoluted from the original kinetics in panel a, based on the DMP displayed in Fig. 5. Upwards and downwards arrows marking AL-on and AL-off, respectively
Fig. 7
Fig. 7
Determination of differential model plot of P700 (P700-DMP). Preilluminated ivy leaf (10 min 630 nm at 300 µmol photons m−2s−1 plus 3 min dark time plus 3 min 740 nm background light at 40 µmol photons m−2s−1). Application of 5 µs ST at time 0 (downward arrow) in presence of the 740 nm background light. Average of 25 recordings measured with 20 s repetition rate. a Original difference signals. b Deconvoluted signals. See legend of Fig. 6 for further explanations
Fig. 8
Fig. 8
Determination of differential model plot of PC (PC-DMP). Preilluminated ivy leaf (5 min 740 nm at quantum flux density of 360 µmol photons m−2s−1 plus 30 s dark time). Onset of 9 s FR illumination period with 360 µmol photons m−2s−1 at time 0 (upward arrow). Simultaneously with FR-off application of 50 µs ST (downward arrow). Average of four recordings measured with 3 min repetition rate. a Original difference signals. b Deconvoluted signals. See legend of Fig. 6 for further explanations
Fig. 9
Fig. 9
Determination of the relative amplitudes of 100 % redox changes of Fd, P700, and PC in a dark-green ivy leaf, which served for scaling of the 100 % DMP values in Table 1. a Redox changes induced after dark-adaptation during the course of a pre-programed ‘Triggered Run’ involving a 3-s illumination period with 630 nm AL at 300 µmol photons m−2s−1 starting at time 0, application of 100 ms MT with 10,000 µmol photons m−2s−1 at 0.8 and 18 s, as well as 10 s illumination period with 740 nm FR (360 µmol photons m−2s−1) starting at 8 s. b Zoomed detail of recording in panel a depicting determination of 100 % Fd change. c Zoomed detail of recording in panel a depicting determination of 100 % P700 and PC changes
Fig. 10
Fig. 10
Deconvoluted kinetics of light-induced Fd, P700, and PC changes derived from original recordings of difference signals in Fig. 4, with display of ±100 % redox changes. Deconvolution based on determinations of 100 % changes in Fig. 9 and the derived 100 % DMP values listed in Table 1. For conditions see legend of Fig. 4
Fig. 11
Fig. 11
Redox changes of Fd, P700, and PC induced by a non-saturating 20 µs flash in a dark-adapted ivy leaf. Application of special Script routine for repetitive measurements of individual dual-wavelength difference signals at maximal time resolution (see ‘Materials and methods’). 100 recordings of each difference signal were averaged before deconvolution. a Linear time scale. b Logarithmic time scale. Maximal levels of PC oxidation and Fd reduction as well as 50 % re-reduction of PC and reoxidation of Fd are indicated
Fig. 12
Fig. 12
Comparison of polyphasic fluorescence rise and deconvoluted redox changes of Fd, P700, and PC induced upon illumination of dark-adapted ivy leaf with a strong 300 ms MT pulse (15,000 µmol photons m−2s−1 630 nm). Repetitive measurements of individual dual-wavelength signals and fluorescence signal at maximal time resolution with 3 min dark times between MT applications. Averages of 23 recordings of each difference signal and fluorescence. a Linear time scale. b Logarithmic time scale. F, variable fluorescence, with 0 % signal corresponding to minimal fluorescence yield Fo (O-level) and 100 % to maximal yield Fm (P-level); the amplitude reached at the end of the photochemical phase at about 1 ms corresponds to the I 1-level (Schreiber 1986) or J-level (Strasser et al. 1995) and the amplitude reached at the end of the first thermal phase at 30–50 ms to the I 2- or I-level, respectively

Similar articles

Cited by

References

    1. Albertsson P-A. A quantitative model of the domain structure of the photosynthetic membrane. Trends Plant Sci. 2001;6(8):349–354. doi: 10.1016/S1360-1385(01)02021-0. - DOI - PubMed
    1. Anderson JW, Done J. Light dependent assimilation of nitrite by isolated chloroplasts. Plant Physiol. 1978;61:692–697. doi: 10.1104/pp.61.4.692. - DOI - PMC - PubMed
    1. Arnon DI, Chain RK. Regulation of ferredoxin-catalyzed photosynthetic phosphorylation. Proc Natl Acad Sci USA. 1975;72(12):4961–4965. doi: 10.1073/pnas.72.12.4961. - DOI - PMC - PubMed
    1. Aronsson H, Schöttler M, Kelly AA, Sundquist C, Dörmanns P, Karim S, Jarvis P. Monogalactosyldiacylglycerol deficiency in Arabidopsis affects pigment composition in the prolamellar body and impairs thylakoid membrane energization and photoprotection in leaves. Plant Physiol. 2008;148:580–592. doi: 10.1104/pp.108.123372. - DOI - PMC - PubMed
    1. Asada K. The water-water cycle in chloroplasts: scavenging of active oxygen and dissipation of excess photons. Annu Rev Plant Physiol Plant Mol Biol. 1999;50:601–639. doi: 10.1146/annurev.arplant.50.1.601. - DOI - PubMed