. 2016 Feb 3:7:10521.
doi: 10.1038/ncomms10521.

Endothelial Dicer promotes atherosclerosis and vascular inflammation by miRNA-103-mediated suppression of KLF4

Affiliations

Endothelial Dicer promotes atherosclerosis and vascular inflammation by miRNA-103-mediated suppression of KLF4

Petra Hartmann et al. Nat Commun. .

Erratum in

Abstract

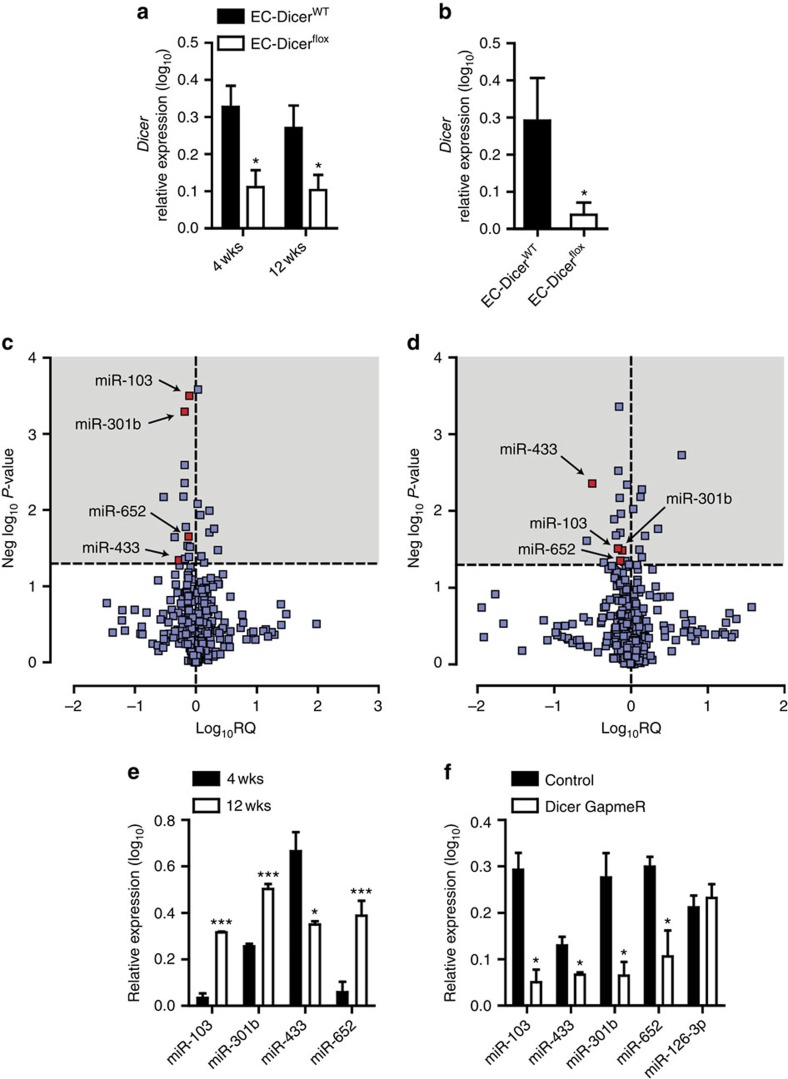
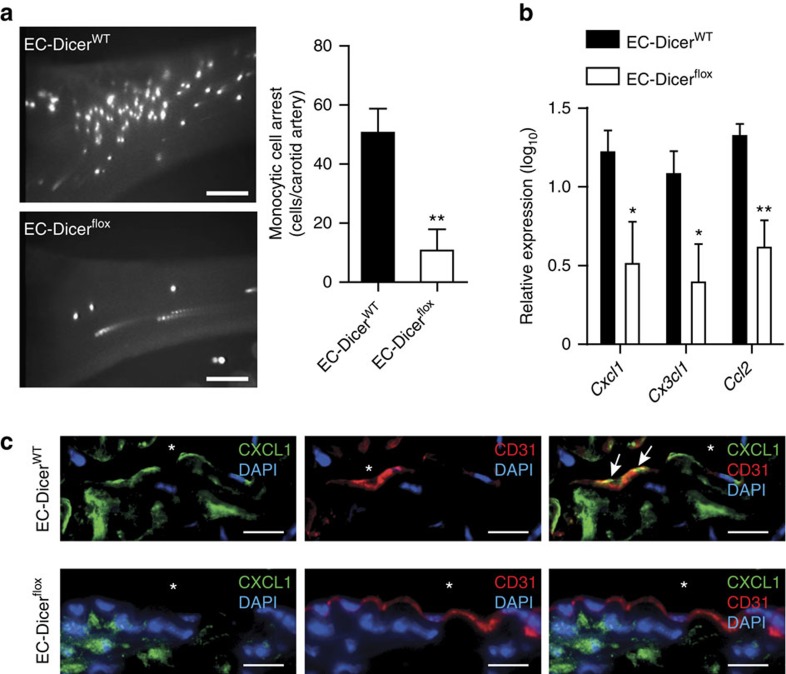
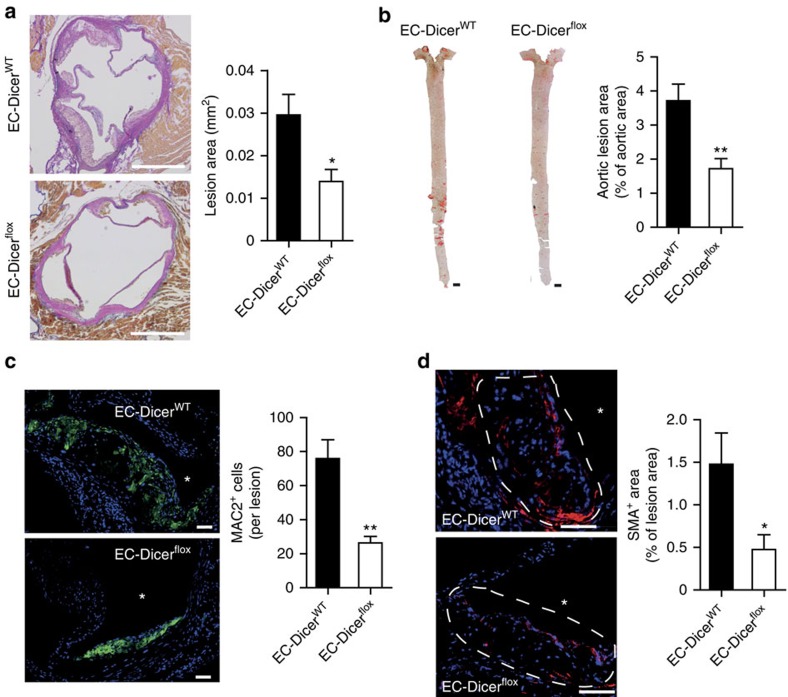
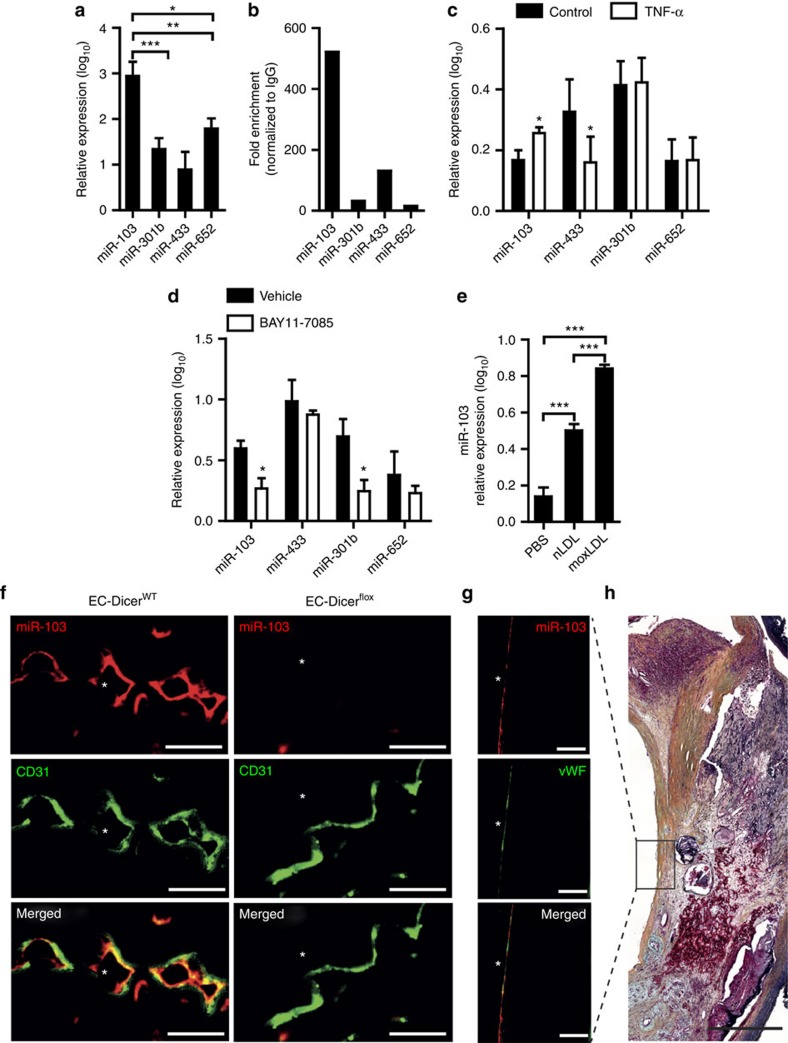
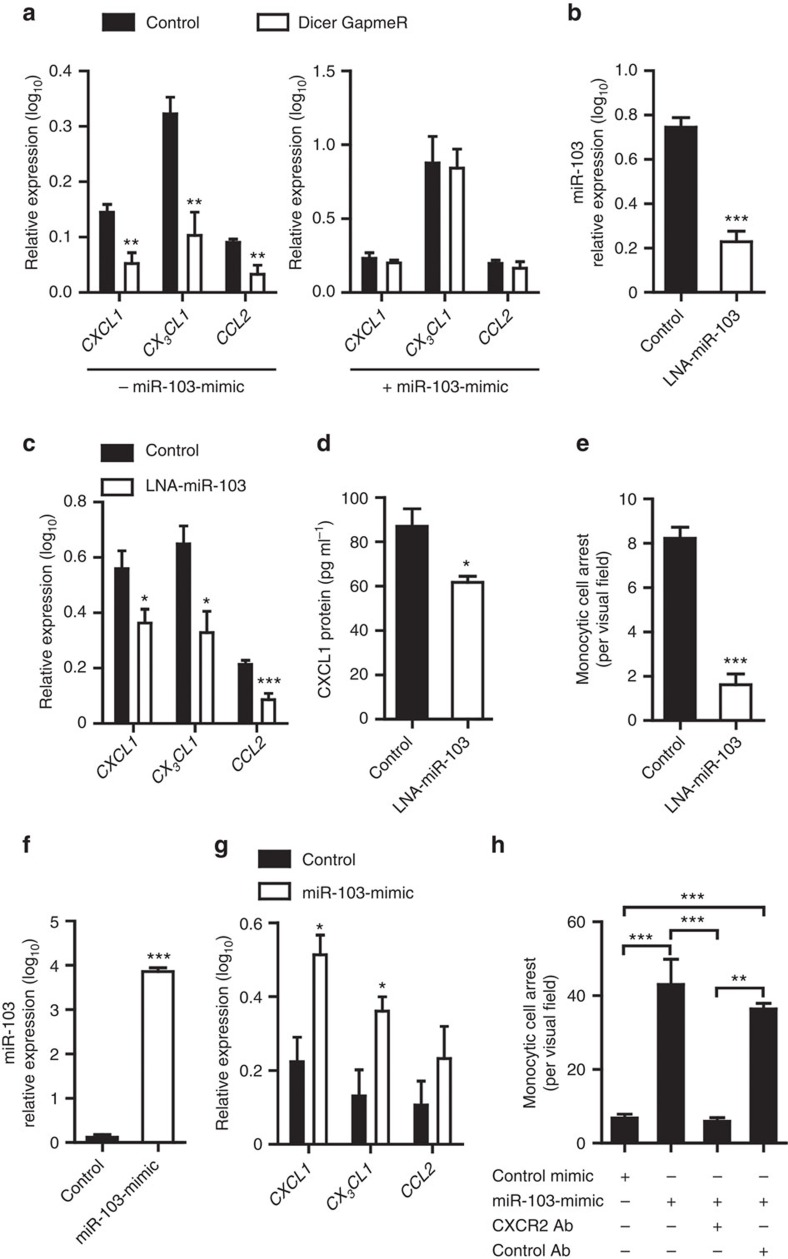
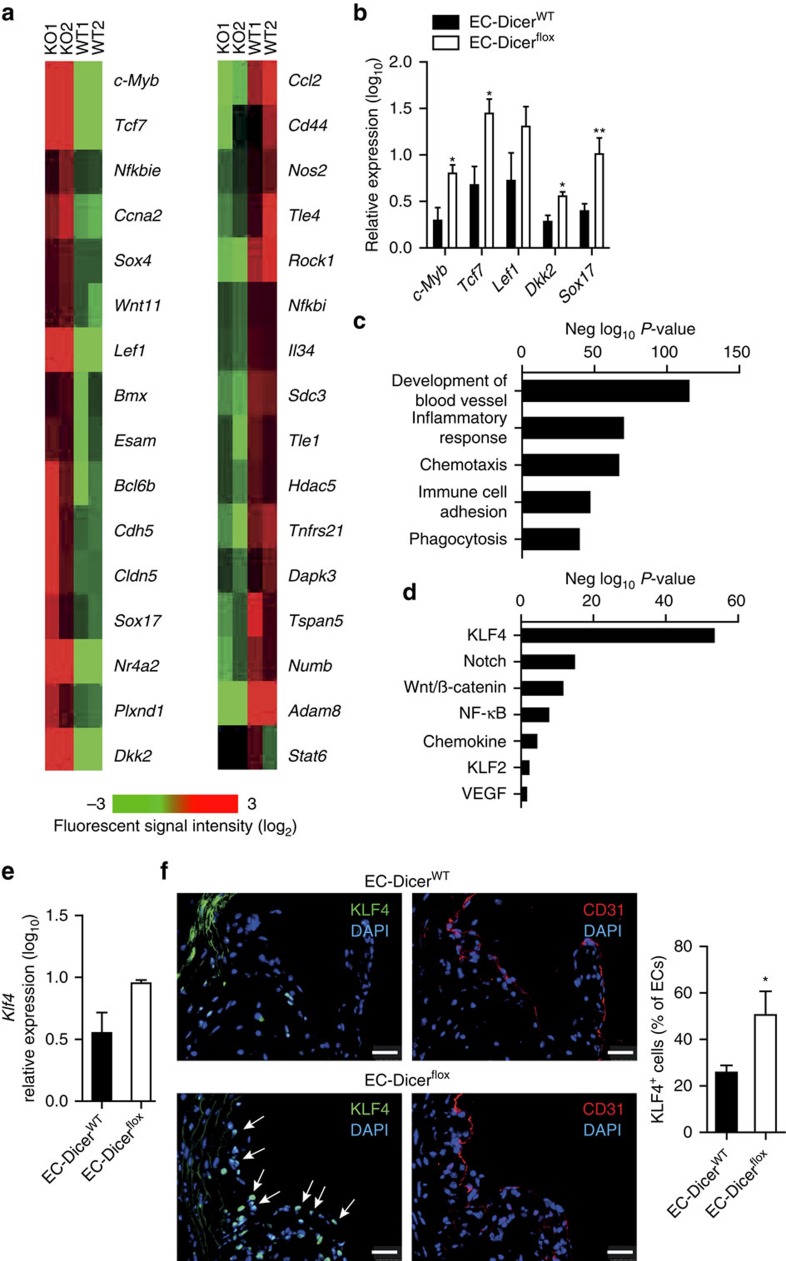
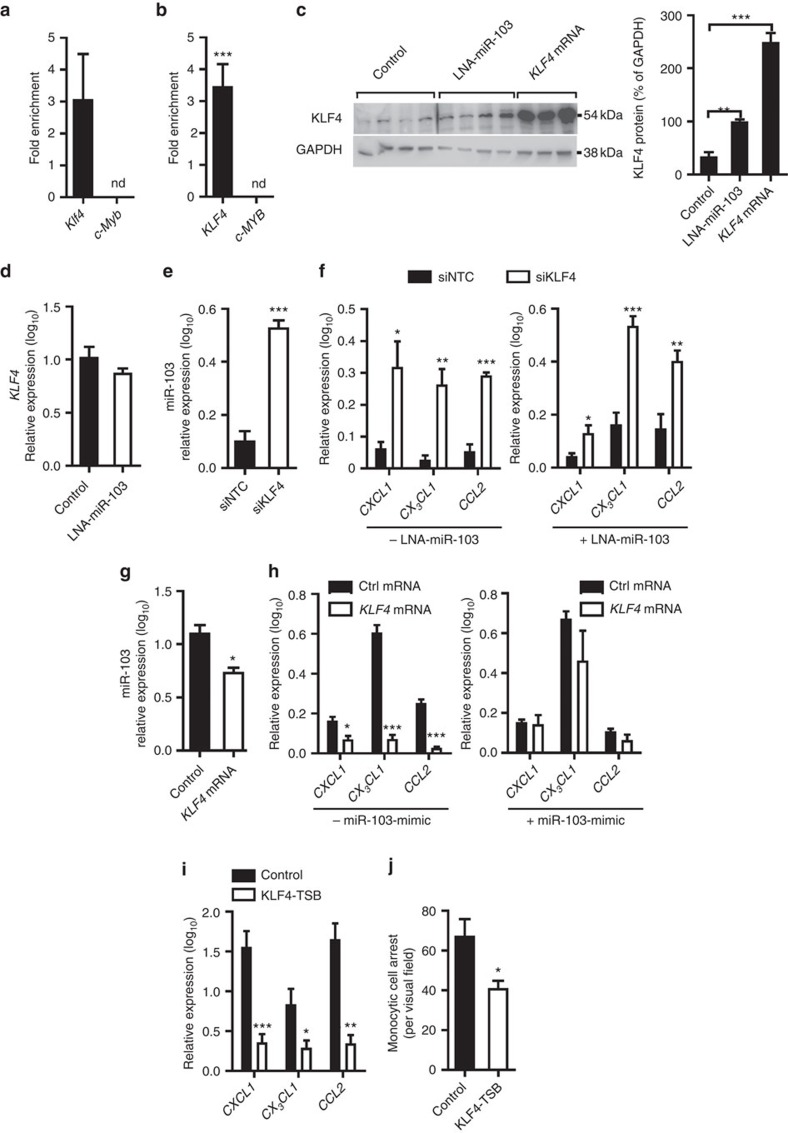
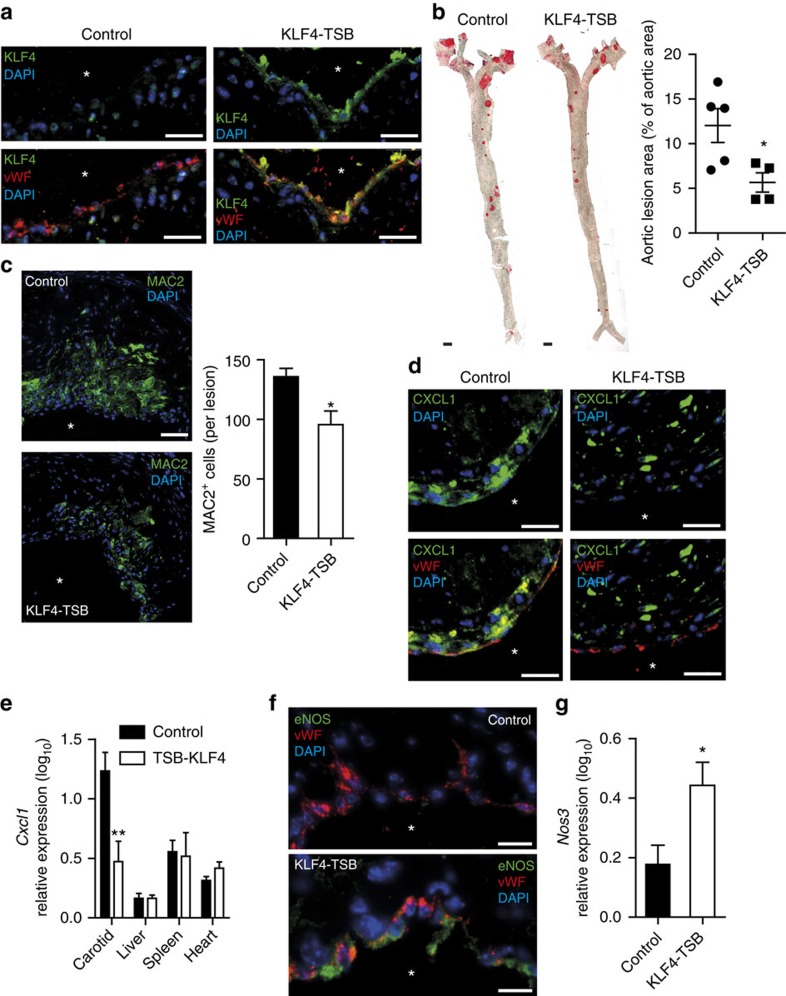
MicroRNAs regulate the maladaptation of endothelial cells (ECs) to naturally occurring disturbed blood flow at arterial bifurcations resulting in arterial inflammation and atherosclerosis in response to hyperlipidemic stress. Here, we show that reduced endothelial expression of the RNAse Dicer, which generates almost all mature miRNAs, decreases monocyte adhesion, endothelial C-X-C motif chemokine 1 (CXCL1) expression, atherosclerosis and the lesional macrophage content in apolipoprotein E knockout mice (Apoe(-/-)) after exposure to a high-fat diet. Endothelial Dicer deficiency reduces the expression of unstable miRNAs, such as miR-103, and promotes Krüppel-like factor 4 (KLF4)-dependent gene expression in murine atherosclerotic arteries. MiR-103 mediated suppression of KLF4 increases monocyte adhesion to ECs by enhancing nuclear factor-κB-dependent CXCL1 expression. Inhibiting the interaction between miR-103 and KLF4 reduces atherosclerosis, lesional macrophage accumulation and endothelial CXCL1 expression. Overall, our study suggests that Dicer promotes endothelial maladaptation and atherosclerosis in part by miR-103-mediated suppression of KLF4.


Figures

Figure 1
Figure 1. Effect of endothelial Dicer on miRNA expression during atherosclerosis.
(a) Quantitative RT–PCR analyses of Dicer mRNA expression in the aortas from TMX-treated EC-DicerWT and EC-Dicerflox mice fed a HFD for 4 or 12 weeks (wks; n=5 mice per group). (b) Dicer mRNA expression levels in aortic ECs isolated from EC-DicerWT and EC-Dicerflox mice 2 weeks after TMX injection (n=3 per group). (c,d) Differentially expressed miRNAs (grey areas) in the aortas of EC-Dicerflox mice compared with EC-DicerWT mice (n=3 mice per group) after exposure to a HFD for 4 (c) or 12 weeks (d). The expression profiles were determined using qRT–PCR arrays. RQ, relative quantification. (e) The expression levels of miR-103, miR-301b, miR-433 and miR-652 in the aortas of EC-DicerWT mice fed a HFD for 4 or 12 weeks (n=3 mice per group). (f) Quantitative RT–PCR analyses of miR-103, miR-301b, miR-433, miR-652 and miR-126-3p expression in human aortic ECs (HAECs) treated with Dicer-specific LNA-GapmeRs or non-targeting control LNA-GapmeRs (n=3–4 per group). The data are represented as the mean±s.e.m. of the indicated number (n) of repeats. *P<0.05; **P<0.01 and ***P<0.001 by Student's t-test.
Figure 2
Figure 2. Role of endothelial Dicer in atherogenic monocyte adhesion.
(a) Ex vivo perfusion assays showing monocytic cell arrest on the endothelia of the left carotid arteries of mice (n=4–5 mice per group) fed a HFD for 4 weeks. (b) Quantitative RT–PCR analyses of the mRNA expression levels of chemokines in carotid arteries of mice (n=3–4 mice per group) fed a HFD for 4 weeks. (c) Immunostaining of CXCL1 and the endothelial marker CD31 in carotid artery sections after 4 weeks of HFD feeding. Arrows indicate CXCL1 expressing ECs. Representative images of three independent experiments are shown. The nuclei were stained with 4',6-diamidino-2-phenylindole (DAPI). Scale bars, 30 μm (a), 12 μm (c). Asterisks indicate the lumen. The data are represented as the mean±s.e.m. of the indicated number (n) of repeats. *P<0.05 and **P<0.01 by Student's t-test.
Figure 3
Figure 3. Loss of endothelial Dicer limits atherosclerosis.
(a,b) Atherosclerotic lesion formation in mice fed a HFD for 12 weeks analysed in aortic root sections stained with elastic van Gieson stain (a; n=8 mice per group) and in en face prepared aortas stained with Oil red O stain (b; n=9–10 mice per group). (c,d) Macrophage and smooth muscle cell accumulation in aortic root lesions determined by immunostaining of MAC2 (c, green; n=7–9 mice per group) and smooth muscle actin (d, red; n=8 mice per group), respectively. The nuclei were counterstained with 4',6-diamidino-2-phenylindole (DAPI; blue). Scale bars, 500 μm (a), 50 μm (c,d) and 1 mm (b). Asterisks indicate the lumen. Dashed lines encircle atherosclerotic lesions. The data are represented as the mean±s.e.m. of the indicated number (n) of repeats. *P<0.05 and **P<0.01 by Student's t-test.
Figure 4
Figure 4. Expression of miR-103 in ECs during atherosclerosis.
(a,b) The expression levels of miR-103, miR-301b, miR-433 and miR-652 (a; n=5 per group) and their enrichment in AGO2-IPs of human ECs (b). The results of b are expressed as the fold enrichment of miRNAs in AGO2-IP samples compared with control IgG-IP samples. Results of one representative experiment are shown in b. (c) Quantitative RT–PCR analyses of the expression levels of miR-103, miR-301b, miR-433 and miR-652 in HAECs with and without TNF-α stimulation (n=3–4 per group). (d) MiRNA expression level in HAECs treated with vehicle or the NF-κB-inhibitor BAY11-7085 (n=4–5 per group). (e) Expression levels of miR-103 in HAECs treated with PBS, native low-density lipoprotein (nLDL) or mildly oxidized-low-density lipoprotein (moxLDL; n=4 per group). (f) Combined in situ PCR detection of miR-103 and immunostaining of the endothelial marker CD31 in carotid sections from EC-DicerWT and EC-Dicerflox mice fed a HFD for 4 weeks. Representative images of three independent experiments are shown. (g) Endothelial miR-103 expression in human atherosclerotic plaques determined by in situ PCR and immunostaining of von Willebrand factor (vWF). (h) Movat's pentachrome staining of a human atherosclerotic plaque section located adjacent to that used for the in situ detection of miR-103. The region of the plaque used for miR-103 expression analysis is indicated. Scale bars, 12 μm (f), 25 μm (g) and 500 μm (h). Asterisks indicate the lumen. The data are represented as the mean±s.e.m. of the indicated number (n) of repeats. *P<0.05, **P<0.01 and ***P<0.001 by Student's t-test and one-way analysis of variance.
Figure 5
Figure 5. Effects of miR-103 on chemokine expression in ECs and monocyte adhesion.
(a) Chemokine mRNA expression in HAECs treated with Dicer-specific LNA-GapmeRs or control LNA-GapmeRs with (right) or without (left) miR-103-mimic treatment (n=4–6 per group). (b,c) Quantitative RT–PCR analyses of miR-103 (b) and chemokine mRNA (c) expression levels in HAECs (n=5–6 per group) treated with LNA-inhibitors of miR-103 or non-targeting LNA-oligonucleotides. (d) ELISA of CXCL1 protein expression in HAEC lysates (n=3–4 per group) with and without miR-103 inhibition. (e) Flow chamber assays to determine monocyte adhesion to HAECs treated with LNA-inhibitors of miR-103 or control oligonucleotides (n=3 per group). (f,g) The expression of miR-103 (f) or chemokine mRNAs (g) in HAECs treated with miR-103-specific or negative control mimics (n=3–4 per group). (h) Adhesion of monocytes to HAECs treated with miR-103-mimics or control oligonucleotides under flow conditions. Monocytic cells were pretreated with or without an antibody to block CXCR2 or non-targeting control IgG (n=3 per group). The data are represented as the mean±s.e.m. of the indicated number (n) of repeats. *P<0.05, **P<0.01 and ***P<0.001 by Student's t-test (bd) and one-way analysis of variance (a,e).
Figure 6
Figure 6. Effect of endothelial Dicer deletion on arterial gene expression.
(a) Heat map of genes differentially expressed in the aortas of EC-Dicerflox mice compared with EC-DicerWT mice (n=2 mice per group; P<0.05; fold change cutoff=1.2) after 12 weeks HFD feeding. (b) Quantitative RT–PCR analyses of the c-Myb, Tcf7, Lef1, Dkk2 and Sox17 expression levels in the aortas of EC-DicerWT and EC-Dicerflox mice after 12 weeks HFD feeding (n=4–7 mice per group). (c,d) Significant enriched biological processes (c) and signalling pathways (d) among the genes differentially regulated in EC-Dicerflox mice as compared with EC-DicerWT mice using Ingenuity Pathway Analysis software. (e) Quantitative RT–PCR analyses of Klf4 mRNA expression in the aortas of EC-DicerWT and EC-Dicerflox mice after 12 weeks of HFD feeding (n=4 mice per group). (f) KLF4+ ECs in aortic root sections of EC-DicerWT and EC-Dicerflox mice identified by immunostaining of KLF4 and the endothelial marker CD31. The arrows indicate ECs with nuclear KLF4 staining. The nuclei were counterstained with 4',6-diamidino-2-phenylindole (DAPI). Representative images are shown (n=3–4 mice per group). Scale bar, 25 μm. The data are represented as the mean±s.e.m. of the indicated number (n) of repeats. *P<0.05; **P<0.01 by Student's t-test.
Figure 7
Figure 7. miR-103 promotes inflammatory activation of ECs by targeting KLF4.
(a,b) Enrichment of Klf4 and c-Myb transcripts in the miRNA-induced silencing complex (RISC) of mouse aortic ECs (a) and human aortic ECs (HAECs, b) treated with miR-103-mimics as determined by GW182-IP. The results are expressed as the fold enrichment of the mRNAs in GW182-IP samples compared with the input samples. Results of two independent experiments are shown. ND indicates not detected. (c) Immunoblot analyses of KLF4 protein expression in HAECs treated with LNA-inhibitors of miR-103, non-targeting control LNA-oligonucleotides or premade KLF4 mRNA (n=3–4 per group). The KLF4 protein levels were normalized to those of GAPDH. Full scans of western blots are provided in Supplementary Fig. 14. (d) KLF4 mRNA levels in HAECs treated with LNA-inhibitors of miR-103 or control LNA-oligonucleotides (n=4–5 per group). (e) MiR-103 expression after silencing KLF4 using siRNA (siKLF4) in HAECs. A non-targeting siRNA (siNTC) was used in the control group (n=4–5 per group). (f) The expression of CXCL1, CX3CL1 and CCL2 after silencing KLF4 (siKLF4) in HAECs treated with (right) or without (left) LNA-inhibitors of miR-103 (n=4–5 per group). siNTCs were used in the control group. (g,h) The effect of transfection with GFP mRNAs (Ctrl) or premade KLF4 mRNAs on miR-103 (g) and chemokine expression (h) in HAECs treated with (h, right) or without (g; h, left) miR-103-mimics (n=3–5 per group). (i) Expression of CXCL1, CX3CL1 and CCL2 in HAECs treated with LNA-oligonucleotides (KLF4-target site blockers; KLF4-TSBs) designed to inhibit the interaction between miR-103 and the 3′UTR of KLF4 (n=6 per group). Non-targeting LNA-oligonucleotides were used in the control group. (j) Flow chamber assays to determine monocyte adhesion to HAECs treated with KLF4-TSBs or non-targeting oligonucleotides (n=4 per group). The data are represented as the mean±s.e.m. of the indicated number (n) of repeats. *P<0.05, ** P<0.01 and *** P<0.001 by Student's t-test (a,b,dj) and one-way analysis of variance (c).
Figure 8
Figure 8. Inhibition of the interaction between miR-103 and KLF4 limits atherosclerosis.
(a) Immunostaining of KLF4 and von Willebrand factor (vWF) in aortic root sections of Apoe−/− mice treated with KLF4-TSBs or non-targeting LNA-oligonucleotides (control). Representative images are shown. Atherosclerosis (b) quantified in Oil red O-stained, en face prepared aortas and the lesional macrophage cell number (c) determined by MAC2 immunostaining in aortic root lesions from Apoe−/− mice treated with KLF4-TSBs or control oligonucleotides (n=4–6 mice per group). (d) Dual immunostaining of CXCL1 and vWF in aortic root sections of Apoe−/− mice treated with KLF4-TSBs or control oligonucleotides. (e) The expression levels of Cxcl1 in the carotid, liver, spleen and heart of KLF4-TSB-treated Apoe−/− mice compared with control mice (n=4–7 mice per group). (f) Dual immunostaining of eNOS and vWF in aortic root sections of Apoe−/− mice treated with KLF4-TSBs or control oligonucleotides. (g) Nos3 mRNA expression in the carotid arteries of KLF4-TSB-treated Apoe−/− mice compared with control mice (n=5–6 mice per group). The nuclei were counterstained with 4',6-diamidino-2-phenylindole (DAPI). Asterisks indicate the lumen. Representative images of three independent experiments are shown. Scale bars, 10 μm (f), 25 μm (a,d), 50 μm (c) and 1 mm (b). The data are represented as the mean±s.e.m. of the indicated number (n) of repeats. *P<0.05 and **P<0.01 by Student's t-test.

Similar articles

Cited by

References

    1. Aird W. C. Phenotypic heterogeneity of the endothelium: I. Structure, function, and mechanisms. Circ. Res. 100, 158–173 (2007). - PubMed
    1. Hamik A. et al.. Kruppel-like factor 4 regulates endothelial inflammation. J. Biol. Chem. 282, 13769–13779 (2007). - PubMed
    1. Parmar K. M. et al.. Integration of flow-dependent endothelial phenotypes by Kruppel-like factor 2. J. Clin. Invest. 116, 49–58 (2006). - PMC - PubMed
    1. Jain M. K., Sangwung P. & Hamik A. Regulation of an inflammatory disease: Kruppel-like factors and atherosclerosis. Arterioscler. Thromb. Vasc. Biol. 34, 499–508 (2014). - PMC - PubMed
    1. Kwak B. R. et al.. Biomechanical factors in atherosclerosis: mechanisms and clinical implicationsdagger. Eur. Heart J. (2014). - PMC - PubMed

Publication types

MeSH terms