. 2016 Feb 3:6:20030.
doi: 10.1038/srep20030.

Multi-Organ toxicity demonstration in a functional human in vitro system composed of four organs

Affiliations

Multi-Organ toxicity demonstration in a functional human in vitro system composed of four organs

Carlota Oleaga et al. Sci Rep. .

Abstract

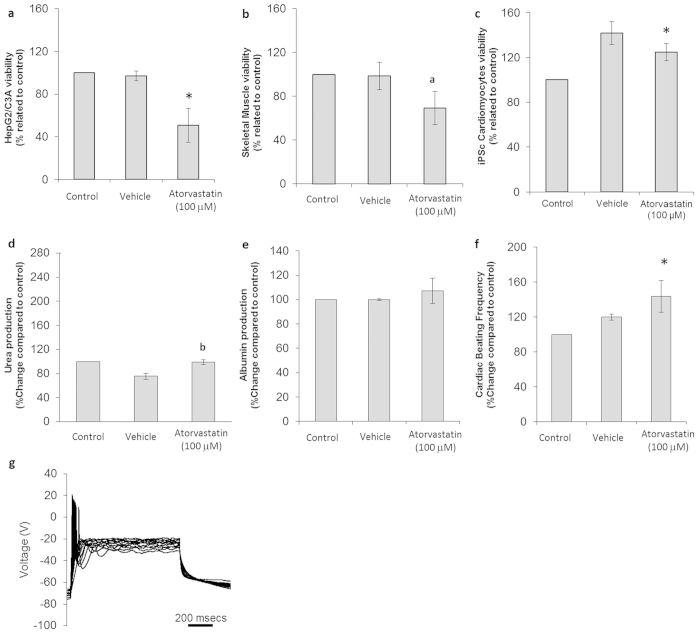
We report on a functional human model to evaluate multi-organ toxicity in a 4-organ system under continuous flow conditions in a serum-free defined medium utilizing a pumpless platform for 14 days. Computer simulations of the platform established flow rates and resultant shear stress within accepted ranges. Viability of the system was demonstrated for 14 days as well as functional activity of cardiac, muscle, neuronal and liver modules. The pharmacological relevance of the integrated modules were evaluated for their response at 7 days to 5 drugs with known side effects after a 48 hour drug treatment regime. The results of all drug treatments were in general agreement with published toxicity results from human and animal data. The presented phenotypic culture model exhibits a multi-organ toxicity response, representing the next generation of in vitro systems, and constitutes a step towards an in vitro "human-on-a-chip" assay for systemic toxicity screening.


Conflict of interest statement

JJH and MLS have potential competing financial interests, in that a company has been formed to market services for the type of device described herein in which they have a financial interest.

Figures

Figure 1
Figure 1
(a) Schematic view of the microfluidic platform showing the different cell compartments. The system contained two holders for the separate culture devices. Total fluid volume was approximately 4 mL between the chambers and reservoirs. The size of the culture compartments were 35.8 × 18.4 × 0.3 mm for Chambers 1, 2, 3 and 29.8 × 15.4 × 0.7 mm for Chambers 4, 5. The connecting channel dimensions were 5.7 × 1 × 0.3 mm. (b) Shear stress distribution in each compartment of the system.
Figure 2
Figure 2. Functional data recorded for the different cell types after 14 days in the system under flow.
(a) Albumin (top) and urea (bottom) production by HepG2/C3A cells. Data is presented as mean ± standard error of the mean. (b) Top: spontaneous contractile activity of cardiomyocytes on microscale silicon cantilevers after 14 DIV. Bottom: controlled contractions of cardiomyocytes on microscale silicon cantilevers after 14 DIV in response to broad field electrical stimulation (2 Hz). (c) Skeletal muscle contractility was assessed by video analysis (Supplementary materials). (d) Electrophysiological action potentials in motoneurons. Inset: image of patched cell.
Figure 3
Figure 3
Bright field microscopy images (10×) of (a) HepG2/C3A, (b) iPSC derived human cardiomyocytes, (c) skeletal muscle cells and (d) neurons after 7 days in co-culture in the microfluidic system, in serum free medium and under flow conditions. Immunocytochemical staining of (e) hepatocytes stained for albumin (red) and DAPI (blue), (f) iPSC derived cardiomyocytes stained for troponin (green) and actin (red), (g) skeletal muscle stained for myosin heavy chain (green) and actin (red) and (h) neurons stained for neurofilament (green) and actin (red) after 7 days in co-culture in the system. (scale bars a–g = 100 μm; h = 50 μm).
Figure 4
Figure 4. Cytotoxic effects on cells following treatment with doxorubicin.
(a) HepG2/C3A viability assay results. (b) Cardiomyocyte viability assay results. (c) Comparison of drug-treated and untreated cardiomyocyte beating frequency. (d) Urea production in controls and drug-treated hepatocytes. (e) Albumin production in control and drug-treated hepatocytes. (f) Representative electrophysiology recording of a drug-treated neuron. All presented data is displayed as mean ± standard error of the mean. (*p < 0.05/ ***p < 0.001 compared to control).
Figure 5
Figure 5. Cytotoxic effects on cells following treatment with atorvastatin.
(a) HepG2/C3A viability assay results. (b) Skeletal muscle viability assay results. (c) Cardiomyocyte viability assay results. (d) Urea production in controls and drug-treated hepatocytes. (e) Albumin production in control and drug-treated hepatocytes. (f) Comparison of drug-treated and untreated cardiomyocyte beating frequency. (g) Representative electrophysiological recording of a drug-treated neuron. All presented data is displayed as mean ± standard error of the mean. (b p ≤ 0.1/a p ≤ 0.08/*p ≤ 0.05 compared to control).
Figure 6
Figure 6. Cytotoxic effects on cells following treatment with valproic acid.
(a) HepG2/C3A viability assay results. (b) Cardiomyocytes viability assay results. (c) Skeletal muscle viability assay results. (d) Urea production in controls and drug-treated hepatocytes. (e) Albumin production in control and drug-treated hepatocytes. (f) Comparison of drug-treated and untreated cardiomyocyte beating frequency. (g) Representative electrophysiological recording of a drug-treated neuron. All presented data is displayed as mean ± standard error of the mean. (a p < 0.08/*p < 0.05 compared to control).
Figure 7
Figure 7. Cytotoxic effects on cells following treatment with acetaminophen.
(a) HEPG2/C3A viability assay results. (b) Cardiomyocyte viability assay results. (c) Skeletal muscle viability assay results. (d) Urea production in controls and drug-treated hepatocytes (e) Albumin production in control and drug-treated hepatocytes. (f) Comparison of drug-treated and untreated cardiomyocyte beating frequency. (g) Representative electrophysiological recording of a drug-treated neuron. All presented data is displayed as mean ± standard error of the mean. (b p < 0.1/*p < 0.05 compared to control).
Figure 8
Figure 8. Cytotoxic effects on cells following treatment with N-Acetyl-m-aminophenol.
(a) HEPG2/C3A viability assay results. (b) Cardiomyocyte viability assay results. (c) Neuronal viability assay results. (d) Urea production in controls and drug-treated hepatocytes. (e) Albumin production in control and drug-treated hepatocytes. (f) Comparison of drug-treated and untreated cardiomyocyte beating frequency. (g) Representative electrophysiological recording of a drug-treated neuron. All presented data is displayed as mean ± standard error of the mean. (*p < 0.05 **p < 0.01 compared to control).

Similar articles

Cited by

References

    1. Wysowski D. K. & Swartz L. Adverse drug event surveillance and drug withdrawals in the united states, 1969–2002: The importance of reporting suspected reactions. Arch. Intern. Med. 165, 1363–1369 (2005). - PubMed
    1. Hay M., Thomas D. W., Craighead J. L., Economides C. & Rosenthal J. Clinical development success rates for investigational drugs. Nat Biotech. 32, 40–51 (2014). - PubMed
    1. Esch M. B. et al.. How multi-organ microdevices can help foster drug development. Adv. Drug Deliv. Rev. 69–70, 158–169 (2014). - PMC - PubMed
    1. Huh D., Torisawa Y. S., Hamilton G. A., Kim H. J. & Ingber D. E. Microengineered physiological biomimicry: organs-on-chips. Lab Chip 12, 2156–2164 (2012). - PubMed
    1. Sung J. H. et al.. Microfabricated mammalian organ systems and their integration into models of whole animals and humans. Lab Chip 13, 1201–1212 (2013). - PMC - PubMed

Publication types

Substances