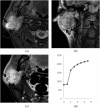
Basal cell adenoma of the parotid gland; MR features and differentiation from pleomorphic adenoma
- PMID: 26837669
- PMCID: PMC4846172
- DOI: 10.1259/dmfr.20150322
Basal cell adenoma of the parotid gland; MR features and differentiation from pleomorphic adenoma
Abstract
Objectives: Among the benign tumours of the parotid gland, basal cell adenoma (BCA) is far less common than pleomorphic adenoma (PA). MR features of BCA, including diffusion-weighted imaging and dynamic contrast-enhanced study, have not been previously described. Assessment of the crucial MR features of BCA appears to offer beneficial clues for distinguishing BCA from PA.
Methods: We retrospectively reviewed 14 BCAs and 179 PAs in the parotid gland, collected between March 2000 and May 2012, from the MRI database.
Results: Nearly half of the BCAs had cystic components. The average ratio of the maximum diameter of the cysts to the BCAs (cystic ratio) was 0.80 ± 0.11 [standard deviation (SD)]. The BCA cystic ratio was significantly higher (p = 0.00232) than that of PAs. The cystic ratio threshold was 0.65 between cystic BCA and cystic PA. Sensitivity and specificity were 76.5% and 100%, respectively. The average of the apparent diffusion coefficient (ADC) values of the 12 BCAs [1.24 ± 0.18 (SD) ×10(-3) mm(2) s(-1)] was significantly lower than that of the 151 PAs [1.86 ± 0.40 (SD) ×10(-3) mm(2) s(-1)] (p < 0.001) and also lower than that of the cystic PAs [1.83 ± 0.57 (SD) ×10(-3) mm(2) s(-1)] (p < 0.00495). The ADC threshold was 1.31 × 10(-3) mm(2) s(-1) between BCA and cystic PA, with sensitivity and specificity of 81.2% and 91.7%, respectively, and also the same threshold 1.31 × 10(-3) mm(2) s(-1) between BCA and PA, with sensitivity and specificity of 92.7% and 91.7%, respectively. Time-signal intensity curves (TICs) showed various patterns.
Conclusions: A small cystic mass with well-circumscribed borders and slightly lower ADC value may suggest BCA, although TICs showed various patterns.
Figures


Similar articles
-
Parotid gland tumors: can addition of diffusion-weighted MR imaging to dynamic contrast-enhanced MR imaging improve diagnostic accuracy in characterization?Radiology. 2008 Dec;249(3):909-16. doi: 10.1148/radiol.2493072045. Epub 2008 Oct 21. Radiology. 2008. PMID: 18941162
-
Evaluation of MR imaging findings differentiating parotid basal cell adenomas from other parotid tumors.Eur J Radiol. 2021 Nov;144:109980. doi: 10.1016/j.ejrad.2021.109980. Epub 2021 Sep 27. Eur J Radiol. 2021. PMID: 34601323
-
The value of dynamic MRI studies in parotid tumors.Acad Radiol. 2007 Jun;14(6):701-10. doi: 10.1016/j.acra.2007.03.004. Acad Radiol. 2007. PMID: 17502260 Clinical Trial.
-
Basal Cell Adenoma of the Parotid Gland.Kathmandu Univ Med J (KUMJ). 2020 Oct.-Dec.;18(72):434-436. Kathmandu Univ Med J (KUMJ). 2020. PMID: 34165108 Review.
-
Pitfalls of fine-needle aspiration cytology of parotid membranous basal cell adenoma-A review of pitfalls in FNA cytology of salivary gland neoplasms with basaloid cell features.Diagn Cytopathol. 2015 May;43(5):432-7. doi: 10.1002/dc.23234. Epub 2014 Nov 27. Diagn Cytopathol. 2015. PMID: 25431027 Review.
Cited by
-
The value of diffusion kurtosis imaging and dynamic contrast-enhanced magnetic resonance imaging in the differential diagnosis of parotid gland tumors.Gland Surg. 2024 Jul 30;13(7):1254-1268. doi: 10.21037/gs-24-78. Epub 2024 Jul 24. Gland Surg. 2024. PMID: 39175702 Free PMC article.
-
Comparison of Different Machine Models Based on Multi-Phase Computed Tomography Radiomic Analysis to Differentiate Parotid Basal Cell Adenoma From Pleomorphic Adenoma.Front Oncol. 2022 Jul 12;12:889833. doi: 10.3389/fonc.2022.889833. eCollection 2022. Front Oncol. 2022. PMID: 35903689 Free PMC article.
-
Spontaneously infarcted parotid tumours: MRI findings.Dentomaxillofac Radiol. 2019 Jul;48(5):20180382. doi: 10.1259/dmfr.20180382. Epub 2019 Feb 12. Dentomaxillofac Radiol. 2019. PMID: 30706736 Free PMC article.
-
Histogram analysis of apparent diffusion coefficient maps for differentiating malignant from benign parotid gland tumors.Eur Arch Otorhinolaryngol. 2018 Aug;275(8):2151-2157. doi: 10.1007/s00405-018-5052-y. Epub 2018 Jul 2. Eur Arch Otorhinolaryngol. 2018. PMID: 29961924
-
The histogram analysis of apparent diffusion coefficient in differential diagnosis of parotid tumor.Dentomaxillofac Radiol. 2020 Jul;49(5):20190420. doi: 10.1259/dmfr.20190420. Epub 2020 Mar 9. Dentomaxillofac Radiol. 2020. PMID: 32134344 Free PMC article.
References
-
- Takahashi H, Fujita S, Okabe H, Tsuda N, Tezuka F. Immunohistochemical characterization of basal cell adenomas of the salivary gland. Pathol Res Pract 1991; 187: 145–56. doi: http://dx.doi.org/10.1016/S0344-0338(11)80764-8 - DOI - PubMed
-
- Nagao K, Matsuzaki O, Saiga H, Sugano I, Shigematsu H, Kaneko T, et al. . Histopathologic studies of basal cell adenoma of the parotid gland. Cancer 1982; 50: 736–45. doi: http://dx.doi.org/10.1002/1097-0142(19820815)50:4<736::AID-CNCR282050041... - DOI - PubMed
-
- Kawahara A, Harada H, Akiba J, Yokoyama T, Kage M. Fine-needle aspiration cytology of basal cell adenoma of the parotid gland: characteristic cytological features and diagnostic pitfalls. Diagn Cytopathol 2007; 35: 85–90. doi: http://dx.doi.org/10.1002/dc.20598 - DOI - PubMed
-
- De Araujo VC. Basal cell adenoma. In: Barnes L, Everson JW, Reichart P, Sidransky D, eds. World Health Organization classification of tumours: pathology and genetics of the head and neck tumours. Lyon: IARC press; 2005. pp. 261–2.
-
- Eveson JW, Kusafuka K, Stenman G, Nagao T. Pleomorphic adenoma. In: Barnes L, Everson JW, Reichart P, Sidransky D, eds. World Health Organization classification of tumours: pathology and genetics of the head and neck tumours. IARC press; 2005. pp. 254–8.
MeSH terms
Substances
LinkOut - more resources
Full Text Sources
Other Literature Sources
Medical

