. 2016 Apr 28;127(17):2122-30.
doi: 10.1182/blood-2015-07-659144. Epub 2016 Feb 2.

Clinical impact of clonal and subclonal TP53, SF3B1, BIRC3, NOTCH1, and ATM mutations in chronic lymphocytic leukemia

Affiliations

Clinical impact of clonal and subclonal TP53, SF3B1, BIRC3, NOTCH1, and ATM mutations in chronic lymphocytic leukemia

Ferran Nadeu et al. Blood. .

Abstract

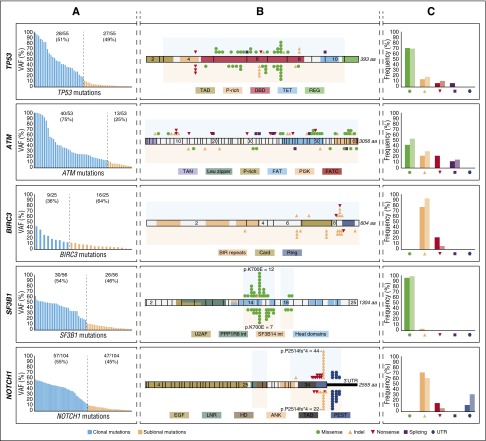
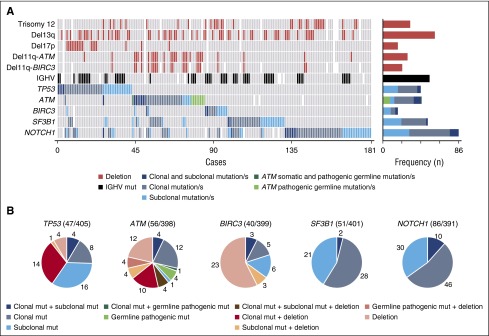
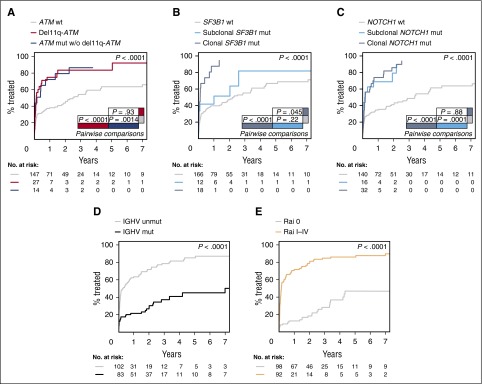
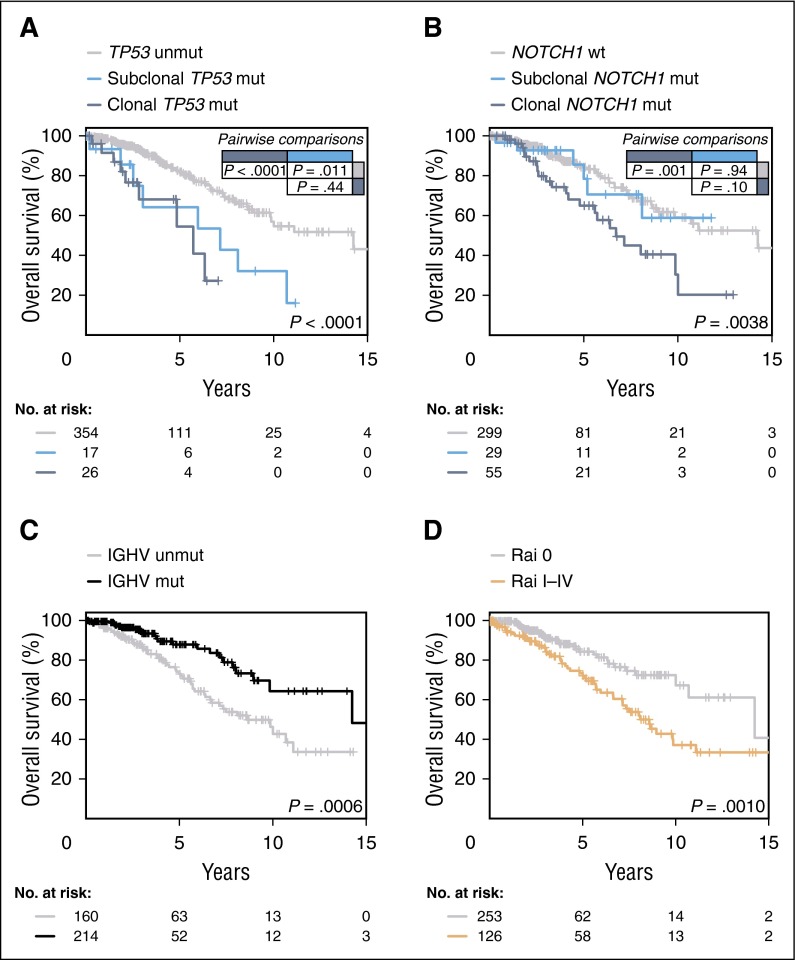
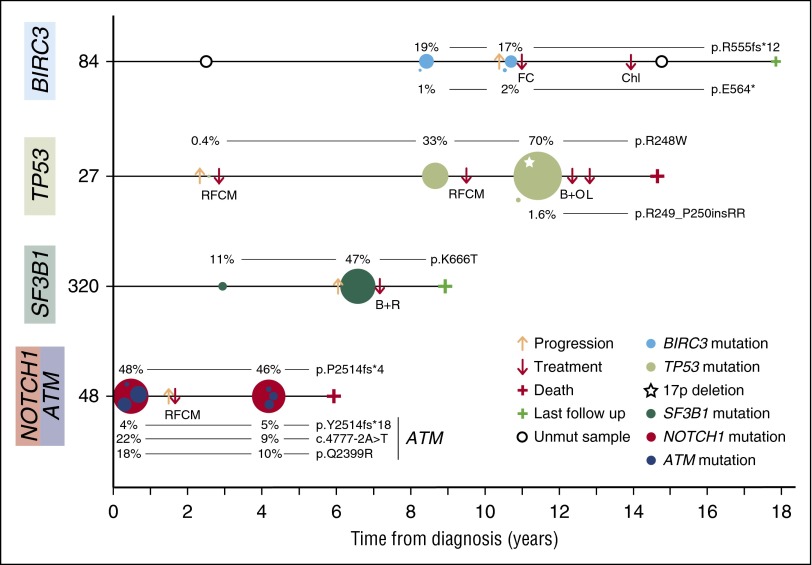
Genomic studies have revealed the complex clonal heterogeneity of chronic lymphocytic leukemia (CLL). The acquisition and selection of genomic aberrations may be critical to understanding the progression of this disease. In this study, we have extensively characterized the mutational status of TP53, SF3B1, BIRC3, NOTCH1, and ATM in 406 untreated CLL cases by ultra-deep next-generation sequencing, which detected subclonal mutations down to 0.3% allele frequency. Clonal dynamics were examined in longitudinal samples of 48 CLL patients. We identified a high proportion of subclonal mutations, isolated or associated with clonal aberrations. TP53 mutations were present in 10.6% of patients (6.4% clonal, 4.2% subclonal), ATM mutations in 11.1% (7.8% clonal, 1.3% subclonal, 2% germ line mutations considered pathogenic), SF3B1 mutations in 12.6% (7.4% clonal, 5.2% subclonal), NOTCH1 mutations in 21.8% (14.2% clonal, 7.6% subclonal), and BIRC3 mutations in 4.2% (2% clonal, 2.2% subclonal). ATM mutations, clonal SF3B1, and both clonal and subclonal NOTCH1 mutations predicted for shorter time to first treatment irrespective of the immunoglobulin heavy-chain variable-region gene (IGHV) mutational status. Clonal and subclonal TP53 and clonal NOTCH1 mutations predicted for shorter overall survival together with the IGHV mutational status. Clonal evolution in longitudinal samples mainly occurred in cases with mutations in the initial samples and was observed not only after chemotherapy but also in untreated patients. These findings suggest that the characterization of the subclonal architecture and its dynamics in the evolution of the disease may be relevant for the management of CLL patients.


Figures

Figure 1
Figure 1
Molecular profile and schematic diagram of clonal and subclonal TP53, ATM, BIRC3, SF3B1, and NOTCH1 mutations. (A) VAF of the mutations identified by NGS in each of the studied genes. Blue bars correspond to clonal mutations (VAF ≥12%) whereas orange bars to the subclonal mutations (VAF <12%). (B) Schematic diagram of TP53, ATM, BIRC3, SF3B1, and NOTCH1. Exons are represented by boxes and the main protein domains are colored. Color-coded shapes indicate the position and type of the mutation. Variants represented on the top of the protein correspond to high-frequency mutations (clonal) whereas variants represented under the diagram correspond to low-frequency mutations (subclonal). Shaded area corresponds to the region sequenced. (C) Comparison of the molecular profile of the identified clonal and subclonal mutations. Each pair of bars represent clonal (dark) and subclonal (light) mutations. No statistical differences were observed by the Fisher exact test.
Figure 2
Figure 2
Graphical representation of gene aberrations observed in the entire cohort. (A) CNA, IGHV status, and mutational status of the studied genes are represented. Each column represents an untreated CLL case carrying at least 1 mutation in any of the studied genes. Bar plot on the right represents the number of times at which each CNA and IGHV status was observed in all mutated cases. Blue bar plots refers to the number of cases carrying isolated subclonal mutations, only clonal mutations, or both regarding the mutational status of the studied genes. Cases carrying ATM definitely/likely pathogenic germ line variants are also shown. (B) Incidence of TP53, ATM, BIRC3, SF3B1, and NOTCH1 alterations classified regarding its clonal representation in the study cohort. Del, deletion; mut, mutation/s.
Figure 3
Figure 3
TTT according to gene aberrations. (A) Comparison of TTT among patients carrying ATM mutations without 11q deletion (blue line), 11q deletion (red line), and cases carrying a WT ATM gene (gray line) (P = .0014 for ATM mutations vs WT; P < .0001 for 11q deletion vs WT; P = .93 for ATM mutations vs 11q deletion). (B) Comparison of TTT among cases carrying isolated subclonal SF3B1 mutations (light blue line), clonal SF3B1 mutations (dark blue line), and cases carrying a WT SF3B1 gene (gray line) (P < .0001 for clonal mutations vs WT; P=.22 for subclonal mutations vs WT; P = .045 for clonal vs subclonal mutations). (C) Comparison of TTT among patients carrying subclonal NOTCH1 mutations (light blue line), clonal NOTCH1 mutations (dark blue line), or WT NOTCH1 gene sequence (gray line) (P < .0001 for clonal mutations vs WT; P=.0001 for subclonal mutations vs WT; P = .88 for clonal vs subclonal mutations). (D) Comparison of TTT among patients carrying the mutated (black line) or unmutated IGHV gene sequence (gray line) (P < .0001). (E) Comparison of TTT among patients diagnosed with Rai I-IV (orange line) or Rai 0 disease (gray line) (P < .0001). P, P values by Gray test.
Figure 4
Figure 4
OS according to gene aberrations. (A) Comparison of OS among patients carrying subclonal TP53 mutations (light blue line), clonal TP53 mutations (dark blue line), and cases harboring an unmutated TP53 gene (gray line) (P < .0001 for clonal mutations vs WT; P = .011 for subclonal mutations vs WT; P = .44 for clonal vs subclonal mutations). (B) Comparison of OS from date of sampling between CLL patients carrying subclonal NOTCH1 mutations, clonal NOTCH1 mutations, and WT NOTCH1 gene (light blue, dark blue, and gray lines, respectively) (P = .001 for clonal mutations vs WT; P = .94 for subclonal mutations vs WT; P = .10 for clonal vs subclonal mutations). (C) Comparison of OS among patients carrying mutated (black line), and unmutated IGHV genes (gray line) (P = .0006). (D) Comparison of OS among patients diagnosed with Rai I-IV (orange line), or Rai 0 disease (gray line) (P = .001). P, P values by log-rank test.
Figure 5
Figure 5
Representative examples of clonal evolution observed in a 48-sample longitudinal analysis. Illustration of 4 representative CLL cases of clonal evolution showing the decrease or expansion of the BIRC3-, TP53-, SF3B1-, ATM-, or NOTCH1-mutated clone. Time 0 corresponds to the diagnosis time point. Each circle represents a unique mutation and its size is proportional to the VAF of the mutation corrected by the sample’s tumor purity. Each mutation is represented at the time point at which a tumor sample was collected. B+O, bendamustine, ofatumumab; B+R, bendamustine, rituximab; Chl, chlorambucil; FC, fludarabine, cyclophosphamide; L, lenalidomide; RFCM, rituximab, fludarabine, cyclophosphamide, mitoxantrone.

Comment in

  • Not all subclones matter in CLL.
    Sutton LA, Rosenquist R. Sutton LA, et al. Blood. 2016 Apr 28;127(17):2052-4. doi: 10.1182/blood-2016-02-699041. Blood. 2016. PMID: 27127300 No abstract available.

Similar articles

Cited by

References

    1. Zenz T, Mertens D, Küppers R, Döhner H, Stilgenbauer S. From pathogenesis to treatment of chronic lymphocytic leukaemia. Nat Rev Cancer. 2010;10(1):37–50. - PubMed
    1. Hallek M. Chronic lymphocytic leukemia: 2013 update on diagnosis, risk stratification and treatment. Am J Hematol. 2013;88(9):803–816. - PubMed
    1. Guièze R, Wu CJ. Genomic and epigenomic heterogeneity in chronic lymphocytic leukemia. Blood. 2015;126(4):445–453. - PMC - PubMed
    1. Sutton L-A, Rosenquist R. Deciphering the molecular landscape in chronic lymphocytic leukemia: time frame of disease evolution. Haematologica. 2015;100(1):7–16. - PMC - PubMed
    1. Villamor N, López-Guillermo A, López-Otín C, Campo E. Next-generation sequencing in chronic lymphocytic leukemia. Semin Hematol. 2013;50(4):286–295. - PubMed

Publication types

MeSH terms