. 2016 Feb 3:7:10607.
doi: 10.1038/ncomms10607.

Dynamic DNA binding licenses a repair factor to bypass roadblocks in search of DNA lesions

Affiliations

Dynamic DNA binding licenses a repair factor to bypass roadblocks in search of DNA lesions

Maxwell W Brown et al. Nat Commun. .

Abstract

DNA-binding proteins search for specific targets via facilitated diffusion along a crowded genome. However, little is known about how crowded DNA modulates facilitated diffusion and target recognition. Here we use DNA curtains and single-molecule fluorescence imaging to investigate how Msh2-Msh3, a eukaryotic mismatch repair complex, navigates on crowded DNA. Msh2-Msh3 hops over nucleosomes and other protein roadblocks, but maintains sufficient contact with DNA to recognize a single lesion. In contrast, Msh2-Msh6 slides without hopping and is largely blocked by protein roadblocks. Remarkably, the Msh3-specific mispair-binding domain (MBD) licences a chimeric Msh2-Msh6(3MBD) to bypass nucleosomes. Our studies contrast how Msh2-Msh3 and Msh2-Msh6 navigate on a crowded genome and suggest how Msh2-Msh3 locates DNA lesions outside of replication-coupled repair. These results also provide insights into how DNA repair factors search for DNA lesions in the context of chromatin.


Figures
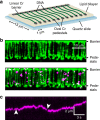
Figure 1
Figure 1. Visualizing protein diffusion on aligned arrays of DNA molecules.
(a) An illustration of the DNA curtains assay (Supplementary Information). A quartz microscope slide is fabricated with an alternating pattern of linear chromium (Cr) diffusion barriers and oval pedestals (∼30 nm tall; 13 μm separation). The pedestals are coated with anti-digoxigenin antibodies. The flowcell surface is passivated with a fluid lipid bilayer (∼5 nm tall), and DNA (from λ-phage, 48,502 bp) is affixed to the bilayer via a biotin-streptavidin linkage. Buffer flow is used to organize DNA molecules at the linear diffusion barriers and the free DNA end is immobilized at the Cr pedestals via a digoxigenin–antibody interaction. DNA molecules that are tethered at both ends remain extended when buffer flow is turned off. (b) A double-tethered DNA curtain. DNA is stained with YOYO-1, a fluorescent intercalating dye (green; top). Quantum dot (QD)-conjugated Msh2–Msh3 binds specifically to the DNA molecules (magenta; bottom). We did not observe any QD signal when Msh2–Msh3 was omitted from the incubation, or when Msh2–Msh3 was incubated with an unconjugated QD. YOYO-1 was omitted from subsequent experiments because it can cause laser-induced DNA damage. Scale bar: 10 μm. (c) Kymograph of a single diffusing Msh2–Msh3 protein. QDs blinking (white arrows) indicates that these traces arise from single fluorescent particles.
Figure 2
Figure 2. Msh2–Msh3 scans DNA via one-dimensional (1D) sliding.
(a) Representative traces of diffusing Msh2–Msh3 molecules with 1 mM of the indicated nucleotide and 50 mM NaCl in the imaging buffer (black: ADP; blue: ATP; orange: ATP–Mg+2; green: AMP–PNP; pink: no nucleotide). (b) The trajectories in a were used to calculate mean squared displacements (MSD) and the MSDs for each molecule were used to obtain an apparent 1D diffusion coefficient (black: ADP; blue: ATP; orange: ATP-Mg+2; green: AMP-PNP; pink: no nucleotide). Solid lines indicate linear fits through the MSD points. (c) Diffusion coefficients for at least 50 molecules in each nucleotide state (with 50 mM NaCl). Red diamonds indicate the mean of the distribution. *P value <0.05 and ***P value <0.001. There is a statistically significant twofold increase in the mean diffusion confidents with non-hydrolyzable nucleotides (P values: 2.5 × 10⁻², 1.4 × 10⁻⁴, and 1.2 × 10⁻² for ATP–Mg+2, AMP–PNP, and no nucleotide, respectively). Dashed line: theoretical limit for sliding with rotation along the DNA backbone. Supplementary Table 1 summarizes the means, s.d., and additional P values for each nucleotide condition. (d) Msh2–Msh3 diffusion coefficients increase with higher ionic strength. Error bars represent the s.e.m. A linear fit to the log–log plot has a slope of 1.3±0.2, suggesting ∼1.5 charge–charge interactions between Msh2–Msh3 and DNA are disrupted at increasing ionic strengths. Dashed line: theoretical limit for sliding with rotation along the DNA backbone. Each data point represents the mean of at least 47 diffusing particles, and all results are summarized in Supplementary Table 2.
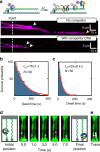
Figure 3
Figure 3. Msh2–Msh3 transiently dissociates from DNA during 1D sliding.
(a) Cartoon illustration (top) and a kymograph (bottom) of Msh2–Msh3 dissociating from a single-tethered DNA molecule. In the absence of competitor DNA (mock injection), Msh2–Msh3 slides along the DNA and dissociates from both internal sites (white arrow) and from free DNA ends (yellow arrow). Msh2–Msh3 dissociates from DNA curtains more rapidly after competitor DNA is injected in the flowcell (dashed line). Quantification of the Msh2–Msh3 lifetimes (b) without or (c) with competitor DNA. Lifetimes are fit to a single exponential decay and the half-lives±s.e. are reported in the panels. (d) Msh2–Msh3 (magenta) can transfer between adjacent DNA molecules. Initially, Msh2–Msh3 diffuses on the left DNA molecule. After 3 s, the complex transfers to an adjacent DNA. After the diffusion data was acquired, the DNA molecules were stained with YOYO-1 (green). Scale bar, 2 μm (e) A trace of the complete trajectory (white) is superimposed on the locations of the two DNA molecules. The starting and ending points are indicated by yellow and red triangles, respectively.
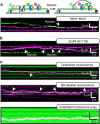
Figure 4
Figure 4. Diffusing Msh2–Msh3 bypasses protein roadblocks.
(a) Cartoon illustration (top) and kymograph (bottom) of green and magenta Msh2–Msh3 complexes bypassing each other on the same DNA molecule. The bypass events are indicated with white arrowheads. (b) Kymograph of Msh2–Msh3 (magenta) bypassing EcoRI(E111Q) (green). (c) Kymographs of Msh2–Msh3 bypassing unlabelled nucleosomes (top, green) and QD-labeled nucleosomes (middle, green). Msh2–Msh3 also diffuses on dense nucleosome arrays (bottom, green). These arrays appear completely green due to the large quantity of post-labelled nucleosomes. Msh2–Msh3 (magenta) appears as white when co-localized with nucleosomes.
Figure 5
Figure 5. Characterizing the sliding of a chimeric Msh2–Msh6(3MBD).
(a) Top: hMSH2–MSH6 structure (PDB: 2O8B). Msh2, Msh6 and DNA are shown in blue, grey and green, respectively. The Msh6–MBD is coloured in orange and makes multiple contacts with the DNA. Below: domain map of yeast Msh2–Msh6(3MBD) chimera. (b) Msh2–Msh6(3MBD) diffusion coefficients as a function of total ionic strength (n⩾50 for each condition). Red diamonds indicate the mean diffusion coefficients. Asterisks indicate ***P value <0.001. Diffusion coefficients increase at higher ionic strengths (see Supplementary Table 3 for P values). (c) Summary of the relative diffusion coefficients for Msh2–Msh6 (grey, from ref. 27), Msh2–Msh3 (orange, this study) and Msh2–Msh6(3MBD) (blue, this study). Diffusion coefficients for each protein are normalized to their respective values at the lowest ionic strength. Error bars are the s.e.m. (d) Kymographs of Msh2–Msh6(3MBD) (magenta) bypassing unlabelled (top, green) and QD-labelled (bottom, green) nucleosomes. (e) Quantification of the nucleosome bypass frequencies for each of the three heterodimers (unlabelled nucleosomes: n=100 for Msh2–Msh6, Msh2–Msh3, and Msh2–Msh6(3MBD); pre-labelled nucleosomes: n=31, 28 and 25 for Msh2–Msh6, Msh2–Msh3 and Msh2–Msh6(3MBD)). The data for Msh2–Msh6 are acquired in this study and agree with a previous study.
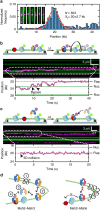
Figure 6
Figure 6. Msh2–Msh3 recognizes DNA lesions via both 1D sliding and 3D collisions.
(a) Distribution of Msh2–Msh3 molecules on lesion-containing DNA. The red line is a Gaussian fit to the data (n=503). The center of the peak corresponds to the expected location of the DNA flap (20 kb from the top DNA barrier). The inset shows seven representative DNA molecules with flap-bound Msh2–Msh3. (b) Cartoon illustration (top) and kymograph (middle) of Msh2–Msh3 (magenta) hopping over a nucleosome (post labelled; green) and stopping at a DNA lesion (3′-ssDNA flap; red octagon). The corresponding single-particle trajectory is shown below. The Msh2–Msh3 trajectory is in magenta, the nucleosome position is represented with a solid green line, and the flap position is indicated as a dashed red line (also see Supplementary Fig. 8). (c) Cartoon (top), kymograph (middle), and single-particle trajectory of Msh2–Msh3 (magenta) recognizing a 3′-ssDNA flap via 3D collision (bottom). (d) A model for how Msh2–Msh3 (left) and Msh2–Msh6 (right) scan DNA to find a lesion. Msh2–Msh3 diffuses via a combination of 1D sliding (1) and hopping (2). Msh2–Msh3 dynamics facilitate transient release from the DNA track and hopping over nucleosomes (3) but still support lesion recognition (red octagon) (4). In contrast, Msh2–Msh6 does not hop on DNA and is blocked by a nucleosome roadblock.

Similar articles

Cited by

References

    1. Tafvizi A., Mirny L. A. & van Oijen A. M. Dancing on DNA: kinetic aspects of search processes on DNA. Chem. Phys. Chem. 12, 1481–1489 (2011). - PMC - PubMed
    1. Halford S. E. & Marko J. F. How do site-specific DNA-binding proteins find their targets? Nucleic Acids Res. 32, 3040–3052 (2004). - PMC - PubMed
    1. Blainey P. C. et al.. Nonspecifically bound proteins spin while diffusing along DNA. Nat. Struct. Mol. Biol. 16, 1224–1229 (2009). - PMC - PubMed
    1. Cravens S. L. et al.. Molecular crowding enhances facilitated diffusion of two human DNA glycosylases. Nucleic Acids Res. 43, 4087–4097 (2015). - PMC - PubMed
    1. Schonhoft J. D. & Stivers J. T. Timing facilitated site transfer of an enzyme on DNA. Nat. Chem. Biol. 8, 205–210 (2012). - PMC - PubMed

Publication types

LinkOut - more resources