. 2016 Feb 3:7:10539.
doi: 10.1038/ncomms10539.

Epigenetic re-expression of HIF-2α suppresses soft tissue sarcoma growth

Affiliations

Epigenetic re-expression of HIF-2α suppresses soft tissue sarcoma growth

Michael S Nakazawa et al. Nat Commun. .

Abstract

In soft tissue sarcomas (STS), low intratumoural O2 (hypoxia) is a poor prognostic indicator. HIF-1α mediates key transcriptional responses to hypoxia, and promotes STS metastasis; however, the role of the related HIF-2α protein is unknown. Surprisingly, here we show that HIF-2α inhibits high-grade STS cell growth in vivo, as loss of HIF-2α promotes sarcoma proliferation and increases calcium and mTORC1 signalling in undifferentiated pleomorphic sarcoma and dedifferentiated liposarcoma. We find that most human STS have lower levels of EPAS1 (the gene encoding HIF-2α) expression relative to normal tissue. Many cancers, including STS, contain altered epigenetics, and our findings define an epigenetic mechanism whereby EPAS1 is silenced during sarcoma progression. The clinically approved HDAC inhibitor Vorinostat specifically increases HIF-2α, but not HIF-1α, accumulation in multiple STS subtypes. Vorinostat inhibits STS tumour growth, an effect ameliorated by HIF-2α deletion, implicating HIF-2α as a biomarker for Vorinostat efficacy in STS.


Figures

Figure 1
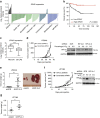
Figure 1. HIF-2α suppresses tumour growth in UPS.
(a) Tumour latency of LSL-KrasG12D/+; Trp53fl/fl (KP, n=16) and LSL-KrasG12D/+; Trp53fl/fl; Epas1fl/fl (KPH2, n=19) mice, shown as days post-injection of Ad-Cre virus. The P-value was calculated using a log-rank (Mantel-Cox) test. (b) Left: a cohort of KP (n=7) and KPH2 (n=9) mice were killed 7 weeks post-Ad-Cre virus injection. Representative images of the hind limb where Ad-Cre was injected in each cohort are shown. Right: weight of KP and KPH2 tumours at 7 weeks post-Ad-Cre injection (grams; error bars are±s.e.m.). *P<0.05. (c) Immunohistochemical staining of BrdU in KP (n=5) and KPH2 (n=5) tumours. Left: images representative of KP and KPH2 cohort. Right: quantification of percentage of BrdU+ cells in KP and KPH2 tumours, over 10 high power fields (HPF) per sample (error bars are ±s.e.m.). *P<0.05. Scale bar, 25 μm. (d) Left: representative images of the hind limb of KP (n=5) and LSL-KrasG12D/+; Trp53fl/fl; Arntfl/fl KPA (n=9) mice 7 weeks post-Ad-Cre virus injection. Right: weights of KP and KPA tumours 7 weeks post-Ad-Cre virus injection (grams; error bars are±s.e.m.). *P<0.05. P-values were calculated from a two-tailed Student's t-test for parts bd.
Figure 2
Figure 2. Loss of HIF-2α promotes liposarcoma and fibrosarcoma tumour growth in vivo.
(a) EPAS1 mRNA expression from Oncomine analysis of the Barretina et al. sarcoma patient samples data set. Values are normalized to median-centered intensity, and shown on a log2 scale. Dediff. lipo., dedifferentiated liposarcoma; MFH/myxofibro., myxofibrosarcoma; MFH/pleo., UPS; myxoid/RC lipo., myxoid/round cell liposarcoma; pleomprh. lipo., pleomorphic liposarcoma. (b) Kaplan–Meier curve of overall survival of liposarcoma patients from the Gobble et al. data set, segregated into the bottom 50% EPAS1 expression (Low EPAS1, n=47) and top 50% EPAS1 expression (High EPAS1, n=47). The P-value was calculated using a log-rank (Mantel–Cox) test. (c) EPAS1 mRNA expression of well-differentiated liposarcoma (`WD-LPS', n=52) compared with dedifferentiated liposarcoma (`DD-LPS', n=20) patient samples from the Gobble et al. data set. Values are normalized to median-centered intensity, and shown on a log2 scale. ***P<0.001. (d) Left: tumour volume of LPS246 liposarcoma xenografts with scrambled (SCR; n=9) or HIF-2α shRNA (n=9). Right: immunoblot demonstrating HIF-2α knockdown with two independent HIF-2α shRNAs compared with SCR shRNA. **P<0.01. (e) Left: weights of LPS246 xenograft tumours with SCR shRNA (shSCR) or HIF-2α shRNA (shHIF-2α 2) at time of killing, measured in grams. **P<0.01. Right: image of representative LPS246 tumours with shSCR or HIF-2α shRNA (shHIF-2α 2). (f) Left: tumour volume of HT-1080 fibrosarcoma xenografts with SCR (n=5) or HIF-2α shRNA (HIF-2α 1; n=10). Right: immunoblot demonstrating HIF-2α knockdown with HIF-2α shRNA (HIF-2α 1) compared with SCR shRNA. **P<0.01. (g) Weights of HT-1080 xenograft tumours with shSCR and HIF-2α shRNA (shHIF-2α 1) at time of killing, measured in grams. *P<0.05. All error bars represent the mean±s.e.m. P-values for part cg were calculated using a two-tailed Student's t-test.
Figure 3
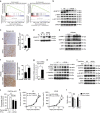
Figure 3. Loss of HIF-2α increases mTORC1 signalling in soft tissue sarcomas.
(a) Gene set enrichment analysis (GSEA) comparing expression data of KP ‘WT' and KPH2 ‘Hif2a' autochthonous UPS tumours. (b) Immunoblot assessing mTORC1 and mTORC2 activity in KP and KPH2 tumours. Phosphorylated-(p) 4E-BP1 (indicated with an *) and S6K1 were used as mTORC1 readouts, and (p)-AKT was used as an mTORC2 readout. (c) Left: representative images of immunohistochemical staining of phosphorylated-S6 (phospho-S6) on KP (n=5) and KPH2 (n=5) tumours. Right: quantification of phospho-S6+ cells in KP and KPH2 tumours. 10 high-powered fields per tumour were quantified. ***P<0.001. (d) Immunoblot of 4E-BP1 in cell lines derived from KP and KPH2 tumours. Cells were subjected to 1% O2 for 16 h (H) or grown at 21% O2 (N). (e) Expression of 4E-BP1 and S6K1 phosphorylation in LPS246 xenografts with scrambled (SCR) or HIF-2α (H2α) shRNA. (f) Left: representative images of phospho-S6 immunohistochemical staining on LPS246 xenografts with SCR (n=5) or HIF-2α (H2α) shRNA (n=5; error bars are ±s.e.m.). 10 high-powered fields per tumour were quantified. *P<0.05. (g) Quantitative reverse trascriptase-PCR validation of Ano1 mRNA expression in KP (n=4) and KPH2 (n=3) tumours used for RNA-seq *P<0.05. (h) Immunoblot of ANO1 and downstream targets p-EGFR (Y1068) and p-CaMKIIα (T268) in KP and KPH2 autochthonous tumours. (i) KP and KPH2 cells were serum starved for 24 h, then replete media with DMSO or CaCCInh-A01 (10 μM) was added for 6 h to the cells. Lysates were immunoblotted for p-CAMKIIα and mTORC1 readouts p-4E-BP1 and p-S6K1. (j) ANO1 inhibitor's effect on KP and KPH2 cell growth. Cells were treated with DMSO or CaCCInh-A01 (10 μM) for 3 days in 21% or 1% O2 conditions. Shown is the percentage of cells counted in the CaCCInh-A01 treated versus the respective DMSO-treated control, with each bar representing three biological triplicates. **P<0.01. (k) Left: tumour volume of KP-derived UPS allografts expressing SCR (n=5) or Ano1 shRNA (Ano1 2; n=5). Right: tumour volume of KPH2-derived UPS allografts expressing SCR (n=5) or Ano1 shRNA (n=5). **P<0.01. (l) Relative average size of KP and KPH2 tumours infected with SCR or Ano1 shRNA. The SCR shRNA average volume was normalized to 1.0 for both KP and KPH2 cohorts. **P<0.01. All error bars represent the mean±s.e.m. All P-values were calculated using a two-tailed Student's t-test.
Figure 4
Figure 4. HDAC inhibition increases HIF-2α expression in UPS.
(a) Epas1 mRNA expression of tumours isolated from KP mice 7 weeks after Ad-Cre injection (early; n=4), 8.5 weeks after Ad-Cre injection (late; n=4), and whole-mouse gastrocnemius muscle from uninjected muscle (n=3). (b) EPAS1 mRNA expression of sarcoma cell lines classified as SAHA resistant (9 cell lines), intermediate resistant (Interm. Resistant; 14 cell lines) and sensitive (12 cell lines) from the Oncomine analysis of Garnett et al. data set. Values are normalized to median-centered intensity, and shown on a log2 scale. *P<0.05, **P<0.01. (c) HIF1A mRNA expression from the Garnett et al. data set (error bars are±s.e.m.). SAHA resistant, 9 cell lines; Intermediate resistant (Interm. Resistant), 13 cell lines; Sensitive, 12 cell lines. (d) Epas1 mRNA expression of KP230 and KP250 mouse UPS cell lines treated with DMSO or SAHA at the indicated drug concentrations. Each bar represents three independent experiments performed in triplicate. *P<0.05, **P<0.01. (e) Hif1a mRNA expression of KP230 and KP250 cells treated with DMSO or SAHA (2 μM). Each bar represents three independent experiments performed in triplicate. (f) Immunoblot for HIF-1α and HIF-2α protein in KP230 and KP250 cells treated with DMSO or SAHA (2 μM), grown under 21% O2 or 0.5% O2 conditions. (g) Serpine1 mRNA expression of KP230 and KP250 cells treated with DMSO or SAHA at the indicated drug concentrations. Each bar represents three independent experiments performed in triplicate. *P<0.05, **P<0.01, ***P<0.001. (h) ChIP of KP250 cell treated with DMSO or SAHA (2 μM), grown under 21% O2 (N) or 0.5% O2 (H) conditions. ChIP primers used amplified the 500-bp fragment upstream of the Epas1 and Hif1a TSSs. Histone H3 and acetylated histone H3 specific (H3Ac) antibodies were used for ChIP, with IgG as negative control. Input was diluted 1:100. Results are representative of two independent experiments. All data shown are the mean±s.e.m. All P-values were calculated using a two-tailed Student's t-test.
Figure 5
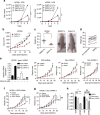
Figure 5. SAHA inhibition of UPS allograft growthis dependent on HIF-2α re-expression.
(a) Proliferation of KP230 and KP250 cells treated with DMSO or SAHA (2 μM) under 21% O2 or 1% O2. Drug treatment began on day 1. Each line represents three independent experiments performed in duplicate. ***P<0.001. (b) Tumour size of subcutaneous (s.c.) KP250 allografts in DMSO (n=10) or SAHA (50 mg kg−1 per day)-treated mice (n=10). Mice were treated once tumours reached ∼100 mm3. *P<0.05, ***P<0.001. (c) Tumour weights from DMSO- and SAHA-treated mice. Images are representative of tumours from the DMSO and SAHA cohorts. ***P<0.001. (d) Weights of mice pre-treatment and at time of killing. Black squares, DMSO-treated mice; red circles, SAHA-treated mice. (e) Left: Epas1 mRNA expression of KP250 cells harbouring scrambled (SCR) shRNA, and two independent HIF-2α (H2α) shRNAs, treated with DMSO or SAHA (2 μM) in vitro. Bars represent two independent experiments performed in triplicate. Right: Relative size increases of s.c. KP250 allografts with SCR shRNA, H2α 1 shRNA and H2α 2 shRNA-treated with DMSO or SAHA (50 mg kg−1 per day). Mice were treated 10 days post-injection of tumour cells. For each shRNA, 7 mice were treated DMSO and 7 mice were treated with SAHA. *P<0.05, **P<0.01. (f) Relative tumour size of s.c. KP250+SCR shRNA allografts treated with DMSO, doxorubicin or doxorubicin and SAHA. Treatment began 10 days post-injection of tumour cells. Doxorubicin was administered at 5 mg kg−1 per week, and SAHA was administered at 50 mg kg−1 per day. *P<0.05, **P<0.01. (g) Comparative tumour size of KP250+HIF-2α shRNA 2 (H2α) allografts treated with DMSO, doxorubicin or doxorubicin and SAHA. *P<0.05. (h) Relative tumour weights of KP250 allografts with SCR or H2α shRNA. Sizes of doxorubicin and doxorubicin with SAHA treatment are normalized to their respective DMSO control. **P<0.01. All data shown are the mean±s.e.m. All P-values were calculated using a two-tailed Student's t-test.
Figure 6
Figure 6. HIF-2α expression is required for SAHA's efficacy in an autochthonous UPS model.
(a) Top: schematic of tracking autochthonous KP tumour growth in DMSO- and SAHA-treated mice. After Ad-Cre injection, mice were imaged bi-weekly until tumours were detectable and measured ∼50–100 mm3. Mice were randomized to DMSO control (n=5) or SAHA (n=5; 50 mg kg−1 per day) treatments, and tumour growth was followed by bi-weekly CT scans. Bottom: representative axial CT images of KP mice pre- and post-treatment with DMSO or SAHA. Dashed white line demarcates the tumour boundary. (b) Relative sizes of individual tumours from KP mice receiving DMSO or SAHA treatment. (c) Comparison of the relative sizes of all DMSO- and SAHA-treated KP tumours at the time of killing (error bars are±s.e.m.). *P<0.05. P-values were calculated from a two-tailed Student's t-test. (d) Weights of KP mice pre-treatment and at time of killing (error bars are±s.e.m.). Black squares, DMSO-treated mice; red circles, SAHA-treated mice. (e) Immunoblot of HIF-2α protein in KP autochthonous tumours from DMSO- and SAHA-treated mice. GAPDH served as loading control. (f) Left: representative transverse CT images of KPH2 mice pre- and post-treatment with DMSO or SAHA. Mice were treated and imaged as described in a. Right: relative sizes of individual tumours from KPH2 mice receiving DMSO (n=4) or SAHA (n=5) treatment. (g) Comparison of the relative sizes of all DMSO- and SAHA-treated KPH2 tumours at the time of killing (error bars are ±s.e.m.). (h) Model of EPAS1 regulation in the STS examined. EPAS1 expression is epigenetically downregulated through class I/II HDACs. Loss of HIF-2α increases ANO1 and calcium signalling, which subsequently increases mTORC1 activity in tumours and promotes sarcoma proliferation. HIF-2α loss may also increase sarcoma growth independent of this pathway.

Similar articles

Cited by

References

    1. Fletcher C. D. The evolving classification of soft tissue tumours—an update based on the new 2013 WHO classification. Histopathology 64, 2–11 (2014). - PubMed
    1. Siegel R., Ma J., Zou Z. & Jemal A. Cancer Statistics, 2014. CA Cancer J. Clin. 64, 9–29 (2014). - PubMed
    1. Taylor B. S. et al. Advances in sarcoma genomics and new therapeutic targets. Nat. Rev. Cancer 11, 541–557 (2011). - PMC - PubMed
    1. Quesada J. & Amato R. The molecular biology of soft-tissue sarcomas and current trends in therapy. Sarcoma 2012, 849456 (2012). - PMC - PubMed
    1. Linch M., Miah A. B., Thway K., Judson I. R. & Benson C. Systemic treatment of soft-tissue sarcoma-gold standard and novel therapies. Nat. Rev. Clin. Oncol. 11, 187–202 (2014). - PubMed

Publication types

MeSH terms

Substances