. 2016 Feb 15;76(4):844-54.
doi: 10.1158/0008-5472.CAN-15-1287. Epub 2016 Feb 2.

Mesenchymal Tumorigenesis Driven by TSC2 Haploinsufficiency Requires HMGA2 and Is Independent of mTOR Pathway Activation

Affiliations

Mesenchymal Tumorigenesis Driven by TSC2 Haploinsufficiency Requires HMGA2 and Is Independent of mTOR Pathway Activation

Jeanine D'Armiento et al. Cancer Res. .

Abstract

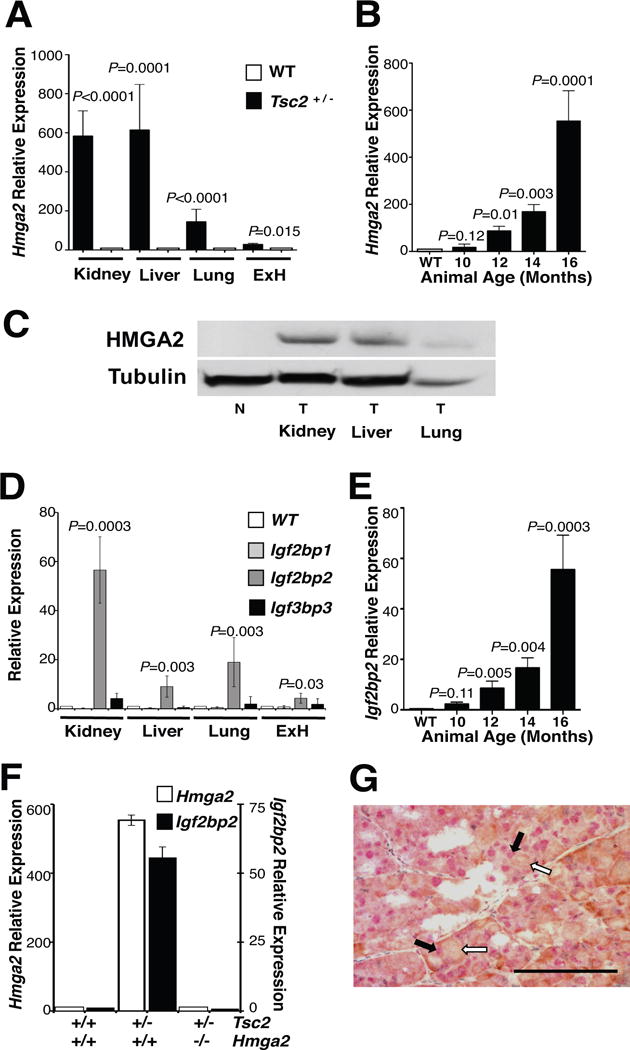
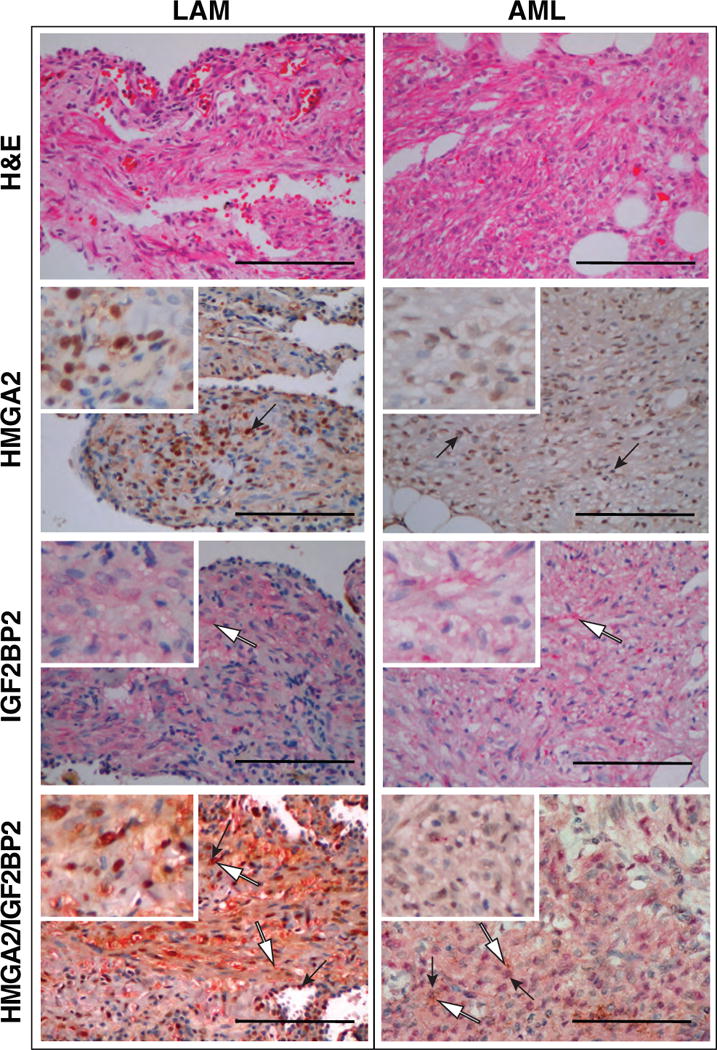
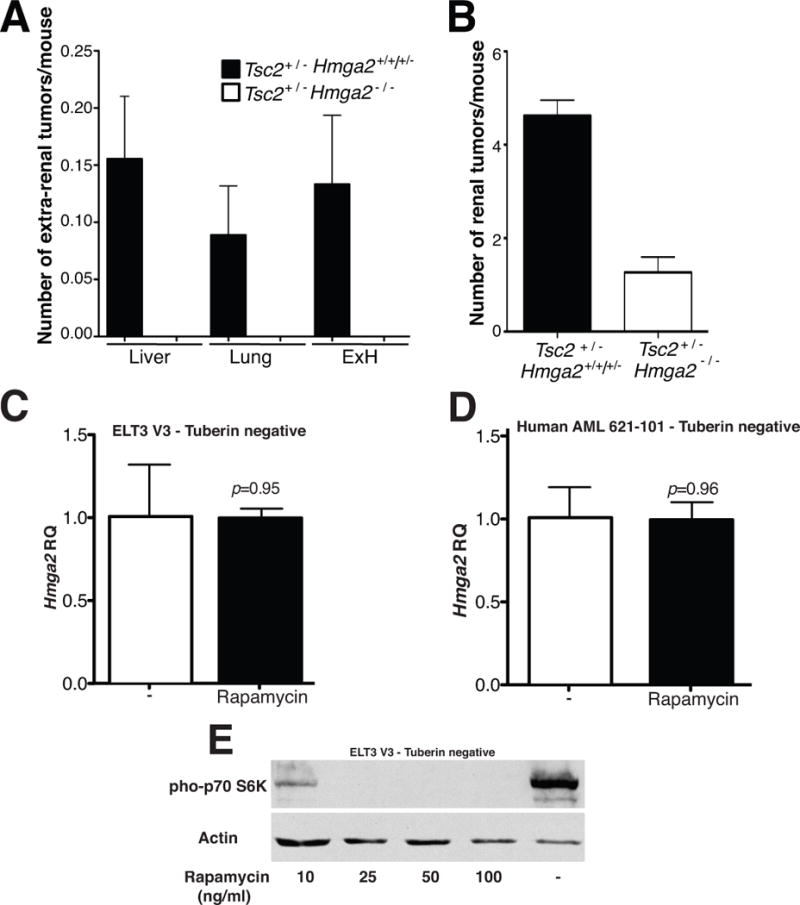
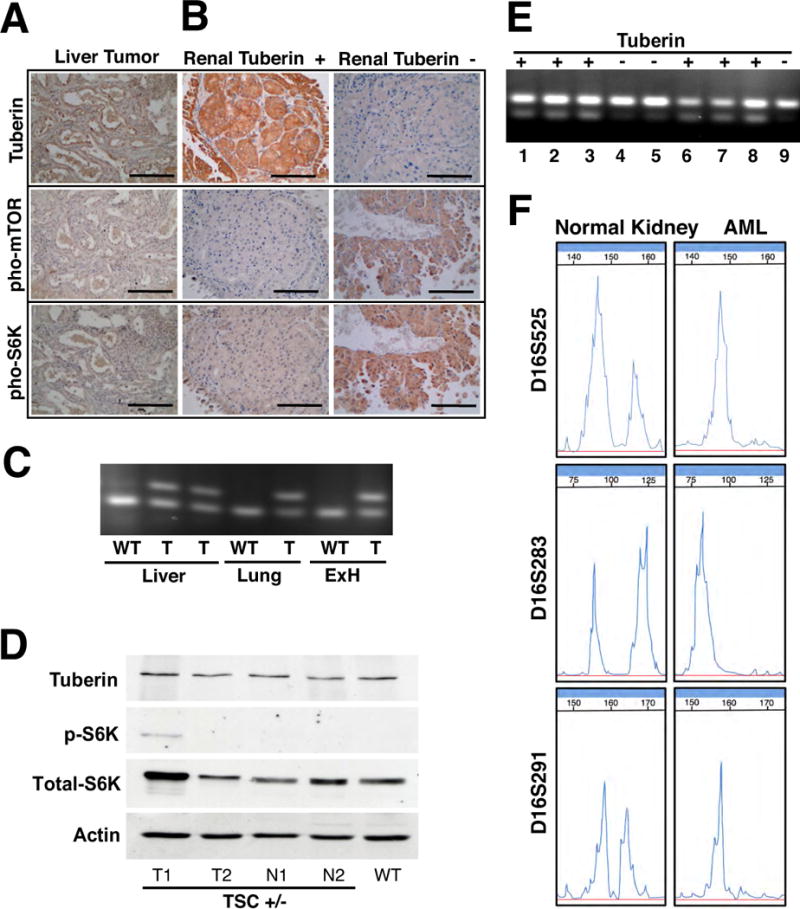
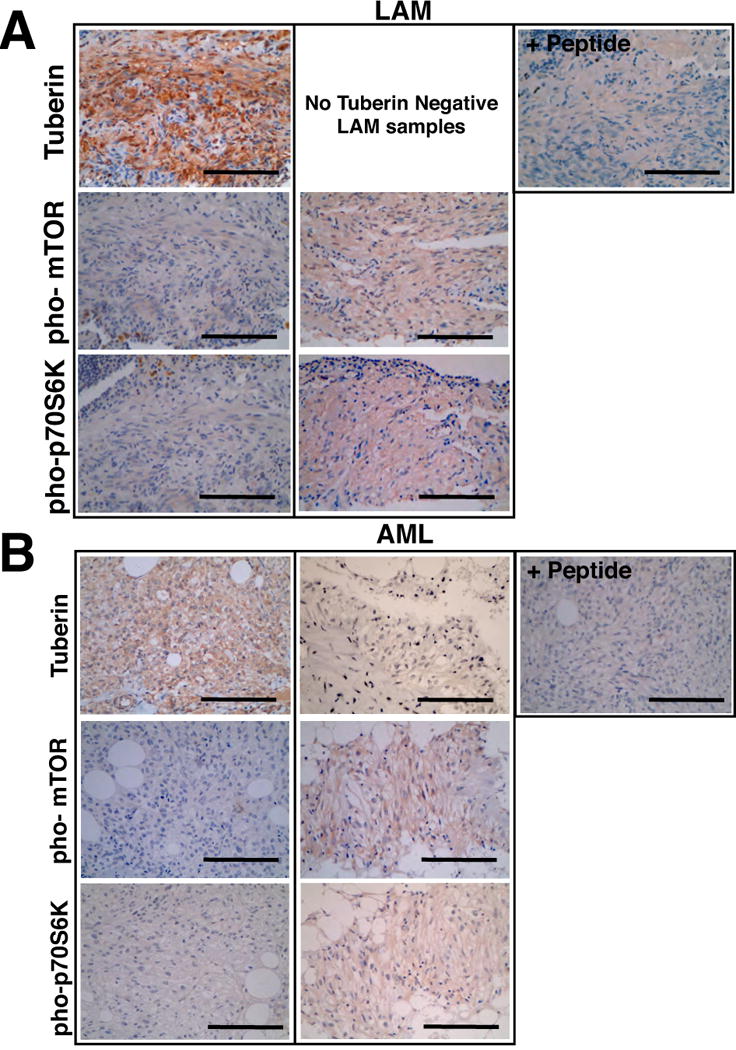
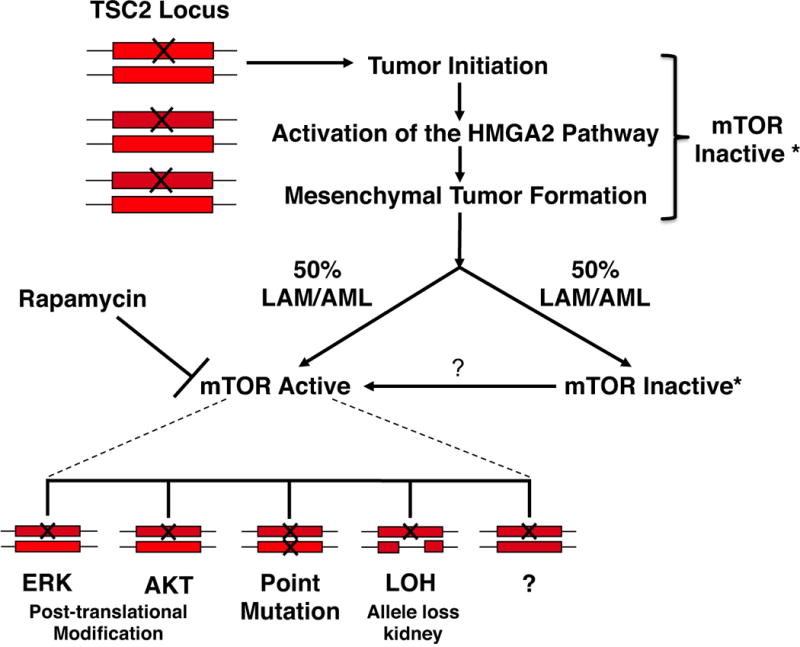
Tuberous sclerosis (TSC) is a tumor suppressor gene syndrome that is associated with the widespread development of mesenchymal tumor types. Genetically, TSC is said to occur through a classical biallelic inactivation of either TSC genes (TSC1, hamartin or TSC2, tuberin), an event that is implicated in the induction of the mTOR pathway and subsequent tumorigenesis. High Mobility Group A2 (HMGA2), an architectural transcription factor, is known to regulate mesenchymal differentiation and drive mesenchymal tumorigenesis in vivo. Here, we investigated the role of HMGA2 in the pathogenesis of TSC using the TSC2(+/-) mouse model that similarly mirrors human disease and human tumor samples. We show that HMGA2 expression was detected in 100% of human and mouse TSC tumors and that HMGA2 activation was required for TSC mesenchymal tumorigenesis in genetically engineered mouse models. In contrast to the current dogma, the mTOR pathway was not activated in all TSC2(+/-) tumors and was elevated in only 50% of human mesenchymal tumors. Moreover, except for a subset of kidney tumors, tuberin was expressed in both human and mouse tumors. Therefore, haploinsufficiency of one TSC tumor suppressor gene was required for tumor initiation, but further tumorigenesis did not require the second hit, as previously postulated. Collectively, these findings demonstrate that tissue-specific genetic mechanisms are employed to promote tumor pathogenesis in TSC and identify a novel, critical pathway for potential therapeutic targeting.


Conflict of interest statement

The authors declare no competing interests exist.

Figures

Figure 1
Figure 1. HMGA2 is expressed in all tumors from Tsc2+/− mice
(A) Hmga2 is expressed in all tumors from 16 month-old Tsc2+/− mice. qPCR was performed on total RNA from tumors in multiple organs and corresponding normal tissue. (B) Hmga2 expression increases in kidney tumors as mice age. (C) Western blot performed on normal and tumor tissue from several organs for HMGA2 and tubulin expression. N, normal tissue; T, tumor. (D) Igf2bp2 was the only member of the Igf2bp family of genes to be expressed in 16-month-old Tsc2+/− mice tumors. (E) Igf2bp2 expression increased in renal tumors, as mice aged. (F) Igf2bp2 expression correlated with Hmga2 expression in renal tumors from 16-month-old mice for each genotype. (A-B, D-F) No difference was observed between Tsc2+/–Hmga2+/+ and Tsc2+/–Hmga2+/− mice. Error bars, mean + s.e.m. P value shown, comparing to normal tissue of corresponding organ. (G) Renal cell carcinoma double stained for nuclear HMGA2 (red) and cytoplasmic IGF2BP2 (brown). Black and white filled arrows denote positive nuclear HMGA2 staining (red staining) and positive cytoplasmic IGF2BP2 staining (brown staining), respectively. (Scale bar, 100 mm). See also Supplemental Figure S1 for additional immunohistochemistry results.
Figure 2
Figure 2. HMGA2 expression in LAM and AML
Pulmonary LAM (left panels) and renal AML (right panels) stained for H and E, nuclear HMGA2 and cytoplasmic IGF2BP2. Black arrows point to regions of positive nuclear HMGA2 staining (red) and white filled arrows point to regions of positive cytoplasmic IGF2BP2 staining (brown). Double stained for nuclear HMGA2 (red) and cytoplasmic IGF2BP2 (brown) also shown (bottom panels).
Figure 3
Figure 3. Tsc2+/− extra-renal tumorigenesis is HMGA2 dependent with HMGA2 expression independent of mTOR activation status
(A) The number of extra-renal tumors per mouse was observed in both Tsc2+/− mice and Hmga2 null mice, from mice sacrificed between 12–16 months. A p value of 0.0038 is observed when comparing extra-renal tumor frequency in both mouse groups. (B) The number of renal tumors was statistically different in the Hmga2 background (p<0.0001). Error bars, mean + s.e.m, where n=45 and n=19 for Hmga2 expressing and null mice, respectively. Data was combined for Tsc2+/−Hmga2+/+ and Tsc2+/−Hmga2+/− mice (referred to as Tsc2+/−), as no difference was observed between each genotype in (A) and B. (C) ELT V3 and (D) human AML 621-101 cells were exposed to 50ng/ml rapamycin for 24 hours HMGA2 gene expression was determined. Error bars, mean + s.e.m. P value shown, comparing to both groups. (E) Western blot analysis for phosphorylation of pho-p70 S6K in ELT3 V3 cells stimulated with various concentrations of rapamycin for 24 hours.
Figure 4
Figure 4. The Tuberin/mTOR pathway profile is diverse in tumors from Tsc2+/− mice
Immunohistochemistry of (A) liver tumors and (B) kidney tumors from Tsc2+/− mice was performed for tuberin, pho-mTOR (Ser2448) and pho-p70 S6 kinase (Thr389). Liver samples are a representative extra-renal sample for the extra-renal tumors. Scale bars represent 100mm. Typical staining for tuberin positive and tuberin negative renal tumors are represented. (C) Tsc2 LOH PCR analysis demonstrated no Tsc2 LOH in the extra-renal tumors (liver, lung and ExH). (D) Immunoblots were performed on renal tumor and non-tumor tissue from Tsc2+/− mice and renal tissue from wild-type mice for tuberin, pho-p70 S6 kinase (Thr389), anti-S6K [E175], and actin. WT, wild-type kidney tissue; N, normal or non-tumor kidney tissue; T, kidney tumor. (E) Renal tumors that had no detectable immunoreactivity to tuberin (Tuberin -) antibody exhibited Tsc2 LOH. The upper band represents the target mutant allele and the lower band represents the wild-type allele. Lanes 1–6 are tumors from Tsc2+/− Hmga2+/+ and Tsc2+/− Hmga2+/− mice and Lanes 7–9 are tumors from Tsc2+/− Hmga2−/− mice. (F) Tuberin negative AML have TSC2 LOH. Representative PCR analysis of chromosome 16p13.3 microsatellite markers D16S525, D16S283 and D16S291 from normal kidney and AML samples. See also Supplemental Figure S2 for further analysis.
Figure 5
Figure 5. The mTOR pathway in human LAM and AML tumors
Immunohistochemistry was performed on (A) LAM and (B) AML tissue for tuberin, pho-mTOR (Ser2448) and pho-p70 S6 kinase (Thr389). For each tumor, the panels represent typical samples that exhibit positive and negative expression of the indicated components of the mTOR pathway. Peptide represents tuberin peptide competition assay control. Scale bars represent 100mm. See also Supplemental Figure S2 and Supplemental Figure S3.
Figure 6
Figure 6. A model for the multiple mechanisms in TSC tumor pathogenesis
The rectangle represents a TSC allele and the X denotes a mutation. The tumorigenic pathway is initiated by haploinsufficiency at the TSC2 locus and upon activation of the HMGA2 pathway mesenchymal tumor formation occurs. At a frequency of approximately 50% the mTOR pathway remains inactive and the tumor continues to progress. In the other 50% of cases multiple pathways have been identified that lead to activation of the mTOR pathway and will be Rapamycin sensitive.

Similar articles

Cited by

References

    1. Crino PB, Nathanson KL, Henske EP. The tuberous sclerosis complex. N Engl J Med. 2006;355(13):1345–56. - PubMed
    1. Orlova KA, Crino PB. The tuberous sclerosis complex. Ann N Y Acad Sci. 2010;1184:87–105. - PMC - PubMed
    1. Curatolo P, Bombardieri R, Jozwiak S. Tuberous sclerosis. Lancet. 2008;372(9639):657–68. - PubMed
    1. Johnson SR. Lymphangioleiomyomatosis. Eur Respir J. 2006;27(5):1056–65. - PubMed
    1. Henske EP, McCormack FX. Lymphangioleiomyomatosis – a wolf in sheep’s clothing. J Clin Invest. 2012;122(11):3807–16. - PMC - PubMed

Publication types

LinkOut - more resources