. 2016 Feb 3:7:10557.
doi: 10.1038/ncomms10557.

Stabilization of active matter by flow-vortex lattices and defect ordering

Affiliations

Stabilization of active matter by flow-vortex lattices and defect ordering

Amin Doostmohammadi et al. Nat Commun. .

Abstract

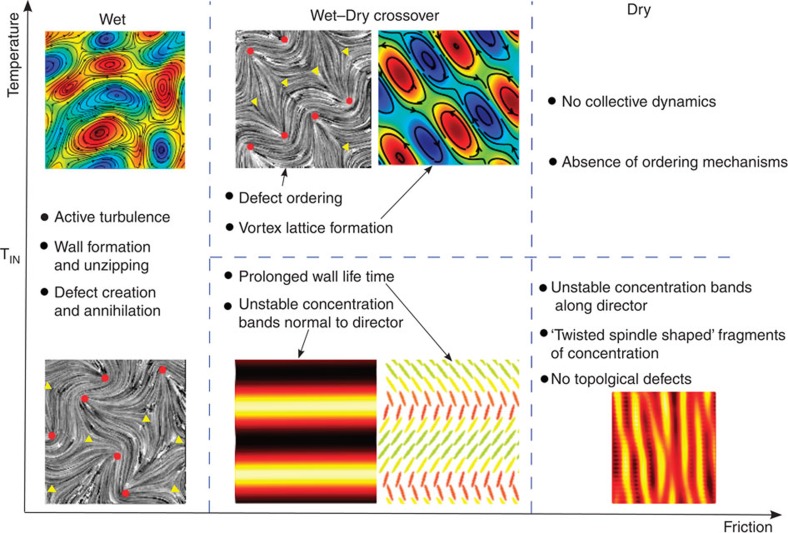
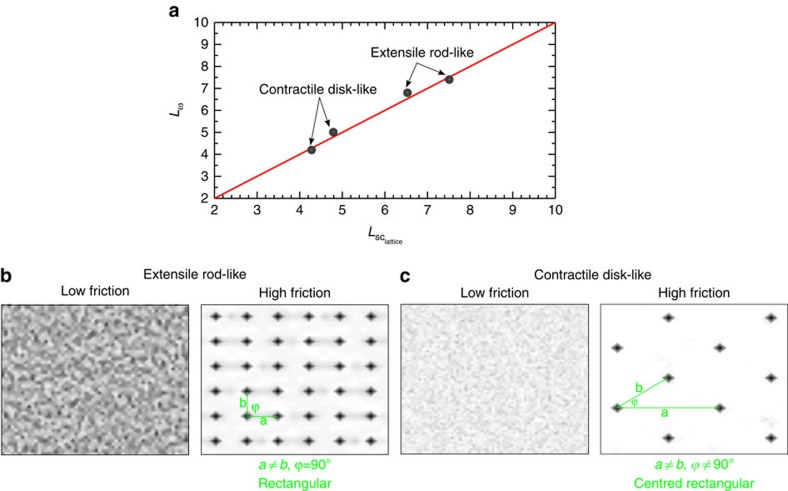
Active systems, from bacterial suspensions to cellular monolayers, are continuously driven out of equilibrium by local injection of energy from their constituent elements and exhibit turbulent-like and chaotic patterns. Here we demonstrate both theoretically and through numerical simulations, that the crossover between wet active systems, whose behaviour is dominated by hydrodynamics, and dry active matter where any flow is screened, can be achieved by using friction as a control parameter. Moreover, we discover unexpected vortex ordering at this wet-dry crossover. We show that the self organization of vortices into lattices is accompanied by the spatial ordering of topological defects leading to active crystal-like structures. The emergence of vortex lattices, which leads to the positional ordering of topological defects, suggests potential applications in the design and control of active materials.


Figures

Figure 1
Figure 1. Dynamical behaviours of active nematics in the temperature-friction phase space.
TIN denotes the isotropic-nematic transition temperature: above TIN at intermediate frictions we find a novel vortex lattice that entangles an ordered defect array. The blue-red colourmaps represent vorticity fields superimposed by streamlines (black solid lines). The concentration fields are depicted by red-yellow colourmaps. In the mid-lower section, the director field is illustrated by ellipsoids coloured by their orientations. Grey panels show director fields superimposed by topological defects (red circles and yellow triangles correspond to +1/2 and −1/2 defects).
Figure 2
Figure 2. Increasing friction drives the crossover from wet to dry active nematics.
(a,b) Temporal evolution of the concentration field and nematic director field for (a) γ=0.08 and (b) γ=0.8 with t=105, 5 × 10⁵, 8 × 10⁵ (in LB units) for left, middle and right columns, respectively. For each value of the friction the top row is a colour map indicating variations in concentration and the bottom row is the corresponding director field coloured by the orientation of nematic directors. +1/2 and −1/2 defects are denoted by red circles and blue triangles. (c) The RMS velocity is reduced by increasing friction. The inset illustrates the variation in log–log plot, showing the existence of different exponents. (d) The total number of topological defects initially increases, but drops sharply at γ∼0.1 and disappears at the dry limit.
Figure 3
Figure 3. Emergence of a vortex lattice and defect ordering for extensile rod-like particles.
(ac) Velocity field coloured by the magnitude of the vorticity. (df) Director fields visualized by Line Integral Convolution and superimposed by topological defects (with +1/2 and −1/2 defects denoted by red circles and yellow triangles). The hydrodynamic screening length is Lsc=15.30, 7.51, 5.10, (lattice units) for the left, middle, and right columns, respectively. (g) Orientation of a defect is determined by its position relative to neighbouring vortices. A director responds differently to either extensional (I) or compressional (III) flow at the edges of vortices while it experiences a shear (II) inside a vortex.
Figure 4
Figure 4. Emergence of a vortex lattice and defect ordering for contractile disk-like particles.
(ae) Velocity field coloured by the magnitude of the vorticity. The hydrodynamic screening length is Lsc=11.5, 8.57, 6.82, 4.28, 2.09 (lattice units) for (ae) respectively. (f) Vorticity–vorticity correlations function Cωω demonstrates the transition from active turbulence state to the vortex lattice configuration. (g) The stable structure of nematic directors and topological defects in the vortex lattice. Solid red and blue lines illustrate the clockwise and counterclockwise vortices. Topological defects with charges +1/2, −1/2, are shown by red circles and green triangles, respectively.
Figure 5
Figure 5. Properties of the vortex lattice.
(a) Dots indicate the characteristic vorticity length scale and the screening length at which the vortex lattice emerges for extensile and contractile systems, each for two different values of the activity. The red line indicates Lω=Lsc. (b,c) Colormaps of the structure factor for defects showing the emergence of positional ordering of defects at high friction for (b) extensile rod-like and (c) contractile disk-like particles.

References

    1. Ramaswamy S. The mechanics and statistics of active matter. Annu. Rev. Cond. Mat. Phys. 1, 323–345 (2010).
    1. Koch D. L. & Subramanian G. Collective hydrodynamics of swimming microorganisms: living fluids. Annu. Rev. Fluid Mech. 43, 637–659 (2011).
    1. Marchetti M. C. et al. Hydrodynamics of soft active matter. Rev. Mod. Phys. 85, 1143–1189 (2013).
    1. Dombrowski C., Cisneros L., Chatkaew S., Goldstein R. E. & Kessler J. O. Self-concentration and large-scale coherence in bacterial dynamics. Phys. Rev. Lett. 93, 098103 (2004). - PubMed
    1. Voituriez R., Joanny J.-F. & Prost J. Generic phase diagram of active polar films. Phys. Rev. Lett. 96, 028102 (2006). - PubMed

Publication types