. 2016 Feb 3:7:10580.
doi: 10.1038/ncomms10580.

Liver-derived ketone bodies are necessary for food anticipation

Affiliations

Liver-derived ketone bodies are necessary for food anticipation

Rohit Chavan et al. Nat Commun. .

Abstract

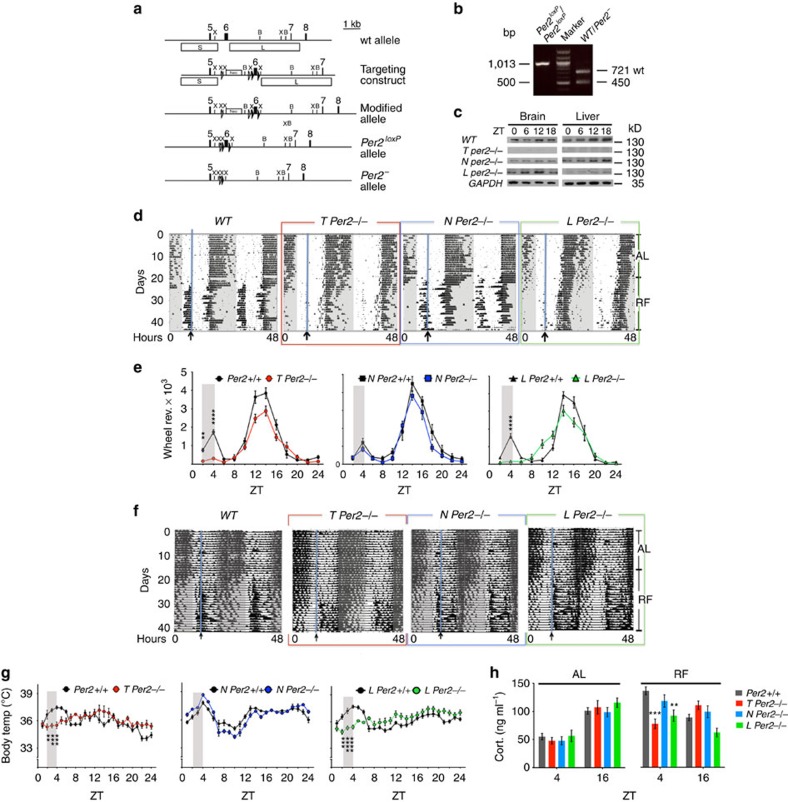
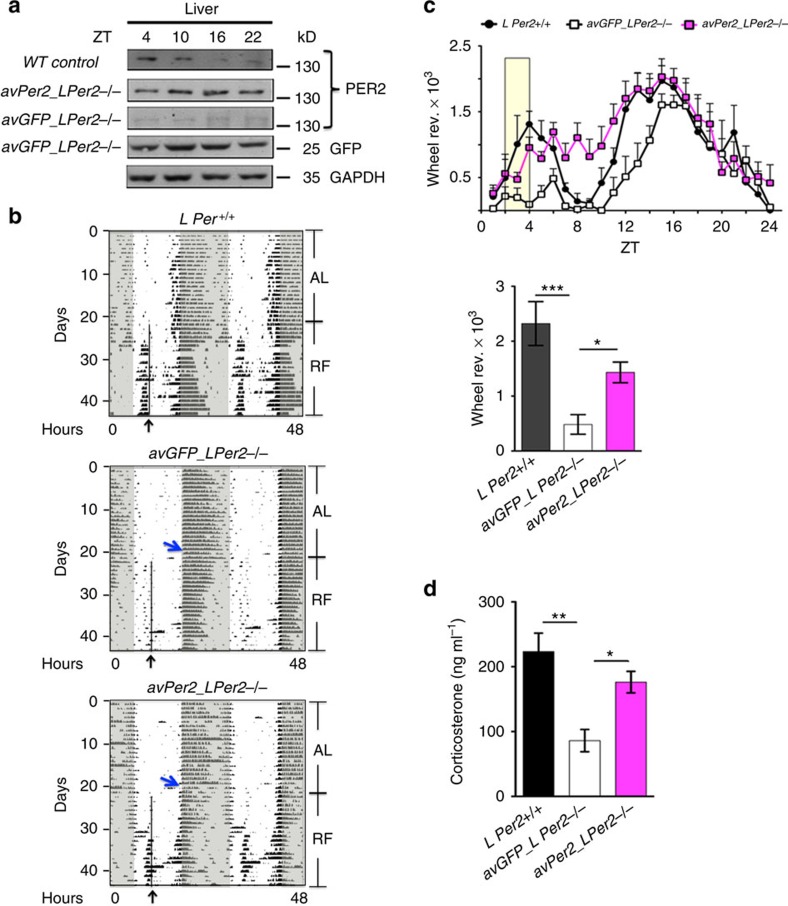
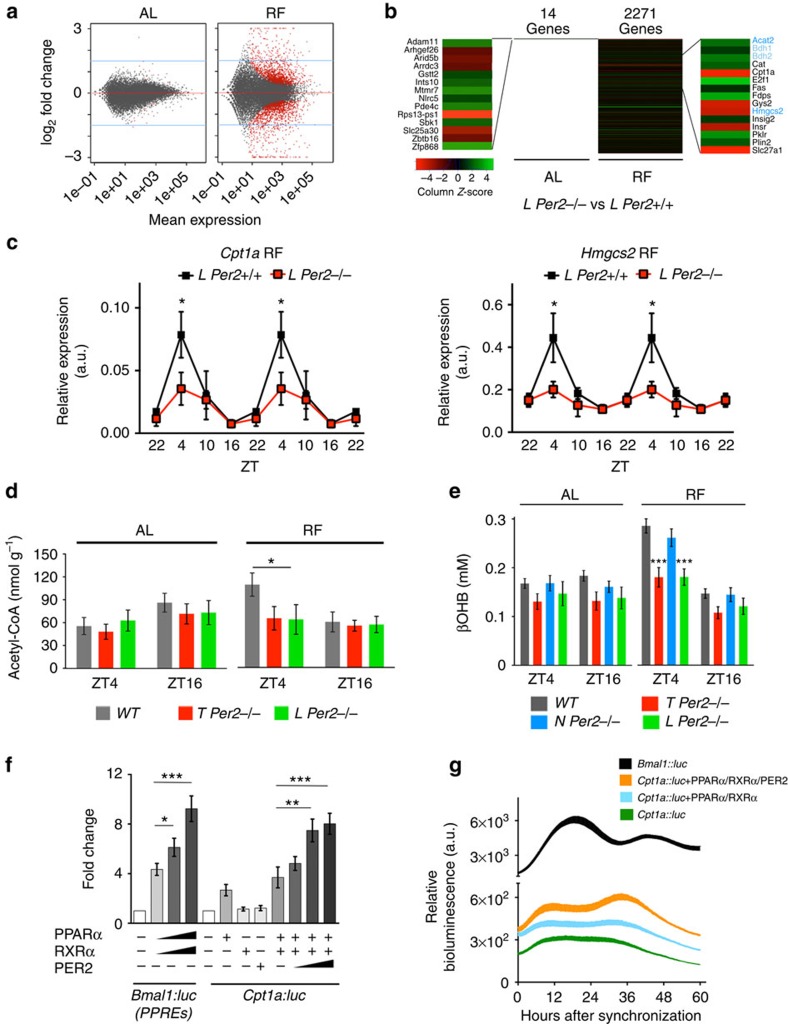
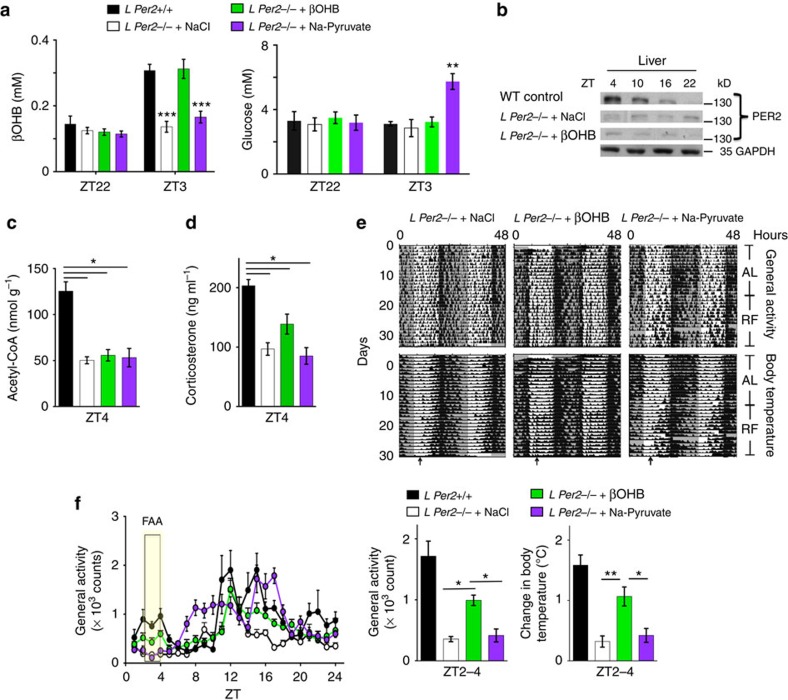
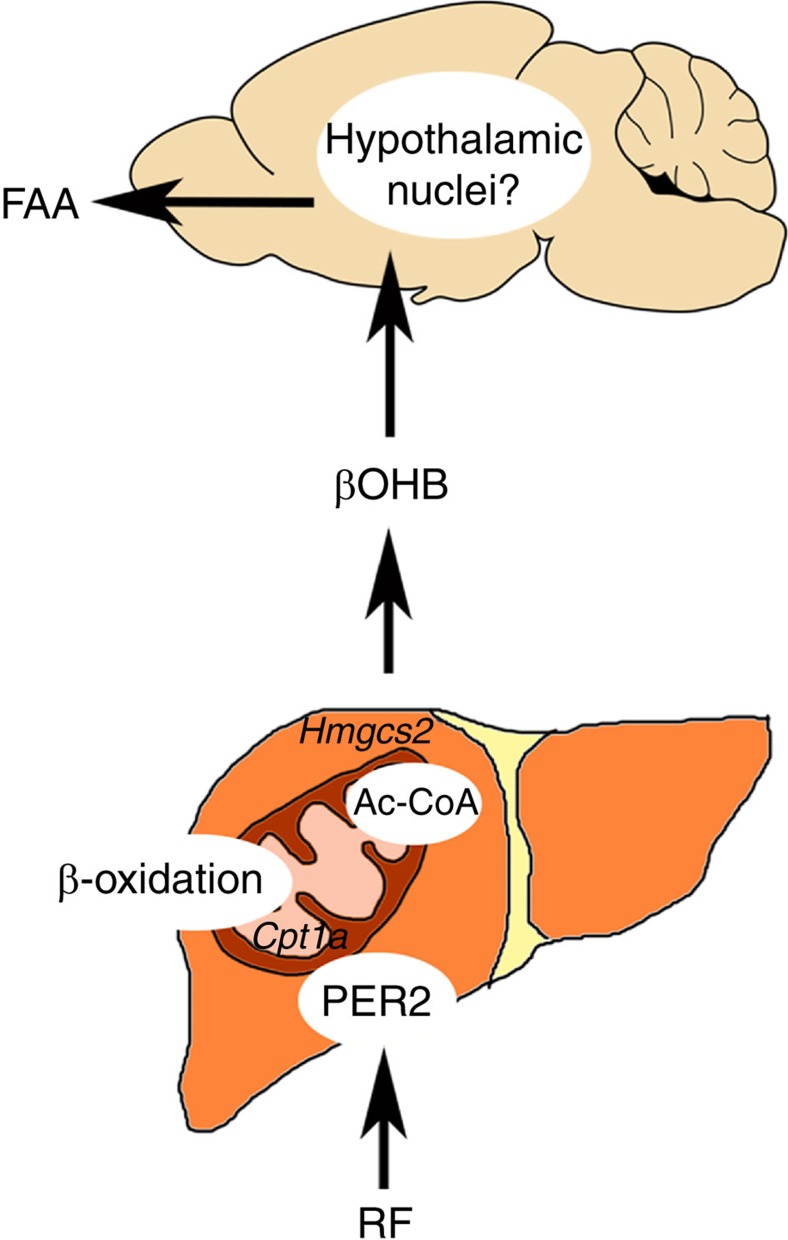
The circadian system has endowed animals with the ability to anticipate recurring food availability at particular times of day. As daily food anticipation (FA) is independent of the suprachiasmatic nuclei, the central pacemaker of the circadian system, questions arise of where FA signals originate and what role components of the circadian clock might play. Here we show that liver-specific deletion of Per2 in mice abolishes FA, an effect that is rescued by viral overexpression of Per2 in the liver. RNA sequencing indicates that Per2 regulates β-hydroxybutyrate (βOHB) production to induce FA leading to the conclusion that liver Per2 is important for this process. Unexpectedly, we show that FA originates in the liver and not in the brain. However, manifestation of FA involves processing of the liver-derived βOHB signal in the brain, indicating that the food-entrainable oscillator is not located in a single tissue but is of systemic nature.


Figures

Figure 1
Figure 1. Mice with loss of Per2 in the liver lack food anticipation.
(a) Scheme illustrating the generation of a conditional Per2 allele. For details see methods section. Numbers indicate exons, X, XhoI; B, BamHI; neo, neomycin resistance; open triangles, FRT recombination sites; filled triangles, loxP recombination sites; box S, short arm of homology; box L, long arm of homology. (b) PCR products representing the Per2loxP, the wild-type (wt) and Per2 alleles. (c) Western blot detecting PER2 protein in brain and liver tissue of the investigated genotypes. GAPDH as control. (d) Examples of double plotted wheel-running actograms under ad libitum (AL) and restricted feeding (RF) conditions. The arrow and blue line delineate daily access to food. (e) Quantification of wheel-running activity of n=10–16 animals for each genotype. The grey area highlights the time of anticipatory activity. (f) Examples of double plotted body temperature measurements under AL and RF conditions. The arrow and blue line delineate the start time of daily access to food. (g) Quantification of body temperature profiles of n=6 animals for each genotype (h) Corticosterone levels in the plasma of depicted genotypes under AL and RF conditions with n=4 for each genotype. All values are mean±s.e.m. For all analysis two-way ANOVA with Bonferroni post hoc test was applied. **P<0.01, ***P<0.001, ****P<0.0001. ANOVA, analysis of variance.
Figure 2
Figure 2. Rescue of food anticipation in L Per2−/− mice.
(a) Western blot of liver extracts from mice held under restricted feeding conditions showing constant expression of PER2 in the liver of LPer2−/− mice after application of adenovirus expressing Per2. (b) Examples of double plotted wheel-running actograms under ad libitum (AL) and restricted feeding (RF) conditions. The black arrow and line delineate daily access to food. The blue arrow indicates adenovirus injection. avGFP, control adenovirus expressing green fluorescent protein (GFP). avPer2, adenovirus expressing Per2. (c) Quantification of wheel-running activity of n=6 animals for each genotype. Lower panel shows quantification of data from ZT2 to ZT4 (yellow area in upper panel). (d) Corticosterone levels in plasma (n=4). All values are mean±s.e.m. One-way ANOVA with Tukey's multiple comparison test, *P<0.05, **P<0.01, ***P<0.001. ANOVA, analysis of variance.
Figure 3
Figure 3. RNA-sequencing analysis of L Per2−/− and control livers.
(a) Comparison of L Per2−/− (red) and control L Per2+/+(grey) mRNA under ad libitum (AL) and restricted feeding (RF) conditions. (b) Fourteen genes are different under AL and 2,271 genes under RF. Genes of fatty acid (black) and ketone body (blue) metabolism are indicated in the most right panel. (c) Quantitative PCR analysis of carnitin-palmitoyl transferase 1a (Cpt1a) and hydroxymethyl-glutaryl CoA synthase 2 (Hmgcs2) in liver tissue (n=6). Two-way ANOVA with Bonferroni post test. (d) Acetyl-CoA levels in liver extract (n=8). One-way ANOVA with Tukey's post test. (e) β-hydroxybutyrate (βOHB) levels (n=6). Two-way ANOVA with Bonferroni post test. (f) Transactivation assay in NIH 3T3 cells where Cpt1a::luc reporter was cotransfected with Pparα, Rxrα and increasing amount of Per2 expression vectors (n=3). One-way ANOVA with Bonferroni post test. (g) Real-time monitoring of a Cpt1a::luc over several days alone or together with expression vectors for Pparα, Rxrα and Per2. The line thickness represents the data from three experiments with three replicas each. All values are mean±s.e.m. *P<0.05, **P<0.01, ***P<0.001. ANOVA, analysis of variance.
Figure 4
Figure 4. Rescue of food anticipation in L Per2−/− mice by β-hydroxybutyrate.
(a) Timed release of βOHB (green) but not NaCl (white) or Na-Pyruvate (purple) in L Per2−/− mice mimics the βOHB levels in plasma of L Per2+/+ control animals (black). Measured after 15 days of infusion. (b) Western blot showing PER2 levels in the liver after application of NaCl and βOHB, respectively. (c) Acetyl-CoA levels in liver extracts of βOHB treated (green), NaCl-treated (white), Na-Pyruvate treated (purple), and control animals (black). (d) Corticosterone levels in plasma of βOHB treated (green), NaCl-treated (white), Na-Pyruvate treated (purple), and control animals (black). (e) Examples of double plotted activity and body temperature profiles of NaCl-treated, βOHB-treated, and Na-Pyruvate treated, L Per2−/− mice. Arrows indicate food access. (f) Left: quantification of the activity profile (n=4–6), yellow rectangle represents ZT2–4, 2 h prior to food access. Right: quantification of activity and body temperature, respectively, before food access (n=4–6). All values are mean±s.e.m. One-way ANOVA with Tukey's post test. *P<0.05, **P<0.01, ***P<0.001. ANOVA, analysis of variance.
Figure 5
Figure 5. Regulation of FAA by Per2.
Under RF conditions, liver Per2 modulates Cpt1a and Hmgcs2 expression, rate-limiting enzymes for βOHB synthesis. βOHB in the bloodstream reaches the brain and probably acts on hypothalamic nuclei and other brain cells. This activates the HPA-axis leading ultimately to food-anticipatory activity. The current study implies the necessity but not sufficiency of Per2 in liver for FAA. Ac-CoA, acetyl-coenzyme A; Cpt1a, carnitine palmitoyltransferase 1A; FAA, food-anticipatory activity; Hmgcs2, 3-hydroxy-3-methylglutaryl-CoA synthase 2; RF, restricted feeding; βOHB, β-hydroxybutyrate.

References

    1. Mohawk J. A., Green C. B. & Takahashi J. S. Central and peripheral circadian clocks in mammals. Annu. Rev. Neurosci. 35, 445–462 (2012). - PMC - PubMed
    1. Welsh D. K., Takahashi J. S. & Kay S. A. Suprachiasmatic nucleus: cell autonomy and network properties. Annu. Rev. Physiol. 72, 551–577 (2010). - PMC - PubMed
    1. Damiola F. et al. Restricted feeding uncouples circadian oscillators in peripheral tissues from the central pacemaker in the suprachiasmatic nucleus. Genes Dev. 14, 2950–2961 (2000). - PMC - PubMed
    1. Stokkan K. A., Yamazaki S., Tei H., Sakaki Y. & Menaker M. Entrainment of the circadian clock in the liver by feeding. Science 291, 490–493 (2001). - PubMed
    1. Krieger D. T. Food and water restriction shifts corticosterone, temperature, activity and brain amine periodicity. Endocrinology 95, 1195–1201 (1974). - PubMed

Publication types

MeSH terms

LinkOut - more resources