. 2016 Feb 3:7:10354.
doi: 10.1038/ncomms10354.

Integrin signalling regulates the expansion of neuroepithelial progenitors and neurogenesis via Wnt7a and Decorin

Affiliations

Integrin signalling regulates the expansion of neuroepithelial progenitors and neurogenesis via Wnt7a and Decorin

K Long et al. Nat Commun. .

Abstract

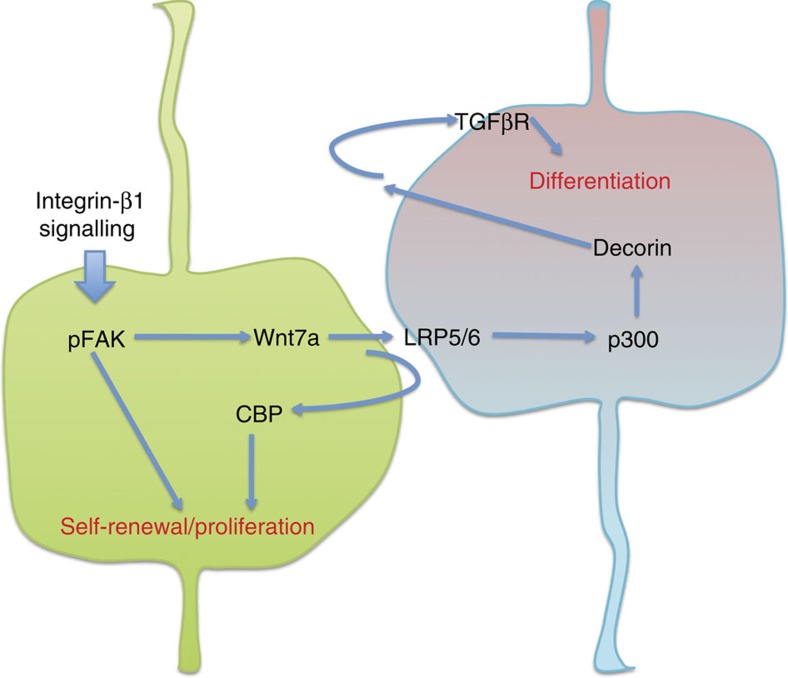
Development of the cerebral cortex requires regulation of proliferation and differentiation of neural stem cells and a diverse range of progenitors. Recent work suggests a role for extracellular matrix (ECM) and the major family of ECM receptors, the integrins. Here we show that enhancing integrin beta-1 signalling, by expressing a constitutively active integrin beta-1 (CA*β1) in the embryonic chick mesencephalon, enhances neurogenesis and increases the number of mitotic cells dividing away from the ventricular surface, analogous to sub-apical progenitors in mouse. Only non-integrin-expressing neighbouring cells (lacking CA*β1) contributed to the increased neurogenesis. Transcriptome analysis reveals upregulation of Wnt7a within the CA*β1 cells and upregulation of the ECM protein Decorin in the neighbouring non-expressing cells. Experiments using inhibitors in explant models and genetic knock-downs in vivo reveal an integrin-Wnt7a-Decorin pathway that promotes proliferation and differentiation of neuroepithelial cells, and identify Decorin as a novel neurogenic factor in the central nervous system.


Figures

Figure 1
Figure 1. Expression of CA*β1 expands the neuroepithelium.
(a) Immunostaining for GFP in E4 midbrain neuroepithelium electroporated with the empty vector, wild-type integrin β1 (itgβ1, hWTβ1), itgβ1 lacking the intracellular domain (ECβ1) or constitutively active integrin beta-1 (CA*β1). Scale bar, 20 μm. (b) Quantification of the number of nuclei per field. n>19. (c) Quantification of the thickness of the neuroepithelium. n>13. All graphs: mean and s.d. **P<0.01, one-way analysis of variance.
Figure 2
Figure 2. Expression of CA*β1 expands the progenitor pool and increases sub-apical divisions.
(a) Immunostaining for PH3 in E2.5 and E4 midbrain neuroepithelium electroporated with hWTβ1 or CA*β1. Dashed white line labels the apical area defined as two or three cell diameters above the ventricular surface. Note the increase in dividing cells above (basal to) the dotted line in the CA*β1-expressing neuroepithelium. Scale bar, 20 μm. (b) Quantification of the number of PH3+ cells. n>4. (c) Quantification of the location of PH3+ cells at E2.5. n>5. (d) Quantification of the location of PH3+ cells at E4. n>5. Scale bar, 20 μm. All graphs: mean and s.d., *P<0.05, ***P<0.001, one-way analysis of variance.
Figure 3
Figure 3. Live imaging of CA*β1-expressing neuroepithelium shows normal inter-kinetic nuclear migration and process extension alongside sub-apically dividing cells.
All panels show images taken from the live time-lapse imaging of the hWTβ1- or CA*β1-expressing neuroepithelium, imaged 24–48 h after electroporation, with cells visualized using cytoplasmic GFP fluorescence. The apical surface is always at the bottom of the image, basal at the top. Filled arrowheads: cell bodies; arrows: cell processes; blue dashed line: basal surface; dashed circles: dividing cells. 0:00 (h:mm) donates the time of the first image. (a) CA*β1-expressing cells dividing sub-apically produce daughter cells that re-extend an apical process. (b) CA*β1-expressing cells dividing apically produce daughter cells that re-extend a basal process. (c) Apical and sub-apical divisions of CA*β1-expressing cells occur simultaneously within the neuroepithelium. (d) Normal inter-kinetic nuclear migration (INM) occurs within the hWTβ1-expressing neuroepithelium.Scale bars, 20 μm.
Figure 4
Figure 4. CA*β1 increases neurogenesis in a non-cell autonomous manner.
(a) Immunostaining for GFP and Tuj1 in E4 midbrain neuroepithelium electroporated with hWTβ1 or CA*β1. Note the increase in Tuj1+ (red) neurons with CA*β1 expression. Scale bar, 20 μm. (b) Quantification of the number of Tuj1+ cells per field. n>19 (c) Immunostaining of Tuj1 and GFP in the CA*β1 image in a showing channels split and merged. Scale bar, 20 μm. Filled yellow arrowheads label Tuj1+ GFP cell bodies. (d) Immunostaining of GFP, CldU and PCNA staining in midbrain neuroepithelium electroporated with CA*β1 and GFPnls, treated with CldU 12 h before fixation. Filled yellow arrowheads label GFP+CldU+PCNA+ cells. Outlined yellow arrowheads label GFPCldU+PCNA cells. (e) Quantification of GFP+CldU+PCNA+ cells at E3. n>5. (f) Quantification of CldU+PCNA cells at E3. n>5. All graphs: mean and s.d., *P<0.05, **P<0.01, ***P<0.001, one-way analysis of variance.
Figure 5
Figure 5. Transcriptome analysis of CA*β1-positive and -negative cells reveals a role for Wnt signalling.
(a) Heat map showing fold change of gene expression between the CA*β1/GFP+ versus CA*β1/GFP cells. (b) Validation of transcriptome results via quantitative PCR. Genes highlighted in red are the genes of interest. (c) Immunostaining for GFP and Decorin (DCN) in E4 midbrain neuroepithelium electroporated with hWTβ1 or CA*β1. Scale bar, 20 μm. (d) Immunostaining for GFP and Wnt7a in E4 midbrain neuroepithelium electroporated with hWTβ1 or CA*β1. Scale bar, 20 μm.
Figure 6
Figure 6. Wnt7a and Decorin promote neurogenesis.
(a) Immunostaining for Tuj1 in explants—a non-electroporated control, one expressing CA*β1 and non-electroporated explants with recombinant Wnt7a or Decorin (DCN) added. Scale bar, 50 μm. (b) Quantification of the number of Tuj1+ cell bodies in explants electroporated with the different itgβ1 constructs. n>7. (c) Quantification of the number of Tuj1+ cell bodies in non-electroporated explants with recombinant Wnt7a or DCN added. n>5. All graphs: mean and s.d., *P<0.05, **P<0.01, one-way analysis of variance.
Figure 7
Figure 7. Genetic knockdown of Wnt7a and Decorin blocks CA*β1-mediated neurogenesis.
(a) Immunostaining for fluorescein to show uptake of the morpholinos (MO) in a control E4 midbrain neuroepithelium electroporated with the DCN-MO, DCN-MM, Wnt7a-MO or Wnt7a-MM morpholinos. (b,c) Quantification of Decorin and Wnt7a staining intensity in E4 midbrain neuroepithelium after electroporation of morpholinos. n>3. (d) Illustration by immunohistochemistry for fluorescein, RFPnls and Tuj1 in E4 midbrain neuroepithelium co-electroporated with CA*β1 and a morpholino (either DCN-MO, DCN-MM, Wnt7a-MO or Wnt7a-MM). (e) Quantification of the number of Tuj1+ cells in E4 midbrain neuroepithelium electroporated only with the morpholinos. Note the loss of neurogenesis with the Wnt7a-MO. n>5. (f) Quantification of the number of Tuj1+ cells in E4 midbrain neuroepithelium co-electroporated with CA*β1 and a morpholino. Note the loss of the significant increase in neurogenesis resulting from CA*β1 expression with both the Wnt7a-MO and the DCN-MO. n>8. (g) Quantification of the thickness of the neuroepithelium in E4 midbrain neuroepithelium co-electroporated with CA*β1 and a morpholino. n>4. Scale bars, 20 μm. All graphs: mean and s.d., *P<0.05, **P<0.01, ***P<0.001, one-way analysis of variance.
Figure 8
Figure 8. Pharmacological inhibition of integrin, Wnt7a and Decorin activity in explants.
(a) Immunostaining for Tuj1 in explants expressing CA*β1 alone or treated with Wnt inhibitors C-59, Dkk-1, IQ-1, DCN-blocking antibody CB-1, TGF-βR inhibitor or FAK inhibitor. Scale bar, 50 μm. (b) Quantification of the number of Tuj1+ cells in explants expressing CA*β1 alone or treated with the inhibitors. Note that all the inhibitors prevent the significant increase in neurogenesis resulting from CA*β1 expression. n>4. (c) Immunostaining for Tuj1 in non-electroporated explants alone and with the addition of Chiron. (d) Quantification of the number of Tuj1+ cells in explants treated with Chiron. n>4. (e) Immunostaining for GFP and Tuj1 in an explant expressing CA*β1 treated with a FAK inhibitor. White box outlines the area of the image in e'. Scale bar, 50 μm. (e') Enlarged area of e, white filled arrowheads label GFP+Tuj1+ cell bodies. (f) Quantification of GFP+Tuj1+ cells in explants expressing CA*β1 and treated with inhibitors. n>5. Mean and s.d. *P<0.05. n>4, one-way analysis of variance.
Figure 9
Figure 9. Model of the integrin-β1–Wnt7a–Decorin pathway.
Schematic showing the proposed model of integrin-β1–Wnt7a–Decorin signalling pathway. The green cell represents the CA*β1-expressing cell, which undergoes proliferation and self-renewal with upregulation of Wnt7a. Wnt7a is secreted, promoting Wnt7a signalling within the CA*β1-expressing cell via the CBP branch of the Wnt pathway, leading to proliferation and self-renewal. Wnt7a also acts on the neighbouring, negative cell (blue/red cell) via the LRP5/6 receptor, signalling via the p300 branch of the Wnt pathway. This leads to the upregulation of Decorin expression. Decorin is secreted and acts in an autocrine manner on the negative cell via the TGF-β receptor, promoting differentiation.

Similar articles

Cited by

References

    1. Aguirre A., Rubio M. E. & Gallo V. Notch and EGFR pathway interaction regulates neural stem cell number and self-renewal. Nature 467, 323–327 (2010). - PMC - PubMed
    1. Dave R. K. et al.. Sonic hedgehog and notch signaling can cooperate to regulate neurogenic divisions of neocortical progenitors. PLoS ONE 6, e14680 (2011). - PMC - PubMed
    1. Hirabayashi Y. et al.. The Wnt/beta-catenin pathway directs neuronal differentiation of cortical neural precursor cells. Development 131, 2791–2801 (2004). - PubMed
    1. Rowitch D. H. et al.. Sonic hedgehog regulates proliferation and inhibits differentiation of CNS precursor cells. J. Neurosci. 19, 8954–8965 (1999). - PMC - PubMed
    1. Rash B. G., Lim H. D., Breunig J. J. & Vaccarino F. M. FGF signaling expands embryonic cortical surface area by regulating Notch-dependent neurogenesis. J. Neurosci. 31, 15604–15617 (2011). - PMC - PubMed

MeSH terms