. 2016 Apr;26(4):1804-17.
doi: 10.1093/cercor/bhw007. Epub 2016 Feb 2.

NgR1: A Tunable Sensor Regulating Memory Formation, Synaptic, and Dendritic Plasticity

Affiliations

NgR1: A Tunable Sensor Regulating Memory Formation, Synaptic, and Dendritic Plasticity

Tobias E Karlsson et al. Cereb Cortex. 2016 Apr.

Abstract

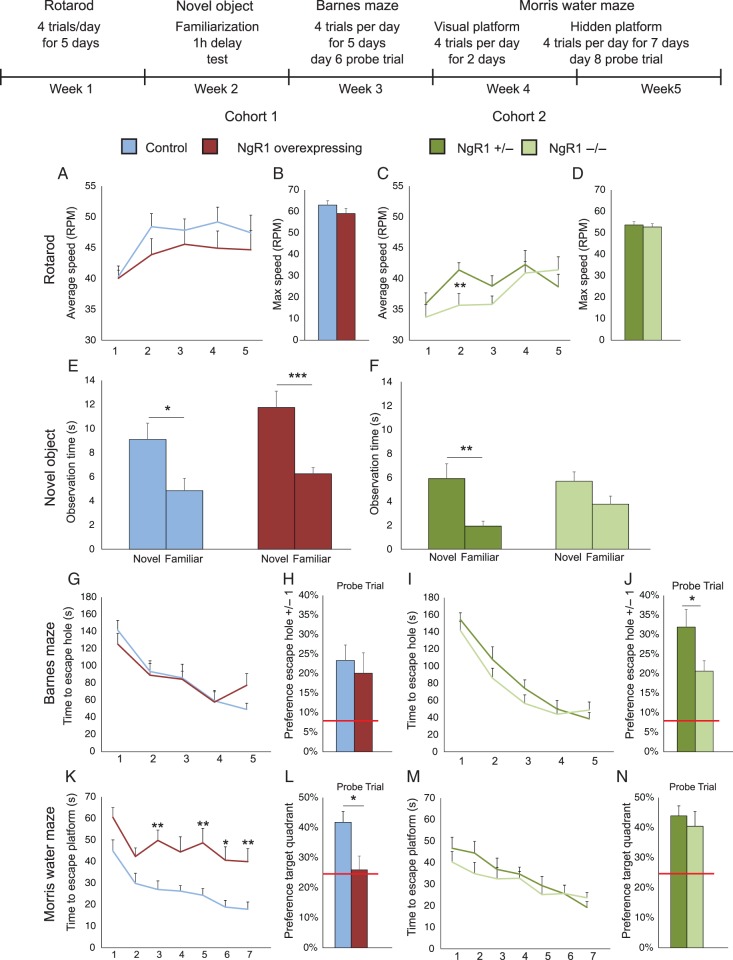
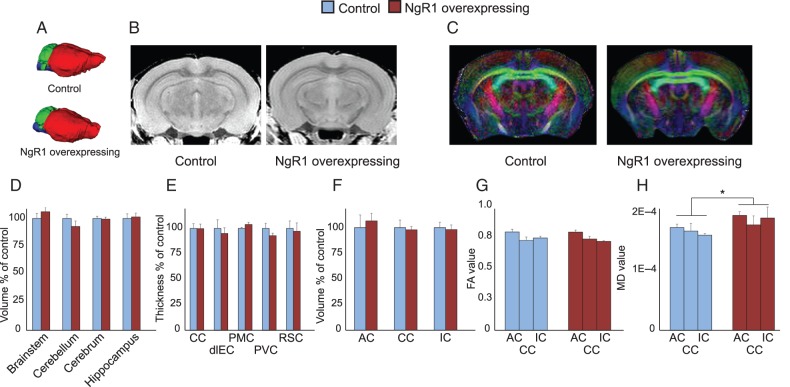
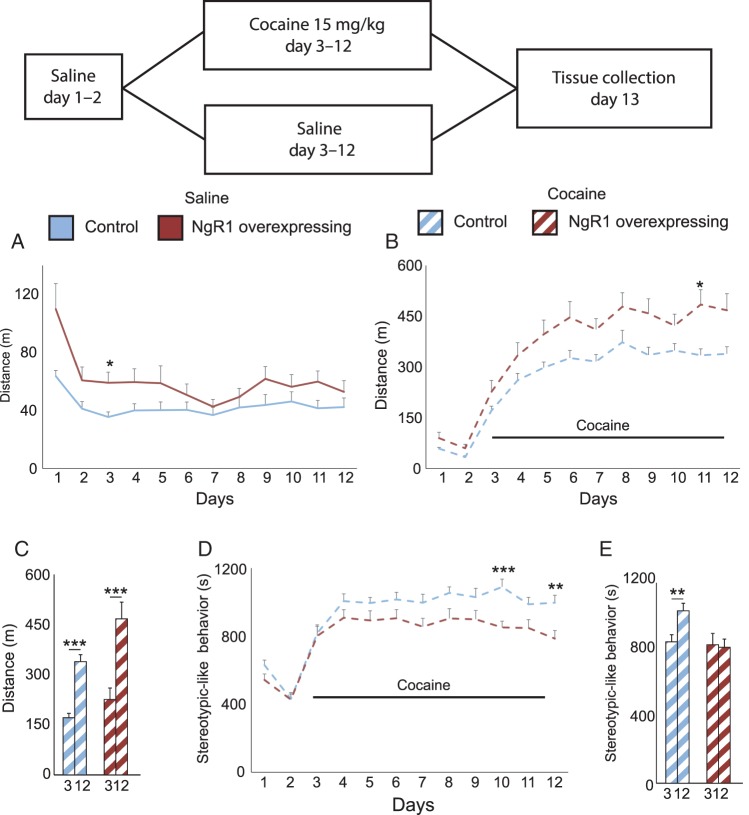
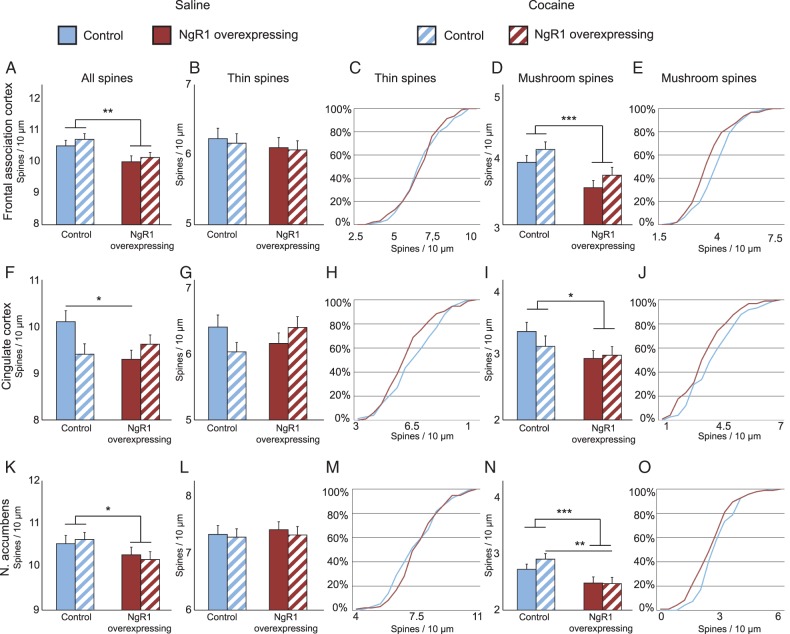
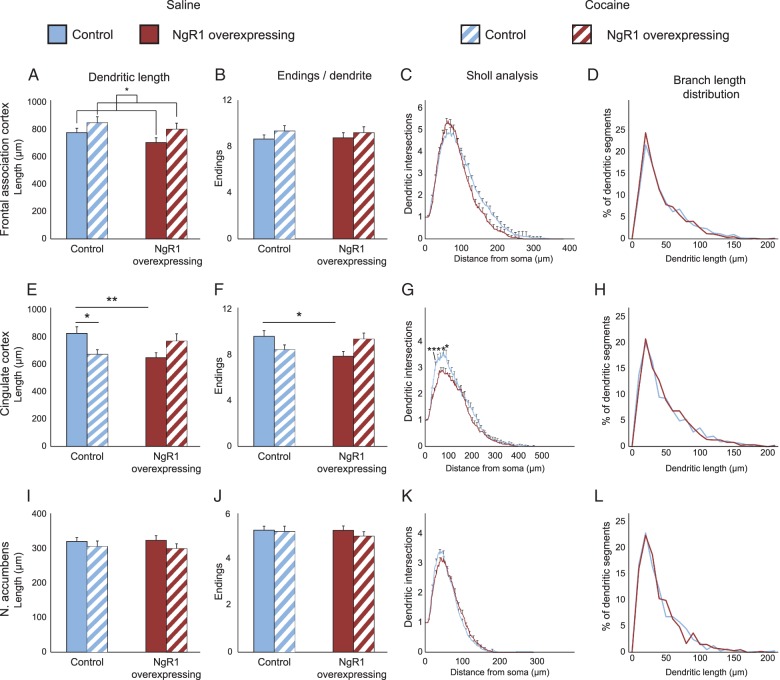
Nogo receptor 1 (NgR1) is expressed in forebrain neurons and mediates nerve growth inhibition in response to Nogo and other ligands. Neuronal activity downregulates NgR1 and the inability to downregulate NgR1 impairs long-term memory. We investigated behavior in a serial behavioral paradigm in mice that overexpress or lack NgR1, finding impaired locomotor behavior and recognition memory in mice lacking NgR1 and impaired sequential spatial learning in NgR1 overexpressing mice. We also investigated a role for NgR1 in drug-mediated sensitization and found that repeated cocaine exposure caused stronger locomotor responses but limited development of stereotypies in NgR1 overexpressing mice. This suggests that NgR1-regulated synaptic plasticity is needed to develop stereotypies. Ex vivo magnetic resonance imaging and diffusion tensor imaging analyses of NgR1 overexpressing brains did not reveal any major alterations. NgR1 overexpression resulted in significantly reduced density of mature spines and dendritic complexity. NgR1 overexpression also altered cocaine-induced effects on spine plasticity. Our results show that NgR1 is a negative regulator of both structural synaptic plasticity and dendritic complexity in a brain region-specific manner, and highlight anterior cingulate cortex as a key area for memory-related plasticity.

Keywords: NgR1; cocaine sensitization; dendritic structure; spatial memory; spine plasticity.


Figures

Figure 1.
Figure 1.
Overexpression of NgR1 impairs sequential spatial learning, lack of NgR1 impairs locomotion and novel object recognition. This compound figure presents 2 separate studies, one in which NgR1 overexpressing mice were compared with litter mate controls, and a second study in which NgR1−/− mice were compared with littermate NgR+/− mice. Statistical comparisons are only made within, not between groups. At the top is shown a time line of the tests and the experimental steps of each test (A,C) Performance during 5 days (4 trials per day) of Rotarod training. (B,D) Average of the maximal speeds achieved by mice in the corresponding groups. (E,F) Novel object recognition, shown as time spent looking at a novel, compared with a familiar object. (G,I) Learning performance during 5 days of training in Barnes maze with 4 trials per day. (H,J) Probe trials performed 1 day after the training period. (K,M) Performance during 7 days of training in Morris water maze. (L,N) Probe trials of the same groups in Morris water maze carried out 1 day after the last training session. Red bars in (H,J,L,N) indicate chance levels of performance. *P < 0.05, **P < 0.01, ***P ≤ 0.001.
Figure 2.
Figure 2.
Gross brain neuroanatomy is not affected by NgR1 overexpression. Ex vivo MRI analysis of brain parameters. (A) 3D representation of brain structures of control and NgR1 overexpressing mice. Forebrain (red), cerebellum (green), and brain stem (blue). (B) Representative T2 images used for measurement of cortical thickness. (C) Representative DTI images, used for white matter analysis. (D) Volumes of 4 major brain regions in NgR1 overexpressing mice compared with controls. (E) Thickness of 5 cortical areas in NgR1 overexpressing mice compared with controls. CC, cingulate cortex; dlEC, dorsolateral entorhinal cortex; PMC, premotor cortex; PVC, primary visual cortex; RSC, retrosplenial cortex (F) Volumes of 3 white matter tracts in NgR1 overexpressing mice compared with controls; AC, anterior commissure; CC, corpus callosum; IC, internal capsule. (G) Fractional anisotropy and (H) mean diffusivity of the same white matter areas as shown in (F). *P < 0.05.
Figure 3.
Figure 3.
Excess NgR1 potentiates cocaine sensitivity while limiting the development of stereotypies. At the top is shown a time line for the test and information about treatments of the 2 groups. Locomotion of control and NgR1 overexpressing mice was monitored during (A) 12 days of saline injections or (B) 2 days of saline injections, followed by 10 days of cocaine injections. (C) Locomotion responses of control and NgR1 overexpressing mice to the first (day 3) and the last day (day 12) of cocaine. (D) The amount of time spent performing stereotypy-like behavior. (E) The amount of stereotypy-like behavior after the first and the last cocaine dose. *P < 0.05, **P < 0.01, ***P < 0.001.
Figure 4.
Figure 4.
NgR1 limits the number of mature mushroom spines in vivo; cocaine affects control and NgR1 overexpressing mice differently. Density of all spines (A,F,K), thin spines (B,G,L), and mushroom spines (D,I,N) in 3 brain areas from control and NgR1 overexpressing mice 24 h after last treatment with saline or cocaine. Frequency distribution charts for thin (C,H,M) and mushroom spines (E,J,O) (n > 60 neurons per group from 12 mice per group). Significances between groups with Bonferroni correction: *P < 0.05, **P < 0.01, ***P < 0.001.
Figure 5.
Figure 5.
Dendritic length, number of branch points, and complexity are limited by NgR1. Same groups as in Figure 4. (A,E,I) Total length of dendrites of neurons used to analyze dendritic spines in 3 brain areas of control and NgR1 overexpressing mice treated with saline or saline followed by cocaine. (B,F,J) Number of dendritic endings per analyzed dendrite in the same 4 groups. (C,G,K) Sholl analysis of dendrite complexity with respect to distance from cell body. (D,H,L) Frequency distribution of different dendritic lengths. Significance between groups with Bonferroni correction: *P < 0.05, **P < 0.01.

References

    1. Akbik F, Bhagat S, Patel P, Cafferty W, Strittmatter S. 2013. Anatomical plasticity of adult brain is titrated by Nogo Receptor 1. Neuron. 77:859–866. - PMC - PubMed
    1. Aron JL, Paulus MP. 2007. Location, location: using functional magnetic resonance imaging to pinpoint brain differences relevant to stimulant use. Addiction. 102(Suppl 1):33–43. - PubMed
    1. Barnes CA. 1979. Memory deficits associated with senescence: a neurophysiological and behavioral study in the rat. J Comp Physiol Psychol. 93:74–104. - PubMed
    1. Barrette B, Vallieres N, Dube M, Lacroix S. 2007. Expression profile of receptors for myelin-associated inhibitors of axonal regeneration in the intact and injured mouse central nervous system. Mol Cell Neurosci. 34:519–538. - PubMed
    1. Budel S, Padukkavidana T, Liu B, Feng Z, Hu F, Johnson S, Lauren J, Park J, McGee A, Liao J et al. . 2008. Genetic variants of Nogo-66 receptor with possible association to schizophrenia block myelin inhibition of axon growth. J Neurosci. 28:13161–13172. - PMC - PubMed

Publication types

MeSH terms