. 2016 Apr 1;118(7):1078-90.
doi: 10.1161/CIRCRESAHA.115.308141. Epub 2016 Feb 2.

Functional Tuning of Intrinsic Endothelial Ca2+ Dynamics in Swine Coronary Arteries

Affiliations

Functional Tuning of Intrinsic Endothelial Ca2+ Dynamics in Swine Coronary Arteries

Michael Francis et al. Circ Res. .

Abstract

Rationale: Recent data from mesenteric and cerebral beds have revealed spatially restricted Ca(2+) transients occurring along the vascular intima that control effector recruitment and vasodilation. Although Ca(2+) is pivotal for coronary artery endothelial function, spatial and temporal regulation of functional Ca(2+) signals in the coronary endothelium is poorly understood.

Objective: We aimed to determine whether a discrete spatial and temporal profile of Ca(2+) dynamics underlies endothelium-dependent relaxation of swine coronary arteries.

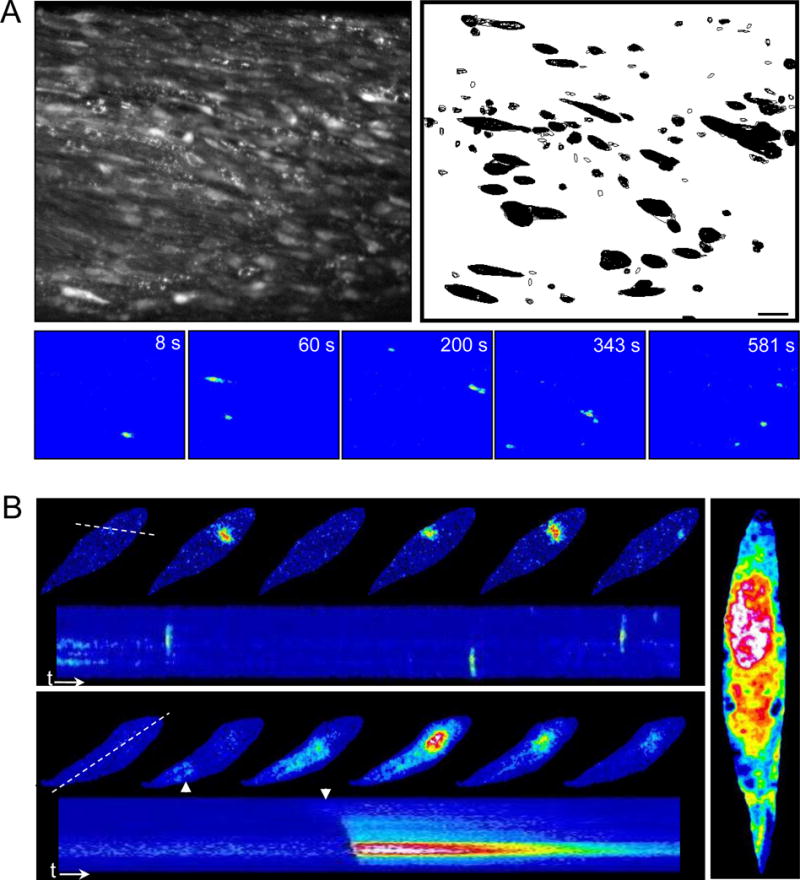
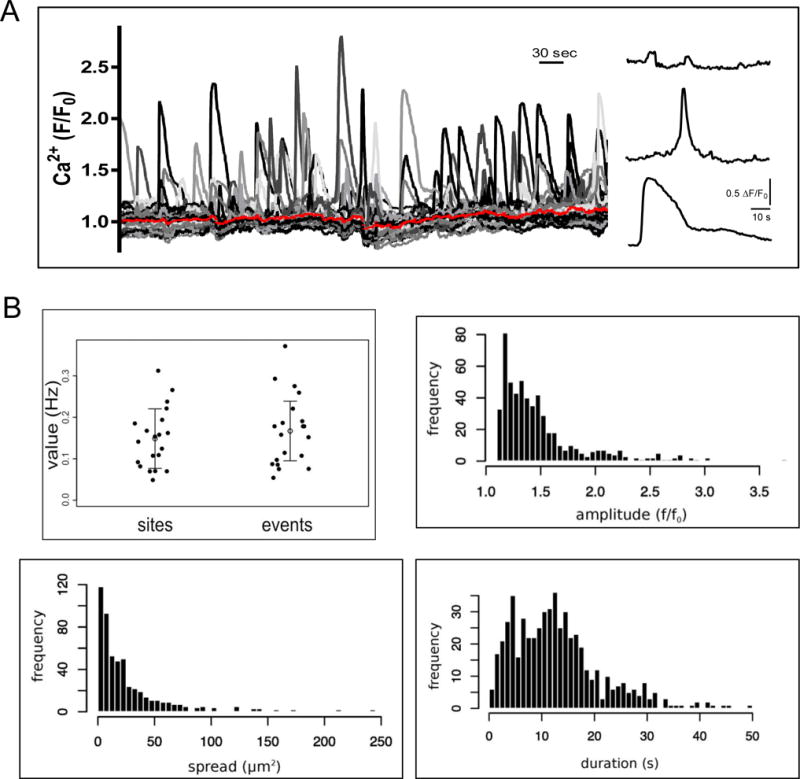
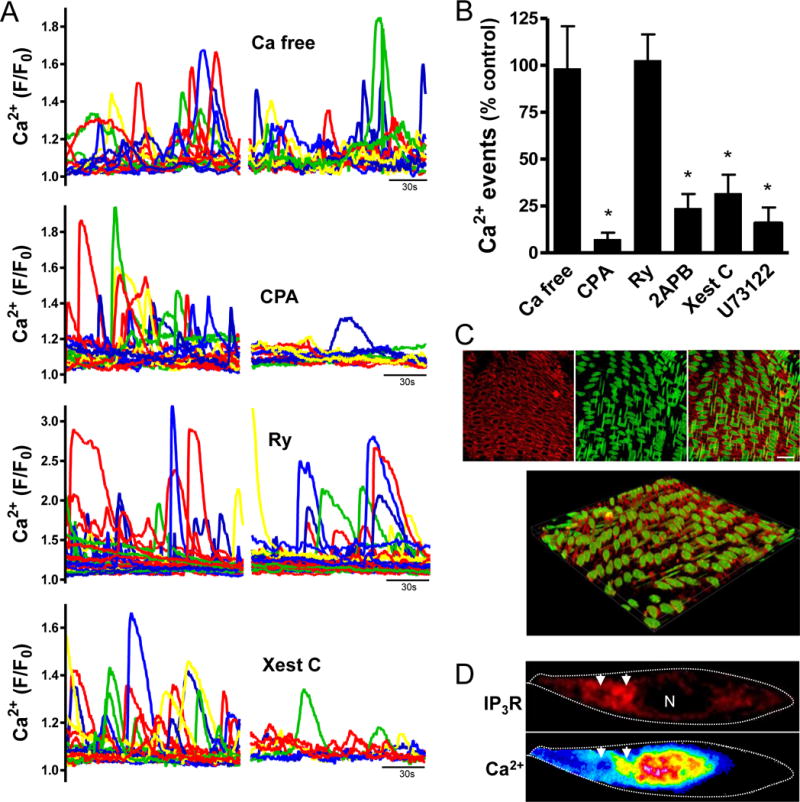
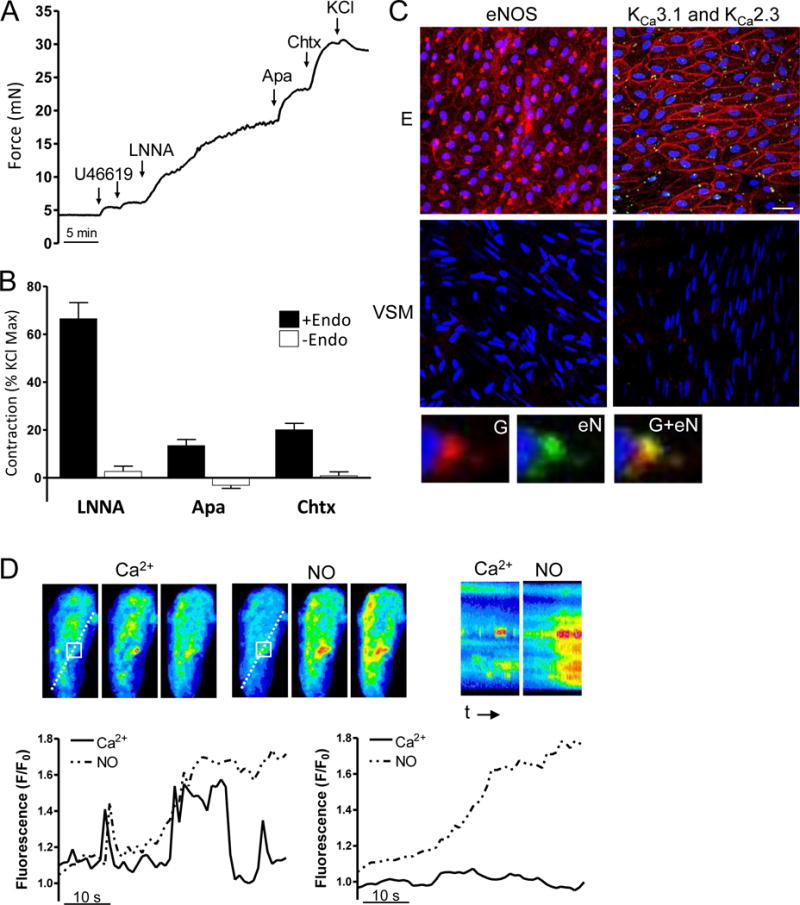
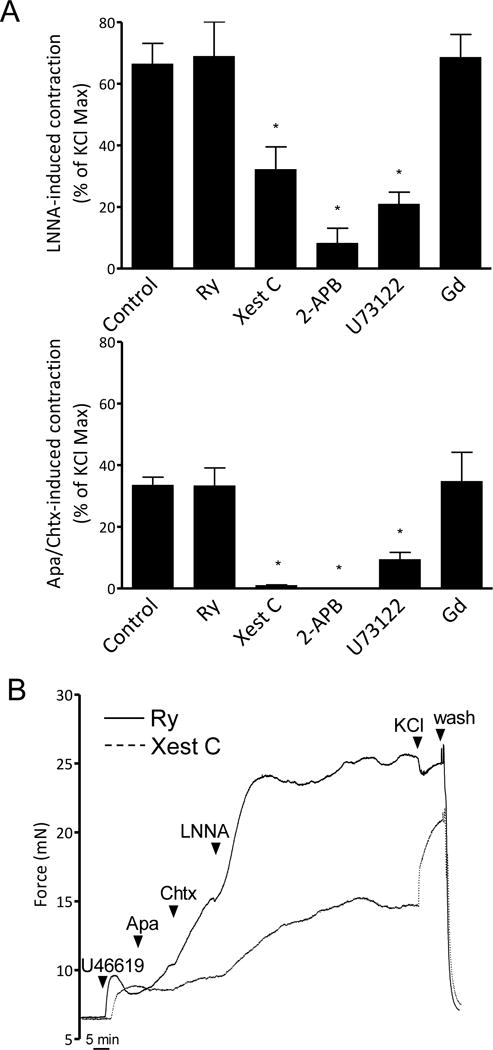
Methods and results: Using confocal imaging, custom automated image analysis, and myography, we show that the swine coronary artery endothelium generates discrete basal Ca(2+) dynamics, including isolated transients and whole-cell propagating waves. These events are suppressed by depletion of internal stores or inhibition of inositol 1,4,5-trisphosphate receptors but not by inhibition of ryanodine receptors or removal of extracellular Ca(2+). In vessel rings, inhibition of specific Ca(2+)-dependent endothelial effectors, namely, small and intermediate conductance K(+) channels (K(Ca)3.1 and K(Ca)2.3) and endothelial nitric oxide synthase, produces additive tone, which is blunted by internal store depletion or inositol 1,4,5-trisphosphate receptor blockade. Stimulation of endothelial inositol 1,4,5-trisphosphate-dependent signaling with substance P causes idiosyncratic changes in dynamic Ca(2+) signal parameters (active sites, event frequency, amplitude, duration, and spatial spread). Overall, substance P-induced vasorelaxation corresponded poorly with whole-field endothelial Ca(2+) measurements but corresponded precisely with the concentration-dependent change in Ca(2+) dynamics (linearly translated composite of dynamic parameters).

Conclusions: Our findings show that endothelium-dependent control of swine coronary artery tone is determined by spatial and temporal titration of inherent endothelial Ca(2+) dynamics that are not represented by tissue-level averaged Ca(2+) changes.

Keywords: calcium signaling; coronary vessels; myography; potassium channels; substance P.


Figures

Figure 1
Figure 1. Basal dynamic Ca2+ events in swine coronary artery endothelium
A, Ca2+-dependent fluorescence recorded from the intimal surface of opened Fluo-4 AM loaded artery segments (Bar = 20 μm). The gray-scale image (left) shows an average-intensity projection over a 10-minute confocal recording. Regions of Ca2+ change over the full recording were autodetected by the custom software LC_Pro and displayed as a binary mask (Right; Ca2+ events in black). Individual events occurring over the time course are shown below. B, Time course (intensity dependent pseudocolor) of typical basal Ca2+ events, including localized transients (top) and a cellular wave (bottom). For each, embedded pseudo-line scan analysis shows continual time course along the dotted line. Arrows indicate initiation of the wave event. Right panel shows a maximal intensity projection of Ca2+ (over 30 seconds) in a cell exhibiting both localized events and waves.
Figure 2
Figure 2. Quantification of basal endothelial Ca2+ signals
A, Recording shows Ca2+ signals autodetected during the 10-minute sample shown in Fig 1A (red line depicts average signal over the field). Insets show three disparate basal Ca2+ events. B, Histograms summarizing basal Ca2+ event parameters. Data were acquired from 8 animals.
Figure 3
Figure 3. Dependence of basal endothelial Ca2+ events on endoplasmic reticulum IP3 receptors (IP3Rs)
A, Recordings show endothelial Ca2+ signals recorded in opened coronary arteries before and after the perturbations or drug additions indicated (15 minute pretreatment). B, Bar graph summarizes net change in the occurrence of Ca2+ events after the indicated treatments CPA, cyclopiazonic acid; Ry, ryanodine; Xest C, xestospongion C; n=4–5, *p<0.01 versus Ca2+ free). C, Immunostaining for IP3R (red) shows distinct clustering around endothelial cell nuclei and down the cell axis; nuclei (green). Bar = 20 μm. Volume render of merged 10-μm image z-stack (below). D, Evaluation of IP3R expression and Ca2+ within a selected cell following a basal Ca2+ wave. Arrows indicate spatial correspondence of high and low Ca2+ signals with relative IP3R density; N, nucleus.
Figure 4
Figure 4. Contribution of eNOS, KCa2.3, and KCa3.1 channels to persistent endothelial modulation of coronary artery tone
A, The representative myograph recording shows successive contractions of isolated coronary artery rings solicited by serial additions of LNNA (200 μmol/L), apamin (Apa; 0.5 μmol/L) and charybdotoxin (Chtx; 0.1 μmol/L). Net contraction was not further enhanced by 60 mmol/L KCl. For all vessel studied, low concentrations of U46619 (1 – 10 nmol/L) were used to standardize resting tone at 7 mN. B, Summary of LNNA, Apa, and Chtx contractions in the presence (+Endo) or absence (−Endo) of endothelium (n=20 and 11). C, Immunostaining for eNOS (red, left) or KCa3.1 (green, right) and KCa2.3 (red, right) channels in open swine coronary artery (bar = 20 μm). Nuclei are stained blue. Positive staining was detected in the endothelium (E) but not underlying smooth muscle (VSM). Inset (bottom) shows co-labeling of Golgi apparatus (G; red) and eNOS (eN; green) in densities near the nucleus (blue). D, Tracking both Ca2+ (Fluo-4 AM) and NO (DAR-4M AM) in an endothelial cell shows the spatial and temporal relationship between basally occurring Ca2+ events and NO production (both in pseudocolor). Dotted line shows position of pseudo-line scan (lower left) and white squares indicate the cell region sampled in the associated recording (lower left). Corresponding recordings of whole-cell Ca2+ and NO signals are shown on the right.
Figure 5
Figure 5. Role of IP3 signaling in eNOS and KCa channel dependent modulation of coronary artery tone
A, Bar graphs show the impact of various pretreatments (15 min) on LNNA (left) or Apa and Chtx-induced (right) contractions. Pretreatments included the RyR inhibitor ryanodine (Ry, 10 μmol/L), IP3R blockers xestospongin C (Xesto, 30 μmol/L) and 2-APB (100 μmol/L), the PLC inhibitor U73122 (10 μmol/L) and the nonselective cation channel inhibitor Gd3+ (100 μmol/L); n = 5–7, * indicates p<0.05. B, Representative myograph recordings show differential impacts of ryanodine and xestospongin C pretreatments on Apa, Chtx and LNNA contractions.
Figure 6
Figure 6. Effects of endothelial agonist substance P on arterial tone and endothelial Ca2+ signaling
A, Representative myograph recordings show concentration-dependent substance P (SP) relaxations and impaired relaxations in arteries pretreated with U73122 or the combination of LNNA, Apa and Chtx. All arteries were pre-contracted to 50–70% of maximal tone with U46619 (10–100 nmol/L). B, Representative recordings of Ca2+-dependent fluorescence in open coronary artery preparations show impacts of increasing concentrations of SP on discrete Ca2+ dynamics. Red lines indicate Ca2+ levels over the whole sampled fields. Insets (right) show cumulative masks of active Ca2+ sites (black) before and after SP addition (180 sec each).
Figure 7
Figure 7. Summary of concentration-dependent substance P (SP)-induced changes in endothelial Ca2+ event parameters
Data represent cumulative assessment of five experiments per SP concentration. * indicates p< 0.05 vs. 10−13 μmol/L; # indicates p< 0.05 vs. 10−13 μmol/L for events.
Figure 8
Figure 8. Correspondence of substance P (SP) relaxation with endothelial Ca2+ dynamics
A, Left: Changes in individual dynamic Ca2+ parameters (black lines) are plotted as a function of SP concentration (symbols are mean values). Also plotted is the mean whole-field Ca2+ change within the same sampled fields (red line). Right: Ca2+ dynamics are combined into one curve representing the average of all parameters at each SP concentration. B, Curves show Ca2+ dynamics and whole field Ca2+ (same data in A) expressed as percent max and plotted alongside concentration-dependent SP arterial relaxation (n=5–6 for each concentration).

Comment in

References

    1. Drexler H, Zeiher AM. Endothelial function in human coronary arteries in vivo. Focus on hypercholesterolemia. Hypertension. 1991;18:II90–II99. - PubMed
    1. Konidala S, Gutterman DD. Coronary vasospasm and the regulation of coronary blood flow. Prog Cardiovasc Dis. 2004;46:349–373. - PubMed
    1. Reyes-Soffer G, Holleran S, Di Tullio MR, Homma S, Boden-Albala B, Ramakrishnan R, Elkind MS, Sacco RL, Ginsberg HN. Endothelial function in individuals with coronary artery disease with and without type 2 diabetes mellitus. Metabolism. 2010;59:1365–1371. - PMC - PubMed
    1. Sitia S, Tomasoni L, Atzeni F, Ambrosio G, Cordiano C, Catapano A, Tramontana S, Perticone F, Naccarato P, Camici P, Picano E, Cortigiani L, Bevilacqua M, Milazzo L, Cusi D, Barlassina C, Sarzi-Puttini P, Turiel M. From endothelial dysfunction to atherosclerosis. Autoimmun Rev. 2010;9:830–834. - PubMed
    1. Kawano H, Ogawa H. Endothelial dysfunction and coronary artery spasm. Curr Drug Targets Cardiovasc Haematol Disord. 2004;4:23–33. - PubMed

Publication types

MeSH terms

Substances