

Trans-ethnic study design approaches for fine-mapping
- PMID: 26839038
- PMCID: PMC4856879
- DOI: 10.1038/ejhg.2016.1
Trans-ethnic study design approaches for fine-mapping
Abstract
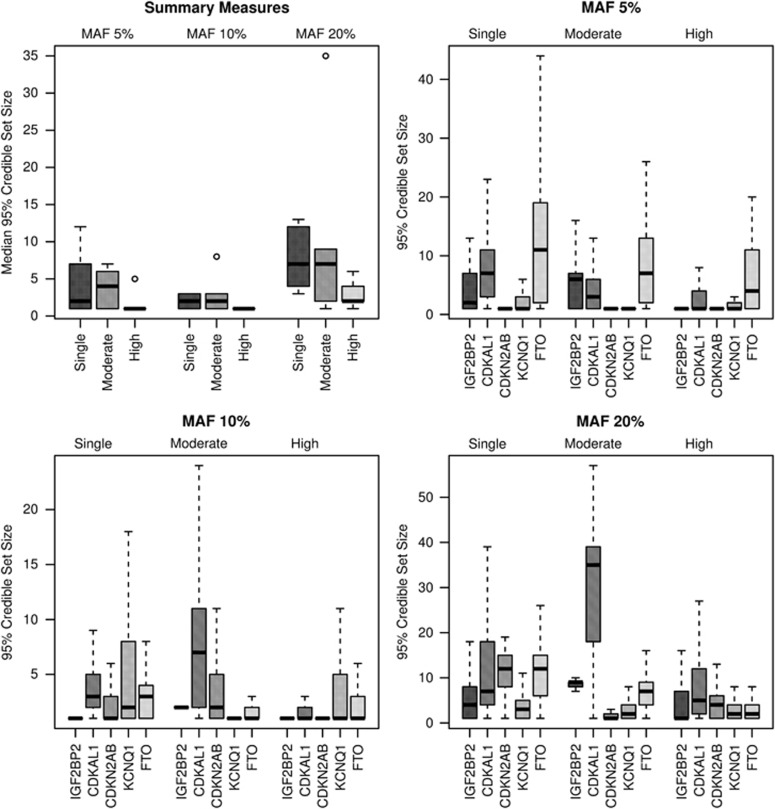
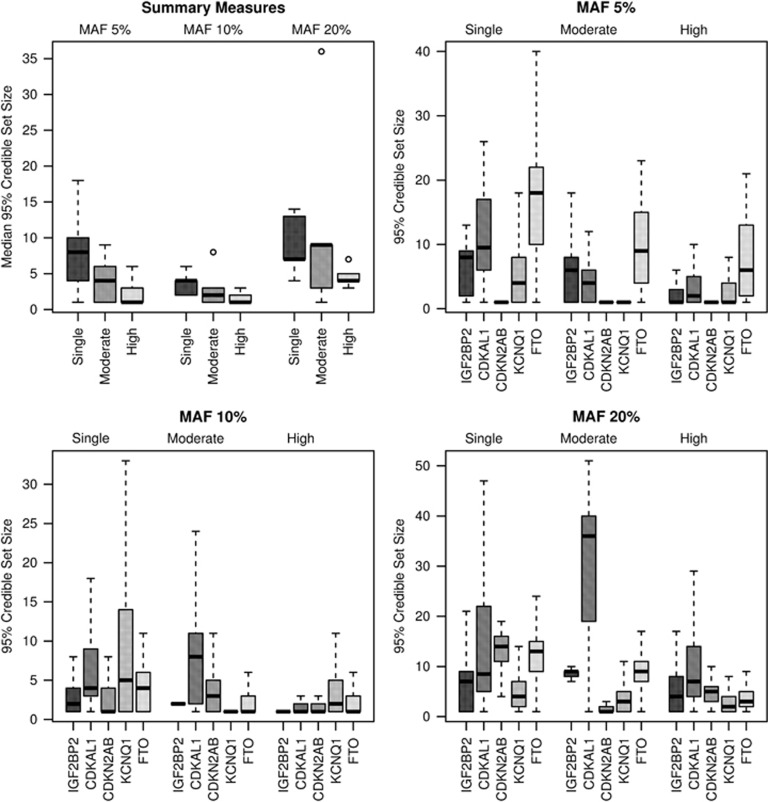
Studies that traverse ancestrally diverse populations may increase power to detect novel loci and improve fine-mapping resolution of causal variants by leveraging linkage disequilibrium differences between ethnic groups. The inclusion of African ancestry samples may yield further improvements because of low linkage disequilibrium and high genetic heterogeneity. We investigate the fine-mapping resolution of trans-ethnic fixed-effects meta-analysis for five type II diabetes loci, under various settings of ancestral composition (European, East Asian, African), allelic heterogeneity, and causal variant minor allele frequency. In particular, three settings of ancestral composition were compared: (1) single ancestry (European), (2) moderate ancestral diversity (European and East Asian), and (3) high ancestral diversity (European, East Asian, and African). Our simulations suggest that the European/Asian and European ancestry-only meta-analyses consistently attain similar fine-mapping resolution. The inclusion of African ancestry samples in the meta-analysis leads to a marked improvement in fine-mapping resolution.
Figures
References
-
- DIAbetes Genetics Replication And Meta-analysis (DIAGRAM) Consortium, Asian Genetic Epidemiology Network Type 2 Diabetes (AGEN-T2D) Consortium, South Asian Type 2 Diabetes (SAT2D) Consortium: Genome-wide trans-ancestry meta-analysis provides insight into the genetic architecture of type 2 diabetes susceptibility. Nat Genet 2014; 46: 234–244. - PMC - PubMed
MeSH terms
Grants and funding
LinkOut - more resources
Full Text Sources
Other Literature Sources
