. 2016 Feb 3:7:10594.
doi: 10.1038/ncomms10594.

Emerging roles of ARHGAP33 in intracellular trafficking of TrkB and pathophysiology of neuropsychiatric disorders

Affiliations

Emerging roles of ARHGAP33 in intracellular trafficking of TrkB and pathophysiology of neuropsychiatric disorders

Takanobu Nakazawa et al. Nat Commun. .

Erratum in

Abstract

Intracellular trafficking of receptor proteins is essential for neurons to detect various extracellular factors during the formation and refinement of neural circuits. However, the precise mechanisms underlying the trafficking of neurotrophin receptors to synapses remain elusive. Here, we demonstrate that a brain-enriched sorting nexin, ARHGAP33, is a new type of regulator for the intracellular trafficking of TrkB, a high-affinity receptor for brain-derived neurotrophic factor. ARHGAP33 knockout (KO) mice exhibit reduced expression of synaptic TrkB, impaired spine development and neuropsychiatric disorder-related behavioural abnormalities. These deficits are rescued by specific pharmacological enhancement of TrkB signalling in ARHGAP33 KO mice. Mechanistically, ARHGAP33 interacts with SORT1 to cooperatively regulate TrkB trafficking. Human ARHGAP33 is associated with brain phenotypes and reduced SORT1 expression is found in patients with schizophrenia. We propose that ARHGAP33/SORT1-mediated TrkB trafficking is essential for synapse development and that the dysfunction of this mechanism may be a new molecular pathology of neuropsychiatric disorders.


Figures

Figure 1
Figure 1. Impaired TrkB trafficking to the cell surface at synapses in ARHGAP33 KO mice.
(a) Protein structure of a brain-enriched SNX protein, ARHGAP33. ARHGAP33 has an N-terminal PX domain, an SH3 domain and a RhoGAP domain. (b,c) Decreased cell-surface expression of TrkB in ARHGAP33 KO mice. Biotinylated cell-surface proteins (upper) and total lysates (lower) of WT and ARHGAP33 KO neurons (14 DIV) were immunoblotted with anti-TrkB, anti-TrkC, anti-SORT1, anti-GAPDH and anti-ARHGAP33 antibodies. (b) Representative blots. (c) Quantification of surface expression (each, n=8; TrkB, P=7.8 × 10⁻⁴; TrkC and SORT1, P>0.05; Mann–Whitney U-test). The expression levels of TrkB, TrkC and SORT1 in ARHGAP33 KO neurons were normalized to those in WT neurons (The averaged WT values were set to 100%). (d,e) Decreased TrkB in the isolated PSD fraction of ARHGAP33 KO mice. The isolated PSD fraction and total lysates of WT and ARHGAP33 KO mice were immunoblotted with anti-TrkB, anti-PSD-95, anti-SORT1, and anti-ARHGAP33 antibodies. Representative blots (d). Quantification for the isolated PSD fraction (each, n=8, TrkB, P=7.7 × 10⁻⁴; SORT1 and PSD-95, P>0.05; Mann–Whitney U-test) and for the total lysate (each, n=8, P>0.05; Mann–Whitney U-test; e) The expression levels of TrkB, SORT1 and PSD-95 in the PSD fraction and total lysate from ARHGAP33 KO mice were normalized to those from WT mice (The averaged WT values were set to 100%). Note that the amounts of PSD-95 and SORT1 in the isolated PSD fraction from ARHGAP33 KO mice were not significantly different from those in the fraction from WT mice. *P<0.05. NS, not significant. Bars show median values. All western blots show representative results from eight independent experiments performed using different mice.
Figure 2
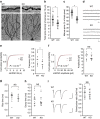
Figure 2. Impaired spine development in ARHGAP33 KO mice.
(ac) Decreased total and mature spine densities in ARHGAP33 KO mice. Examples of Golgi staining of granule cells in the hippocampal dentate gyri from 12-week-old ARHGAP33 KO and WT mice (a). Scale bars, 10 μm. Z-stacks were imaged, and individual spines were measured (WT, n=33 cells, KO, n=29 cells; each n=4 mice; total spine density, P=4.4 × 10⁻⁵; percentage of mature spines, P=7.7 × 10⁻¹⁷, one-way ANOVA; b,c). *P<0.05. Bars show mean values. Note that dendritic protrusions with widths larger than half their length were classified as mature spines. (dh) Decreased mEPSC frequency and amplitude in ARHGAP33 KO dentate gyrus granule cells. Representative traces of mEPSCs obtained from hippocampal slices of 12-week-old WT and ARHGAP33 KO mice (d). Scale bar, 10 pA, 100 ms. Cumulative probability plot and summary of average mEPSC frequency and amplitude of the same neurons (eh). mEPSC frequency (cumulative probability plot, WT, n=2,937 events, KO, n=2,139 events, P=1.3 × 10⁻¹¹, Kolmogorov–Smirnov test; average (scatterplot), WT, n=15 cells, KO, n=15 cells, P=0.017, Mann–Whitney U-test; e); mEPSC amplitude (cumulative probability plot, WT, n=2,937 events, KO, n=2,139 events, P=8.7 × 10⁻⁷, Kolmogorov–Smirnov test; average (scatterplot), WT, n=15 cells, KO, n=15 cells, P>0.05, Mann–Whitney U-test; f); rise time (g) and decay time (h; WT, n=15 cells, KO, n=15 cells, P>0.05, Mann–Whitney U-test). *P<0.05. Bars in the summary plots show median values. (i) No change in the paired-pulse ratio of evoked EPSCs from ARHGAP33 KO dentate gyrus granule cells. Representative traces of EPSCs (left). Scale bars, 100 pA, 20 ms. Summary graph showing the ratio of the second to the first EPSC amplitude (WT, n=20 cells; KO, n=17 cells, P>0.05, Mann–Whitney U-test; right). NS, not significant.
Figure 3
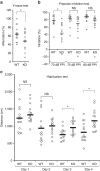
Figure 3. Behavioural abnormalities in ARHGAP33 KO mice.
(a) Impaired spontaneous alternations of ARHGAP33 KO mice during the Y-maze test (WT, n=14, KO, n=13, F1,25=5.18, P=0.031, one-way ANOVA). *P<0.05. Bars show mean values. (b) Impaired PPI of ARHGAP33 KO mice (each n=13, P=0.046, Friedman test followed by Scheffe tests). *P<0.05. NS, not significant. Bars show median values. (c) Impaired open field habituation of ARHGAP33 KO mice during the openfield habituation test (each n=14, genotype effect, F1,26=5.08, P=0.033, two-way ANOVA with repeated measures; day 3, P=1.3 × 10⁻⁴, day 4, P=7.0 × 10⁻⁴, Tukey–Kramer post hoc tests). *P<0.05. NS, not significant. Bars show mean values.
Figure 4
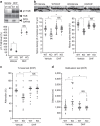
Figure 4. Rescue of the impaired spine development and behavioural abnormalities in ARHGAP33 KO mice via TrkB activation in adulthood.
(a) Activation of TrkB by 7,8-DHF injection (12.5 mg kg−1). TrkB-immunoprecipitates and hippocampal lysates were immunoblotted with the indicated antibodies. Representative blots (upper) and quantification of phospho-TrkB levels (lower; each n=9, corrected P=0.0014, Mann–Whitney U-test with the Ryan's correction). The pY-TrkB levels of vehicle-KO, DHF-WT and DHF-KO were normalized to that of vehicle-WT (The averaged vehicle-WT value was set to 100%). Bars show median values. (b) Rescue of the decreased number of spines in ARHGAP33 KO neurons after 2 weeks of daily treatment with 7,8-DHF. Examples of dentate granule Golgi staining (upper). Scale bars, 10 μm. Quantification of the total spine density and the percentage of mature spines (vehicle-WT, n=29 cells, vehicle-KO, n=30, DHF-WT, n=28 cells, DHF-KO, n=31 cells, each n=4 mice; spine density, F1,114=19.7, P=2.1 × 10⁻⁵, two-way ANOVA; P=9.7 × 10⁻¹⁰ (vehicle-WT versus vehicle-KO), P=3.6 × 10⁻¹⁰ (vehicle-KO versus DHF-KO), Tukey–Kramer post hoc tests; mature spine density, F1,114=83.7, P=2.6 × 10⁻¹⁵, two-way ANOVA; P=7.3 × 10⁻²⁶ (vehicle-WT versus vehicle-KO), P=4.9 × 10⁻²¹ (vehicle-KO versus DHF-KO), Tukey–Kramer post hoc tests; lower). Bars show mean values. (c) Rescue of the impaired working memory in ARHGAP33 KO mice during the Y-maze test after treatment with 7,8-DHF (vehicle-WT, n=12, vehicle-KO, n=16, DHF-WT, n=16, DHF-KO, n=15, DHF treatment × genotype interaction, F1,55=4.60, P=0.036, two-way ANOVA; P=4.6 × 10⁻³ (vehicle-WT versus vehicle-KO), P=1.1 × 10⁻³ (vehicle-KO versus DHF-KO), Tukey–Kramer post hoc tests). Bars show mean values. (d) Rescue of the impaired open-field habituation in ARHGAP33 KO mice after treatment with 7,8-DHF on the test day (day 4; vehicle-WT, n=20, vehicle-KO, n=16, DHF-WT, n=17, DHF-KO, n=14, corrected P=0.0052 (vehicle-WT versus vehicle-KO), corrected P=0.035 (vehicle-KO versus DHF-KO), Mann–Whitney U-test with the Ryan's correction). *P<0.05. NS, not significant. Bars show median values.
Figure 5
Figure 5. Increased TrkB at the Golgi apparatus in ARHGAP33 KO mice.
(a) ARHGAP33 was localized to the Golgi apparatus. Double immunostaining for ARHGAP33 and a Golgi marker, GM130, in dissociated hippocampal neurons. Scale bar, 5 μm. Asterisks indicate the nucleus of neurons. Note that ARHGAP33 immunoreactivity was not detected in the neurons from ARHGAP33 KO mice (lower). The data are representative of three independent experiments. (b) ARHGAP33 and SORT1 were co-fractionated with a Golgi marker, GM130. Biochemical preparation of the Golgi membrane fraction from a mouse brain lysate with a discontinuous sucrose density gradient. Equal amounts of protein were loaded into individual lanes and probed with antibodies against SORT1, ARHGAP33, GM130 (a Golgi marker) and EEA1 (an endosomal marker). (c) The amount of TrkB, but not SORT1, in the Golgi membrane-enriched fraction was significantly increased in ARHGAP33 KO mice. Equal amount of the Golgi membrane fractions from WT and ARHGAP33 KO mice were probed with anti-TrkB, anti-SORT1, anti-GM130 and anti-ARHGAP33 antibodies. (d) Quantification of the amount of TrkB and SORT1 in the Golgi membrane-enriched fraction (each, n=7, TrkB, P=0.0017; SORT1, P>0.05, Mann–Whitney U-test). The levels of TrkB and SORT1 in the Golgi-enriched fraction from ARHGAP33 KO mice were normalized to those from WT mice (The averaged WT values were set to 100%). *P<0.05. NS, not significant. Bars show median values.
Figure 6
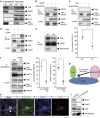
Figure 6. ARHGAP33 promotes the interaction between TrkB and SORT1.
(a) ARHGAP33 formed complexes with SORT1 and TrkB. ARHGAP33-immunoprecipitates (left) and hippocampal total lysates (right) were immunoblotted with the indicated antibodies. (bd) ARHGAP33 formed complexes with SORT1 and TrkB. HEK293T cells were transfected with ARHGAP33, SORT1 and TrkB, as indicated. Immunoprecipitates were immunoblotted with the indicated antibodies. (e) Weakened interaction between TrkB and SORT1 in ARHGAP33 KO mice. SORT1 immunoprecipitates were immunoblotted with the indicated antibodies. Representative blots (left) and quantification of co-immunoprecipitated TrkB (right; each n=9; P=3.4 × 10⁻⁴, Mann–Whitney U-test). *P<0.05. The level of co-precipitated TrkB in ARHGAP33 KO mice was normalized to that in WT mice (the averaged WT value was set to 100%). Bars show median values. Western blots show representative results from nine independent experiments performed using different mice. (f) Weakened interaction between ARHGAP33 and TrkB in the SORT1 knockdown neuron. ARHGAP33-immunoprecipitates and total lysates were immunoblotted with the indicated antibodies. Representative blots (left), quantification of co-immunoprecipitated TrkB (centre) and quantification of SORT1 expression (confirmation of SORT1 knockdown; right; each n=8; TrkB, P=7.5 × 10⁻⁴, SORT1, P=7.7 × 10⁻⁴, Mann–Whitney U-test). The averaged values of the control neurons were set to 100%. *P<0.05. Bars show median values. Western blots show representative results from eight independent experiments performed using neurons from different mice; cont., control; KD, knockdown. Note that the MISSION shRNA construct (TRCN0000034496) was used. (g) In the ARHGAP33/SORT1/TrkB complex, ARHGAP33 promoted the interaction between TrkB and SORT1. In addition, ARHGAP33 is suggested to recruit Cdc42 into the complex. (h) Colocalization of ARHGAP33, SORT1 and TrkB at the perinuclear region. Triple immunostaining for ARHGAP33, SORT1 and TrkB in dissociated hippocampal neurons. Scale bar, 5 μm. The asterisks indicate the nucleus of the neuron. The arrowhead indicates the colocalization of these three proteins at the perinuclear region. The data are representative of five independent experiments. (i) Interactions between ARHGAP33 and Rab11 or Rab27 were not detected in the hippocampal lysates. ARHGAP33-immunoprecipitates (right) and hippocampal total lysates (left) were immunoblotted with the indicated antibodies.
Figure 7
Figure 7. Cooperative facilitation of TrkB trafficking by ARHGAP33 and SORT1.
(a,b) Increased TrkB surface expression by ARHGAP33 and SORT1. HEK293T cells were transfected with TrkB, ARHGAP33 and SORT1 as indicated in b (1–4). Representative data from eight independent experiments of immunostaining of surface TrkB in HEK293T cells with an antibody against the extracellular region of TrkB (a). Scale bar, 10 μm. Representative blots (left) and the quantification of the surface TrkB (right) (b). Biotinylated cell-surface proteins were immunoblotted with the indicated antibodies. The surface expression of TrkB was enhanced by simultaneous expression of ARHGAP33 and SORT1 compared with the expression of ARHGAP33 alone (each n=8; ARHGAP33 alone versus ARHGAP33 and SORT1, P=0.004, Kruskal–Wallis test followed by post hoc Steel–Dwass tests). Western blots show representative results from eight independent experiments. The averaged value of surface TrkB level in cells expressing ARHGAP33 alone (lane 3) was set to 100%. *P<0.05. Bars show median values. (c) Requirement of SORT1 in ARHGAP33-mediated TrkB trafficking. Biotinylated cell-surface proteins were immunoblotted with the indicated antibodies. Representative blots (left), quantification of surface TrkB expression (centre) and quantification of SORT1 expression (confirmation of SORT1 knockdown; right; each n=10; surface TrkB, WT versus ARHGAP33 KO in control neurons, corrected P=6.0 × 10⁻⁴; WT versus ARHGAP33 KO in SORT1 knockdown neurons, corrected P>0.05; ARHGAP33 KO versus ARHGAP33 KO plus SORT1 knockdown, corrected P>0.05, Mann–Whitney U-test with the Ryan's correction). Western blots show representative results from 10 independent experiments performed using neurons from different mice. The averaged values of WT mice in the control neurons were set to 100%. *P<0.05; cont., control; KD, knockdown; NS, not significant. Bars show median values. Note that the MISSION shRNA construct (TRCN0000034496) was used. (d) Strongly correlated expression of SORT1 and ARHGAP33 in immortalized lymphocytes from human blood (r=0.42, P<0.001, Spearman's rank order correlation test). Quantitative RT-PCR analysis of ARHGAP33 and SORT1 expression in immortalized lymphocytes was performed. Then, the levels of SORT1 and ARHGAP33 expression in each sample were plotted.
Figure 8
Figure 8. Association of ARHGAP33 with schizophrenia.
(a,b) Quantitative RT–PCR analysis of ARHGAP33 and SORT1 expression in immortalized lymphocytes from schizophrenia patients (schizo.) and age- and sex-matched controls. Significant reductions are observed in ARHGAP33 (each n=45, U=699, P=0.011, Mann–Whitney U-test; a) and SORT1 (each n=45; U=683, P=7.8 × 10⁻³, Mann–Whitney U-test; b) in schizophrenia patients. The expression levels of these genes were normalized to GAPDH mRNA. Bars show median values. (c) Linkage disequilibrium of ARHGAP33 in the HapMap JPT. Each diamond represents the correlation (r2) between each pair of SNPs, with darker shades representing stronger linkage disequilibrium, as obtained from the HapMap JST samples. (d) The locations of the SNPs analysed in this study. (e,f) Impact of the risk-T-allele on grey matter volume of the left middle temporal gyrus in schizophrenia patients. A significant cluster of the genotype effect in the left middle temporal gyrus is observed in schizophrenia patients, which is shown as cross-hairline (uncorrected P<0.001, cluster size >100; e). Relative grey matter volumes extracted from the left middle temporal gyrus (F1,122=13.5, P=3.6 × 10⁻⁴, ANOVA), the right medial frontal gyrus (F1,122=13.5, P=8.2 × 10⁻⁴, ANOVA) and the right inferior temporal gyrus (F1,122=13.1, P=4.4 × 10⁻⁴, ANOVA; f). *P<0.05. Data are expressed as the mean±s.e.m.

Similar articles

Cited by

References

    1. Maeder C. I., Shen K. & Hoogenraad C. C. Axon and dendritic trafficking. Curr. Opin. Neurobiol. 27, 165–170 (2014). - PubMed
    1. Sheng M. & Kim E. The postsynaptic organization of synapses. Cold Spring Harb. Perspect. Biol. 3, a005678 (2011). - PMC - PubMed
    1. Lasiecka Z. M. & Winckler B. Mechanisms of polarized membrane trafficking in neurons- focusing in on endosomes. Mol. Cell. Neurosci. 48, 278–287 (2011). - PMC - PubMed
    1. Cullen P. J. Endosomal sorting and signaling: an emerging role for sorting nexins. Nat. Rev. Mol. Cell Biol. 9, 574–582 (2008). - PubMed
    1. Chiang S. H. et al. TCGAP, a multidomain Rho GTPase-activating protein involved in insulin-stimulated glucose transport. EMBO J. 22, 2679–2691 (2003). - PMC - PubMed

Publication types

MeSH terms