Large-Scale Analyses of Angiosperm Nucleotide-Binding Site-Leucine-Rich Repeat Genes Reveal Three Anciently Diverged Classes with Distinct Evolutionary Patterns
- PMID: 26839128
- PMCID: PMC4825152
- DOI: 10.1104/pp.15.01487
Large-Scale Analyses of Angiosperm Nucleotide-Binding Site-Leucine-Rich Repeat Genes Reveal Three Anciently Diverged Classes with Distinct Evolutionary Patterns
Abstract
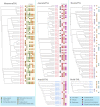
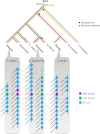
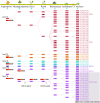
Nucleotide-binding site-leucine-rich repeat (NBS-LRR) genes make up the largest plant disease resistance gene family (R genes), with hundreds of copies occurring in individual angiosperm genomes. However, the expansion history of NBS-LRR genes during angiosperm evolution is largely unknown. By identifying more than 6,000 NBS-LRR genes in 22 representative angiosperms and reconstructing their phylogenies, we present a potential framework of NBS-LRR gene evolution in the angiosperm. Three anciently diverged NBS-LRR classes (TNLs, CNLs, and RNLs) were distinguished with unique exon-intron structures and DNA motif sequences. A total of seven ancient TNL, 14 CNL, and two RNL lineages were discovered in the ancestral angiosperm, from which all current NBS-LRR gene repertoires were evolved. A pattern of gradual expansion during the first 100 million years of evolution of the angiosperm clade was observed for CNLs. TNL numbers remained stable during this period but were eventually deleted in three divergent angiosperm lineages. We inferred that an intense expansion of both TNL and CNL genes started from the Cretaceous-Paleogene boundary. Because dramatic environmental changes and an explosion in fungal diversity occurred during this period, the observed expansions of R genes probably reflect convergent adaptive responses of various angiosperm families. An ancient whole-genome duplication event that occurred in an angiosperm ancestor resulted in two RNL lineages, which were conservatively evolved and acted as scaffold proteins for defense signal transduction. Overall, the reconstructed framework of angiosperm NBS-LRR gene evolution in this study may serve as a fundamental reference for better understanding angiosperm NBS-LRR genes.
© 2016 American Society of Plant Biologists. All Rights Reserved.
Figures


Similar articles
-
Tracking ancestral lineages and recent expansions of NBS-LRR genes in angiosperms.Plant Signal Behav. 2016 Jul 2;11(7):e1197470. doi: 10.1080/15592324.2016.1197470. Plant Signal Behav. 2016. PMID: 27348446 Free PMC article.
-
Distinct Patterns of Gene Gain and Loss: Diverse Evolutionary Modes of NBS-Encoding Genes in Three Solanaceae Crop Species.G3 (Bethesda). 2017 May 5;7(5):1577-1585. doi: 10.1534/g3.117.040485. G3 (Bethesda). 2017. PMID: 28364035 Free PMC article.
-
Uncovering the dynamic evolution of nucleotide-binding site-leucine-rich repeat (NBS-LRR) genes in Brassicaceae.J Integr Plant Biol. 2016 Feb;58(2):165-77. doi: 10.1111/jipb.12365. Epub 2015 Jul 24. J Integr Plant Biol. 2016. PMID: 25926337
-
The genetic architecture of resistance.Curr Opin Plant Biol. 2000 Aug;3(4):285-90. doi: 10.1016/s1369-5266(00)00081-9. Curr Opin Plant Biol. 2000. PMID: 10873848 Review.
-
Identification and expression profiling analysis of NBS-LRR genes involved in Fusarium oxysporum f.sp. conglutinans resistance in cabbage.3 Biotech. 2019 May;9(5):202. doi: 10.1007/s13205-019-1714-8. Epub 2019 May 4. 3 Biotech. 2019. PMID: 31065502 Free PMC article. Review.
Cited by
-
Evolutionary balance between LRR domain loss and young NBS-LRR genes production governs disease resistance in Arachis hypogaea cv. Tifrunner.BMC Genomics. 2019 Nov 13;20(1):844. doi: 10.1186/s12864-019-6212-1. BMC Genomics. 2019. PMID: 31722670 Free PMC article.
-
The NLRomes of Zea mays NAM founder lines and Zea luxurians display presence-absence variation, integrated domain diversity, and mobility.Mol Plant Pathol. 2023 Jul;24(7):742-757. doi: 10.1111/mpp.13319. Epub 2023 Mar 16. Mol Plant Pathol. 2023. PMID: 36929631 Free PMC article.
-
Altering Specificity and Autoactivity of Plant Immune Receptors Sr33 and Sr50 Via a Rational Engineering Approach.Mol Plant Microbe Interact. 2023 Jul;36(7):434-446. doi: 10.1094/MPMI-07-22-0154-R. Epub 2023 Aug 14. Mol Plant Microbe Interact. 2023. PMID: 36867580 Free PMC article.
-
Jurassic NLR: Conserved and dynamic evolutionary features of the atypically ancient immune receptor ZAR1.Plant Cell. 2023 Sep 27;35(10):3662-3685. doi: 10.1093/plcell/koad175. Plant Cell. 2023. PMID: 37467141 Free PMC article.
-
Genome-scale examination of NBS-encoding genes in blueberry.Sci Rep. 2018 Feb 21;8(1):3429. doi: 10.1038/s41598-018-21738-7. Sci Rep. 2018. PMID: 29467425 Free PMC article.
References
-
- Akita M, Valkonen JP (2002) A novel gene family in moss (Physcomitrella patens) shows sequence homology and a phylogenetic relationship with the TIR-NBS class of plant disease resistance genes. J Mol Evol 55: 595–605 - PubMed
-
- Amborella Genome Project (2013) The Amborella genome and the evolution of flowering plants. Science 342: 1241089. - PubMed
-
- Andolfo G, Sanseverino W, Rombauts S, Van de Peer Y, Bradeen JM, Carputo D, Frusciante L, Ercolano MR (2013) Overview of tomato (Solanum lycopersicum) candidate pathogen recognition genes reveals important Solanum R locus dynamics. New Phytol 197: 223–237 - PubMed
Publication types
MeSH terms
Substances
LinkOut - more resources
Full Text Sources
Other Literature Sources
Research Materials
Miscellaneous

