. 2016 Feb 16;113(7):E922-31.
doi: 10.1073/pnas.1525726113. Epub 2016 Feb 2.

Differential vesicular sorting of AMPA and GABAA receptors

Affiliations

Differential vesicular sorting of AMPA and GABAA receptors

Yi Gu et al. Proc Natl Acad Sci U S A. .

Abstract

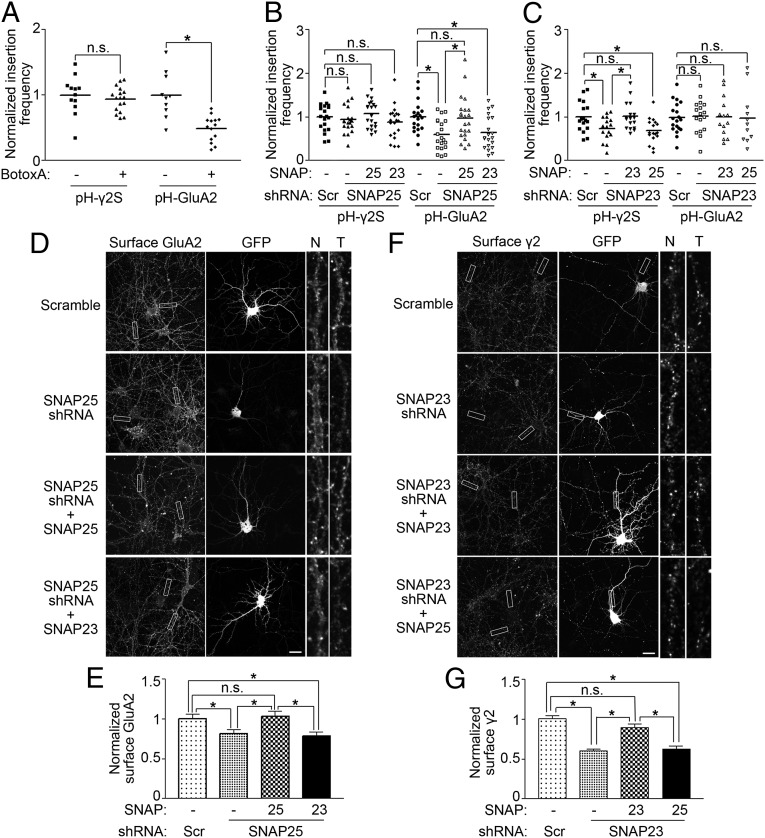
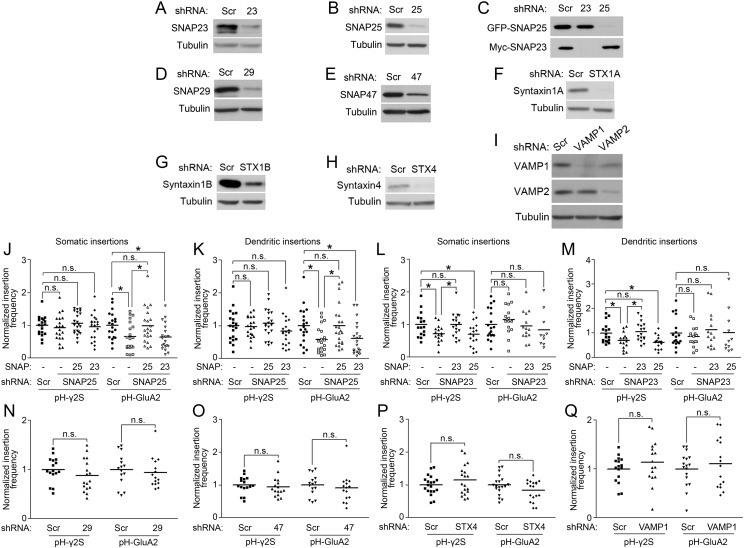
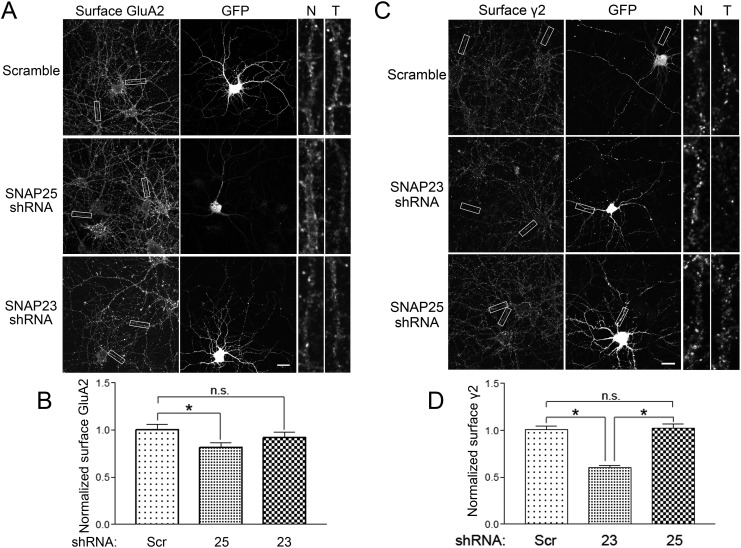
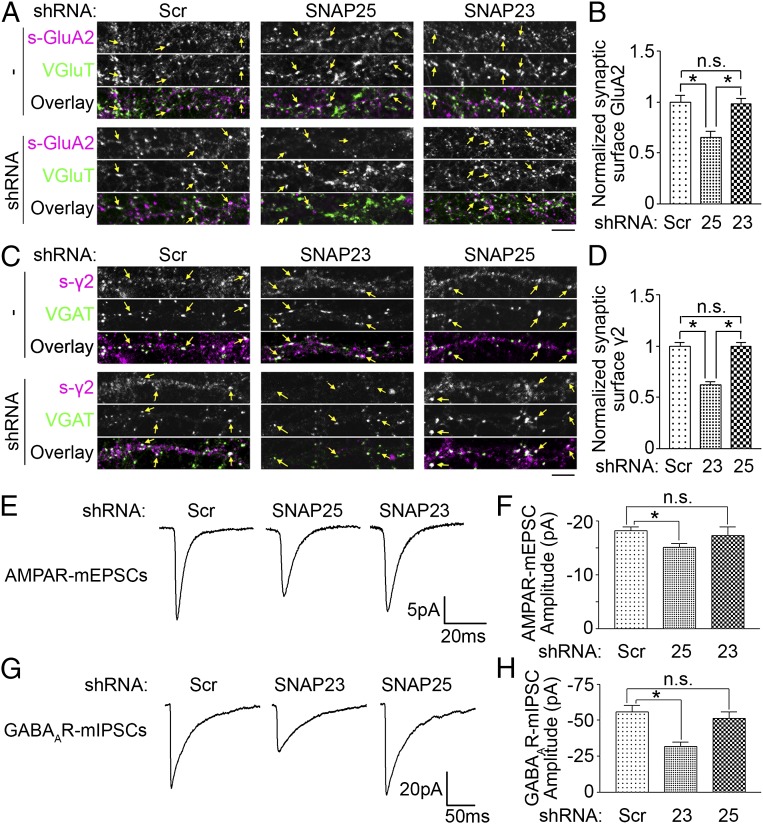
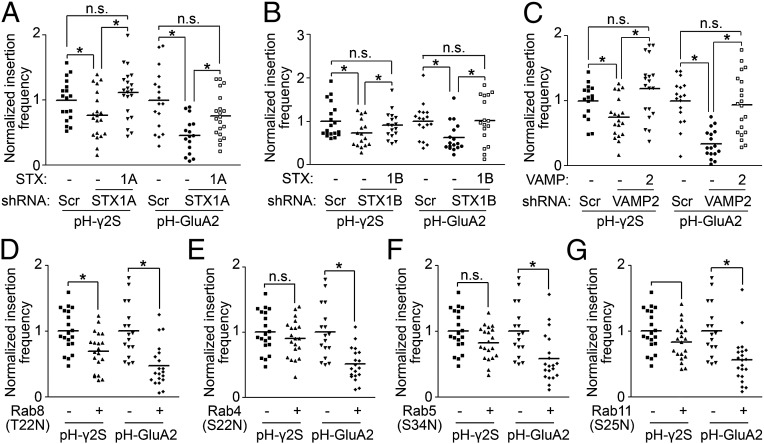
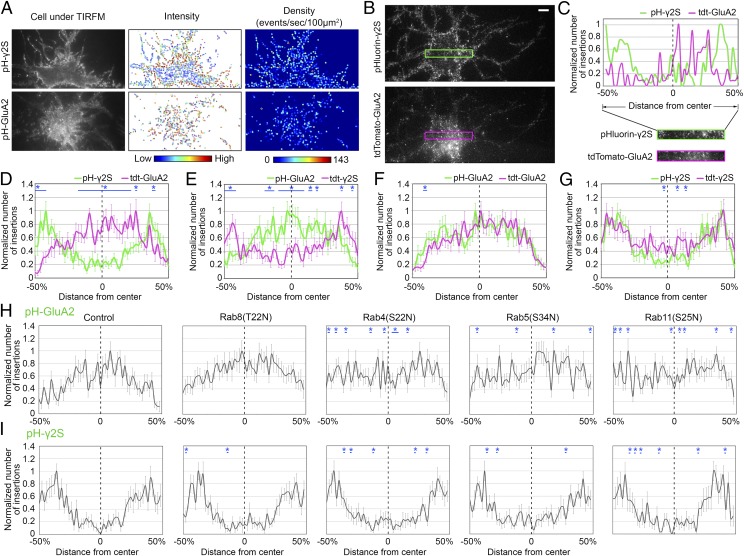
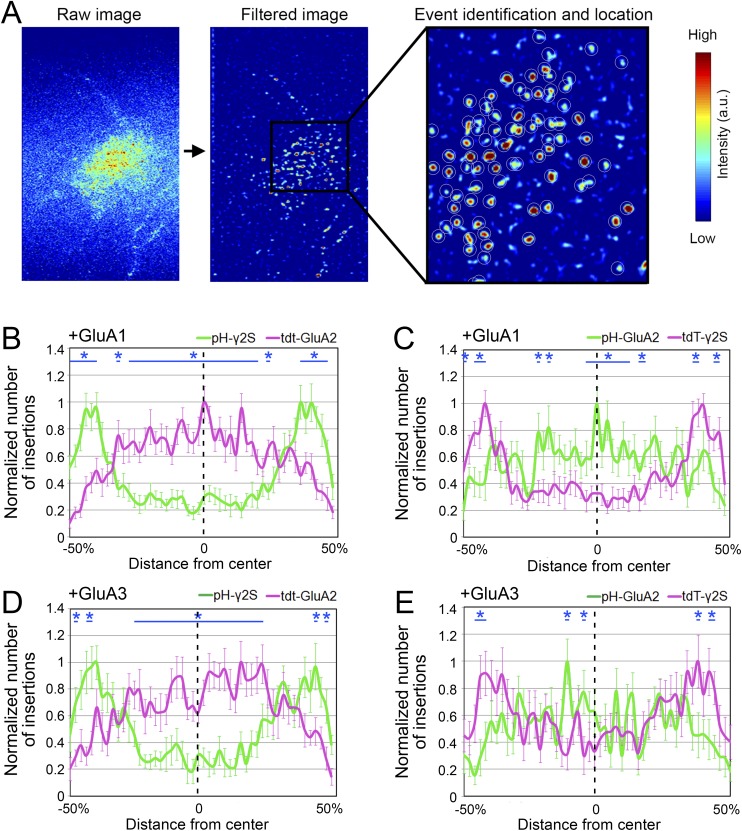
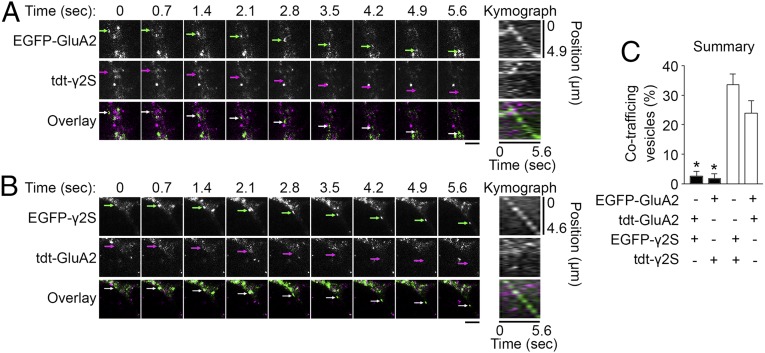
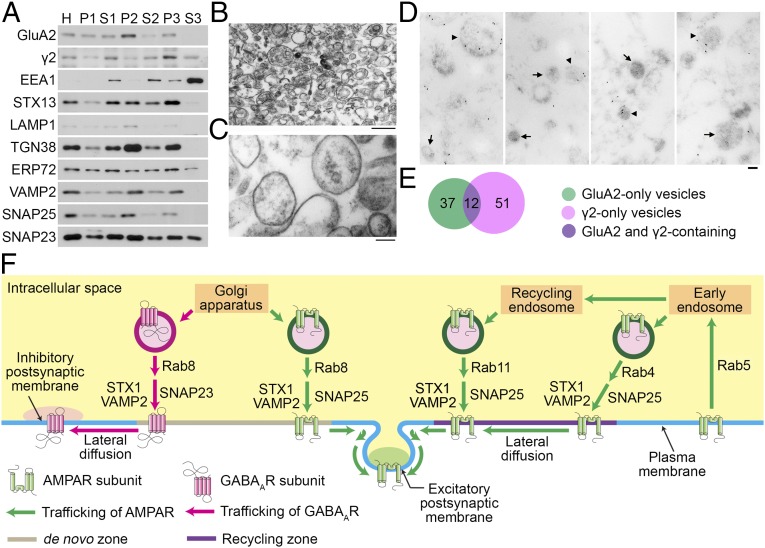
In mature neurons AMPA receptors cluster at excitatory synapses primarily on dendritic spines, whereas GABAA receptors cluster at inhibitory synapses mainly on the soma and dendritic shafts. The molecular mechanisms underlying the precise sorting of these receptors remain unclear. By directly studying the constitutive exocytic vesicles of AMPA and GABAA receptors in vitro and in vivo, we demonstrate that they are initially sorted into different vesicles in the Golgi apparatus and inserted into distinct domains of the plasma membrane. These insertions are dependent on distinct Rab GTPases and SNARE complexes. The insertion of AMPA receptors requires SNAP25-syntaxin1A/B-VAMP2 complexes, whereas insertion of GABAA receptors relies on SNAP23-syntaxin1A/B-VAMP2 complexes. These SNARE complexes affect surface targeting of AMPA or GABAA receptors and synaptic transmission. Our studies reveal vesicular sorting mechanisms controlling the constitutive exocytosis of AMPA and GABAA receptors, which are critical for the regulation of excitatory and inhibitory responses in neurons.

Keywords: AMPA receptor; GABAA receptor; SNARE; TIRFM; constitutive exocytosis.


Conflict of interest statement

The authors declare no conflict of interest.

Figures

Fig. 1.
Fig. 1.
Exocytic events of pH-GluA2 and pH-γ2S under TIRFM. (A) Dynamic TIRF events of pH-GluA2 and pH-γ2S are highlighted based on intensity. Typical events are indicated by white arrowheads. Imaging frequency is 1.4 Hz with 500-ms exposure. (Scale bars: 5 µm.) (B and C) Dynamic events of pH-GluA2 (B) and pH-γ2S (C) are transient. (Top) Time series of a single event. (Bottom) Distribution of event durations. Arrows indicate the main event duration. n = 120 for both receptors. (Scale bars: 1 µm.) (D) Acidification–neutralization analysis of pH-GluA2 and pH-γ2S events. From left to right: cells in the extracellular solution at pH 7.4, 5.5, and 7.4. (Scale bars: 5 µm.) (E) Dynamics of an exocytic vesicle containing two receptor subunits differentially tagged with pHluorin and tdTomato. (F) Predicted dynamics of tdTomato and pHluorin receptors in the same exocytic vesicle under TIRFM. (G and I) TIRF dynamics of a coinsertion vesicle containing tdt-GluA2 and pH-GluA2 (G) or tdt-γ2S and pH-γ2S (I). (Scale bars: 1 µm.) (H and J) Time course of tdt-GluA2 and pH-GluA2 (H) or tdt-γ2S and pH-γ2S (J) from multiple coinsertion events. In H, n = 27; in J, n = 31. (K and L) Dynamic events of GluA2 and γ2S are inhibited by Botox B (K) or Botox C (L). The same control dataset was used. Each data point is one cell. The line in each dataset shows mean frequency. Event frequencies of all cells were normalized by the mean of the control. Asterisks indicate statistical significances.
Fig. S1.
Fig. S1.
Characterization of surface dynamic events of pH-GluA2 and pH- γ2S. (A) Duration of pH-GluA2 events is longer than that of pH-γ2S events. Each data point represents one cell. (B) The frequency of dynamic TIRF events of pH-γ2S is significantly higher than that of pH-GluA2 under two different imaging frequencies. The exposure time was 100 ms for 10-Hz imaging. The exposure time was 500 ms for 1.4-Hz imaging. Each data point represents one cell. (C) Frequencies of dynamic TIRF events of pH-GluA2 and pH-γ2S are sensitive to pH of extracellular solution, which is indicated in the figure. Fifty millimolar NH4Cl was used in the extracellular solution to alkalinize all of the intracellular vesicles. (D) Frequency of the dynamic events of GluA2 and γ2S is not affected by neuronal activity. One micromolar TTX or 12 mM KCl were applied to hippocampal neurons in the media for 1 h and the cells were then imaged under TIRFM. Asterisk indicates statistical significance. n.s., no statistical significance. (E, Top) Sequential images showing the kinetics of surface-absorbed EGFP monomer under single-step photobleaching visualized by TIRFM. Image interval: 0.7 s. (Scale bar: 1 µm.) (Bottom) An example of fluorescent intensity trace of EGFP monomer under single-step photobleaching. (F) Binned fluorescence intensity distribution of individual EGFP monomers (gray bars) and fitted Gaussian curve based on the distribution (purple curve). The dashed line shows the peak intensity of the Gaussian curve. n = 561. (G) Binned fluorescence intensity distribution of individual pH-GluA2–containing vesicles (gray bars) and fitted Gaussian curve based on the distribution (purple curve). The dashed line shows the peak intensity of the Gaussian curve. n = 446. (H) Binned fluorescence intensity distribution of individual pH-γ2S–containing vesicles (gray bars) and fitted Gaussian curve based on the distribution (purple curve). The dashed line shows the peak intensity of the Gaussian curve. n = 733.
Fig. S2.
Fig. S2.
Characterization of tdTomato-GluA2 and tdTomato-γ2S. (A) Coexpression of EGFP-GluA2 (top left) and tdt-GluA2 (top right) in live hippocampal neurons. (Scale bar: 20 µm.) High-magnification images from the selected region are shown in bottom panels: bottom left, EGFP-GluA2; bottom middle, tdt-GluA2; bottom right, overlay left and middle panels. (Scale bar: 5 µm.) (B) Colocalization of tdt-GluA2 and endogenous GluA1 in hippocampal neurons at DIV 19. Top left, total tdt-GluA2 stained with anti-DsRed antibody; top middle, endogenous GluA1 stained with anti-GluA1 antibody; top right, overlay of total tdt-GluA2 and endogenous GluA1. (Scale bar: 20 µm.) High-magnification images from the selected region are shown in bottom panels. (Scale bar: 5 µm.) (C) Quantification of colocalization of tdt-GluA2 and endogenous GluA1 in B. Magenta column: 43.4 ± 4.6% of total tdt-GluA2 colocalizes with total GluA1. Green column: 75.5 ± 2.2% of synaptic tdt-GluA2 colocalizes with synaptic GluA1. (D) Similar to A with coexpressions of EGFP-γ2S and tdt-γ2S. (E) Colocalization of tdt-γ2S and endogenous β2/3 in hippocampal neurons at DIV 19. Top left, total tdt-γ2S stained with anti-DsRed antibody; top middle, endogenous β2/3 stained with anti-β2/3 antibody; top right, overlay of total tdt-γ2S and endogenous β2/3. (Scale bar: 20 µm.) High-magnification images from the selected region are shown accordingly in bottom panels. (Scale bar: 5 µm.) (F) Quantification of colocalization of tdt-γ2S and endogenous β2/3 in E. Magenta column: 51.3 ± 4.4% of total tdt-γ2S colocalizes with total β2/3. Green column: 85.4 ± 1.4% of synaptic tdt-γ2S colocalizes with synaptic β2/3. Each group of quantified data is collected from three cells and three different areas were used in each cell.
Fig. S3.
Fig. S3.
Colocalizations of tdt-GluA2 with PSD95 and VGluT. (A) Immunostainings of surface tdt-GluA2 and PSD95 in hippocampal neurons at DIV 18. Top left, fluorescent signal of total tdt-GluA2 without staining; top middle, surface tdt-GluA2; top right, endogenous PSD95. (Scale bar: 20 µm.) High-magnification images from the selected region are shown in middle panels. (Scale bar: 5 µm.) Bottom panels: overlaid figures of middle figures as indicated in the figure. (B) Quantification of colocalization of tdt-GluA2 with PSD95 in A. Magenta column: 37.3 ± 3.1% of total tdt-GluA2 colocalizes with total PSD95. Green column: 31.4 ± 2.6% of surface tdt-GluA2 colocalizes with total PSD95. Stripped magenta column: 82.1 ± 2.0% of synaptic total tdt-GluA2 colocalizes with synaptic PSD95. Stripped green column: 69.4 ± 3.0% of synaptic surface tdt-GluA2 colocalizes with synaptic PSD95. (C) Immunostainings of surface tdt-GluA2 and VGluT in hippocampal neurons at DIV 18. Top left, fluorescent signal of total tdt-GluA2 without staining; top middle, surface tdt-GluA2; top right, endogenous VGluT. (Scale bar: 20 µm.) High-magnification images from the selected region are shown in middle panels. (Scale bar: 5 µm.) Bottom panels: overlaid figures of middle figures as indicated in the figure. (D) Quantification of colocalization of tdt-GluA2 with VGluT in C. Magenta column: 18.7 ± 2.8% of total tdt-GluA2 colocalizes with total VGluT. Green column: 18.3 ± 2.0% of surface tdt-GluA2 colocalizes with total VGluT. Stripped magenta column: 46.9 ± 3.1% of synaptic total tdt-GluA2 colocalizes with synaptic VGluT. Stripped green column: 42.9 ± 2.0% of synaptic surface tdt-GluA2 colocalizes with synaptic VGluT. Each group of quantified data is collected from three cells and three different areas were used in each cell.
Fig. S4.
Fig. S4.
Colocalizations of tdt-γ2S with gephyrin and VGAT. (A) Immunostainings of surface tdt-γ2S and gephyrin in hippocampal neurons at DIV 16. Top left, fluorescent signal of total tdt-γ2S without staining; top middle, surface tdt-γ2S; top right, endogenous gephyrin. (Scale bar: 20 µm.) High-magnification images from the selected region are shown in middle panels. (Scale bar: 5 µm.) Bottom panels: overlaid figures of middle figures as indicated in the figure. (B) Quantification of colocalization of tdt-γ2S with gephyrin in E. Magenta column: 65.0 ± 6.0% of total tdt-γ2S colocalizes with total gephyrin. Green column: 23.8 ± 3.3% of surface tdt-γ2S colocalizes with total gephyrin. Stripped magenta column: 84.6 ± 2.0% of synaptic total tdt-γ2S colocalizes with synaptic gephyrin. Stripped green column: 62.8 ± 3.7% of synaptic surface tdt-γ2S colocalizes with synaptic gephyrin. (C) Immunostainings of surface tdt-γ2S and VGAT in hippocampal neurons at DIV 16. Top left, fluorescent signal of total tdt-γ2S without staining; top middle, surface tdt-γ2S; top right, endogenous VGAT. (Scale bar: 20 µm.) High-magnification images from the selected region are shown in middle panels. (Scale bar: 5 µm.) Bottom panels: overlaid figures of middle figures as indicated in the figure. (D) Quantification of colocalization of tdt-γ2S with VGAT in E. Magenta column: 56.6 ± 7.1% of total tdt-γ2S colocalizes with total VGAT. Green column: 25.9 ± 3.8% of surface tdt-γ2S colocalizes with total VGAT. Stripped magenta column: 77.9 ± 1.8% of synaptic total tdt-γ2S colocalizes with synaptic VGAT. Stripped green column: 63.1 ± 4.2% of synaptic surface tdt-γ2S colocalizes with synaptic VGAT. Each group of quantified data is collected from three cells and three different areas were used in each cell.
Fig. S5.
Fig. S5.
Cleavage of SNARE proteins by botulinum toxins. (A) Endogenous SNAP25 was cleaved by Botox A. Botox A (260 nM) was applied to hippocampal neurons in media for 1 h. The cells were then lysed and the endogenous SNAP25 level was analyzed. (B) Quantification of cleavage of SNAP25 by Botox A. Averaged protein levels of SNAP25 were normalized by the control without toxin treatment. (C) Endogenous VAMP2 was cleaved by Botox B. Botox B (100 nM) was applied to hippocampal neurons in media for 6 h. The cells were then lysed and the endogenous VAMP2 level was analyzed. (D) Quantification of cleavage of VAMP2 by Botox B. Averaged protein levels of VAMP2 were normalized by the control without toxin treatment. (E) Endogenous syntaxin1A, 1B, 2, 3, and SNAP25 were cleaved by Botox C. Botox C (100 nM) was applied to hippocampal neurons in media for 6 h. The cells were then lysed and the endogenous SNAP25, syntaxin 1A, 1B, 2, and 3 levels were analyzed. (FJ) Quantification of cleavage of syntaxin1A, 1B, 2, 3, and SNAP25 by Botox C. Averaged protein levels of each SNARE were normalized by the control without toxin treatment. Quantified data shown in B, D, and FJ are from three independent experiments. Asterisk indicates statistical significance.
Fig. S6.
Fig. S6.
Lateral diffusion of pH-GluA2 or pH-γ2S following exocytosis. (A) Dynamics of an exocytic event of pH-GluA2. Note that after exocytosis, one exocytic event splits into two events, which separately diffuse away from the insertion spot. (B) Fluorescence time courses on the right panel represent averaged fluorescence changes of the pH-GluA2 event in A in selected regions shown on the left. The green trace represents the fluorescence time course in the center of the exocytic spot (green circle). The magenta trace represents the fluorescence change over time in the annulus surrounding the exocytic spot (the area between green and magenta circles). The baseline was subtracted in each trace. The maximal fluorescence was normalized as 1. (C) Averaged fluorescence time course of multiple pH-GluA2 insertion events on the exocytic spot (green) and surrounding region (magenta). Note that the magenta trace peaks when the green trace starts decaying. n = 30. (D) Peak time of fluorescence of pH-GluA2 events on the exocytic spot and surrounding region. n = 30. (E) Dynamics of an exocytic event of pH-γ2S. (F) Fluorescence time courses on the right panel represent averaged fluorescence changes of the pH-γ2S event in E in selected regions, as indicated on the left. (G) Averaged fluorescence time course of multiple pH-γ2S insertion events on the exocytic spot (green) and surrounding region (magenta). n = 30. (H) Peak time of fluorescence of pH-γ2S events on the exocytic spot and surrounding region. n = 30. Asterisk indicates statistical significance.
Fig. 2.
Fig. 2.
Exocytic events of GluA2 and γ2S are constitutive events mediated by different SNAPs. (A) Insertion of GluA2 and γ2S are differently affected by Botox A treatment. (B) SNAP25 is required for insertions of GluA2, but not γ2S. Scramble shRNA (Scr), SNAP25 shRNA, shRNA-resistant SNAP25 (25), or SNAP23 (23) were coexpressed with pH-receptors for 24 h. (C) SNAP23 is required for insertions of γ2S, but not GluA2. Scramble shRNA (Scr), SNAP23 shRNA, shRNA-resistant SNAP23 (23), or SNAP25 (25) were coexpressed with pH-receptors for 48 h. (D) Knockdown of SNAP25 reduces endogenous surface GluA2. SNAP25 shRNA, shRNA-resistant SNAP25 (SNAP25), or SNAP23 were coexpressed with EGFP to label transfected hippocampal neurons for 72 h. Right panels: high-magnification images of the individual processes boxed in left panels. N, surface GluA2 in nontransfected neurons; T, surface GluA2 in transfected neurons. (Scale bar: 20 µm.) (E) Quantification of surface GluA2 in D. Relative surface GluA2 in transfected neurons is represented by a ratio of surface GluA2 in transfected cells to that of nontransfected cells. The ratios were normalized by the average of the control transfected with the scramble shRNA. Scr: scramble shRNA. 25: shRNA-resistant SNAP25. 23: SNAP23. n = 18–22 neurons for each group. Five processes were selected in each neuron. (F) Knockdown of SNAP23 reduces endogenous surface γ2. SNAP23 shRNA, shRNA-resistant SNAP23 (SNAP23), or SNAP25 were coexpressed with EGFP to label transfected cells for 72 h. (Scale bar: 20 µm.) (G) Quantification of surface γ2 in F was performed similarly as in E. Scr: scramble shRNA. 23: shRNA-resistant SNAP23. 25: SNAP25. n = 25–30 neurons for each group. Five processes were selected in each neuron. Asterisks indicate statistical significances. n.s., no statistical significance.
Fig. S7.
Fig. S7.
shRNA knockdown of SNARE proteins, and effects of shRNAs of SNARE proteins on exocytosis of GluA2 and γ2S. (A, B, and DI) shRNA knockdown of SNARE proteins. Three micrograms of shRNA specifically targeting each SNARE protein was electroporated into dissociated rat cortical neurons at DIV 0 immediately before plating. The cells were lysed 4 days after electroporation and expressions of endogenous SNARE proteins were analyzed. Tubulin was used as an internal control in all experiments. (A) SNAP23; (B) SNAP25; (D) SNAP29; (E) SNAP47; (F) syntaxin1A; (G) syntaxin1B; (H) syntaxin4; (I) VAMP1 and VAMP2. (C) Specificity of SNAP23 and SNAP25 shRNAs. shRNA specificity was tested in HEK293T cells. Myc-SNAP23 and GFP-SNAP25 were cotransfected with either SNAP23 or SNAP25 shRNA. Two days after transfection cells were lysed and expression of myc-SNAP23 and GFP-SNAP25 was determined by blotting with anti-myc and anti-GFP antibodies, respectively. (J and K) SNAP25 is required for both somatic (J) and dendritic (K) exocytosis of GluA2, but not γ2S. Scramble shRNA (Scr), SNAP25 shRNA, shRNA-resistant SNAP25 (25), or SNAP23 (23) were coexpressed with pH-GluA2 or pH-γ2S in hippocampal neurons. One day after transfection, exocytosis of pH-GluA2 or pH-γ2S were imaged under TIRFM. The somatic and dendritic exocytic events were then analyzed separately. (L and M) SNAP23 is required for both somatic (L) and dendritic (M) exocytosis of γ2S, but not GluA2. Scramble shRNA (Scr), SNAP23 shRNA, shRNA-resistant SNAP23 (23), or SNAP25 (25) were coexpressed with pH-GluA2 or pH-γ2S in hippocampal neurons. Two days after transfection, exocytosis of pH-GluA2 or pH-γ2S were imaged under TIRFM. The somatic and dendritic exocytic events were then analyzed separately. (N) SNAP29 is not required for exocytosis of GluA2 and γ2S. In dissociated hippocampal neurons, scramble shRNA (Scr) or SNAP29 shRNA (29) was coexpressed with pH-GluA2 or pH-γ2S. Two days after transfection exocytosis of pH-GluA2 or pH-γ2S were imaged under TIRFM. (O) SNAP47 is not required for exocytosis of GluA2 and γ2S. In dissociated hippocampal neurons, scramble shRNA (Scr) or SNAP47 shRNA (47) was coexpressed with pH-GluA2 or pH-γ2S. Two days after transfection exocytosis of pH-GluA2 or pH-γ2S were imaged under TIRFM. (P) Syntaxin4 is not required for exocytosis of GluA2 and γ2S. In dissociated hippocampal neurons, scramble shRNA (Scr) or syntaxin4 shRNA (STX4) was coexpressed with pH-GluA2 or pH-γ2S. Two days after transfection exocytosis of pH-GluA2 or pH-γ2S were imaged under TIRFM. (Q) VAMP1 is not required for exocytosis of GluA2 and γ2S. In dissociated hippocampal neurons, scramble shRNA (Scr) or VAMP1 shRNA was coexpressed with pH-GluA2 or pH-γ2S. Three days after transfection exocytosis of pH-GluA2 or pH-γ2S were imaged under TIRFM. Asterisks indicate statistical significances. n.s., no statistical significance.
Fig. S8.
Fig. S8.
Knockdown of SNAP23 and SNAP25 does not affect surface expression of endogenous GluA2 and γ2, respectively. (A) Knockdown of SNAP23 did not affect surface expression of endogenous GluA2. In dissociated hippocampal neurons, scramble shRNA, SNAP25 shRNA, or SNAP23 shRNA were coexpressed with EGFP to label transfected cells. Surface levels of endogenous GluA2 were stained 72 h after transfection. Right panels show higher-magnification images of the individual processes boxed in left panels. N, surface GluA2 in nontransfected neurons; T, surface GluA2 in transfected neurons. (Scale bar: 20 µm.) (B) Quantification of endogenous surface GluA2 levels in A. Relative GluA2 surface level of transfected neurons is represented by a ratio of surface GluA2 intensity in transfected cells to that of surrounding nontransfected cells. The ratios were further normalized by the average of the control sample transfected with the scramble shRNA. Scr: scramble shRNA. 23: shRNA-resistant SNAP23. 25: SNAP25. n = 18–22 neurons for each group. Five processes were selected from each neuron. (C) Knockdown of SNAP25 did not affect surface expression of GABAA receptor γ2 subunit. In dissociated hippocampal neurons at DIV 11, scramble shRNA, SNAP23 shRNA, or SNAP25 shRNA were coexpressed with EGFP to label transfected cells. Seventy-two hours after the transfection, endogenous γ2 on the surface was stained. Right panels show higher-magnification images of individual processes boxed in left panels. N, surface γ2 in nontransfected cells; T, surface γ2 in cells transfected with shRNAs. (D) Quantification of the surface γ2 levels in C. Relative γ2 surface level is represented by a ratio of surface γ2 intensity in transfected cells to that of surrounding nontransfected cells. The ratios were further normalized by the average of the control sample transfected with the scramble shRNA. Scr: scramble shRNA. 25: SNAP25 shRNA. 23: SNAP23 shRNA. n = 25–30 neurons for each group. Five processes were selected from each neuron. Asterisks indicate statistical significances. n.s., no statistical significance.
Fig. 3.
Fig. 3.
Effects of of SNAP25 and SNAP23 on synaptic surface expression of GluA2 and γ2S and basal synaptic transmission. (A) Knockdown of SNAP25, but not SNAP23, reduces the surface GluA2 at the excitatory postsynaptic membrane. Scramble, SNAP25, or SNAP23 shRNA were coexpressed with EGFP (to label transfected neurons) in hippocampal neurons for 72 h. (Top) Surface GluA2 (s-GluA2). (Middle) VGluT. (Bottom) White puncta showing colocalization of s-GluA2 (magenta) and VGluT (green). Synaptic surface GluA2 in shRNA-transfected cells (shRNA) was compared with nontransfected cells (−) on the same coverslip. Yellow arrows at the corresponding locations in all three panels indicate the s-GluA2, VGluT, and overlaid signals at the same synapse. (Scale bar: 10 µm.) (B) Quantification of the synaptic surface GluA2 in A. In each shRNA-transfected neuron, relative synaptic surface GluA2 was computed as a ratio of the surface synaptic GluA2 of transfected neurons to that of nontransfected neurons. The ratio in each sample was normalized by the average of the scramble shRNA control. Scr: scramble shRNA. 25: SNAP25 shRNA. 23: SNAP23 shRNA. n = 18–22 for shRNA-transfected neurons. Ten synapses were selected in each transfected neuron and nontransfected neurons. (C) Knockdown of SNAP23, but not SNAP25, reduces the surface γ2 at the inhibitory postsynaptic membrane. Scramble, SNAP23, or SNAP25 shRNA were coexpressed with EGFP (to label transfected neurons) for 72 h. (Scale bar: 10 µm.) (D) Quantification of the surface synaptic γ2 in C was performed similarly as in B. n = 28∼30 for shRNA-transfected neurons. (E and G) Whole-cell recordings were performed on hippocampal neurons 3 d after transfection of scramble (Scr), SNAP25 (25), or SNAP23 shRNAs (23). Representative traces of spontaneous AMPA receptor-mediated mEPSCs and GABAA receptor-mediated mIPSCs for each group are shown in E and G, respectively. (F) Quantification of AMPA mEPSC amplitudes in E. SNAP25-knockdown neurons have significantly smaller amplitudes than control (Mann–Whitney test, P < 0.01). Scramble shRNA = −18.2 ± 0.65 pA, SNAP25 shRNA = −15.1 ± 0.69 pA, SNAP23 shRNA = −17.2 ± 1.63 pA. n = 11–14 for each group. (H) Quantification of GABAA mIPSC amplitudes in G. SNAP23 knockdown neurons have significantly smaller amplitudes than control (Mann–Whitney test, P < 0.001). Scramble shRNA = −55.8 ± 4.67 pA, SNAP23 shRNA = −31.8 ± 2.99 pA, SNAP25 shRNA = −51.3 ± 4.55 pA. n = 10–13 for each group. Asterisks indicate statistical significances. n.s., no statistical significance.
Fig. 4.
Fig. 4.
Syntaxin1, VAMP2, and specific Rab proteins regulate exocytosis of GluA2 and γ2S. (AC) Syntaxin1A (A), syntaxin1B (B), and VAMP2 (C) are required for exocytosis of γ2S and GluA2. Scramble shRNA (Scr), syntaxin1A (STX1A), syntaxin1B (STX1B), or VAMP2 shRNA (VAMP2) and shRNA-resistant syntaxin1A (1A), syntaxin1B (1B), or VAMP2 (2) were coexpressed with pH receptors for 48 h. (DG) Effects of dominant negative Rabs on exocytosis of GluA2 and γ2S. Rab8(T22N) (D), Rab4(S22N) (E), Rab5(S34N) (F), Rab11(S25N) (G), or empty vector was coexpressed with pH receptors for 24 h. The same empty vector control was used in DG. Asterisks indicate statistical significances. n.s., no statistical significance.
Fig. 5.
Fig. 5.
GluA2 and γ2S are inserted into different domains of the somatic plasma membrane. (A) pH-γ2S and pH-GluA2 are inserted into different domains of the somatic plasma membrane. (Left) Neuron morphology under TIRFM. (Middle) Spatial location and intensity (shown in colors) of events for pH-GluA2 (n = 545) and pH-γ2S (n = 1,559) accumulating from 14 s. (Right) Heat map showing spatial density distributions of the events in the middle panel. Event density was calculated as the number of events per second per 100 µm2 within a circular region (diameter: 0.48 µm). (B) Exocytosis of pH-γ2S and tdt-GluA2 in the same cell. Green and magenta rectangular regions represent the same somatic region for pH-γ2S and tdt-GluA2, respectively. (Scale bar: 5 µm.) (C) Quantification of exocytic events of pH-γ2S (green) and tdt-GluA2 (magenta) in the region shown in B. Normalized numbers of events along the long axis of the selected region were plotted against the distance from the center (maximal distances from the center on both directions were normalized as 50% and −50%). (DG) Averaged distributions of exocytic events of pH-γ2S and tdt-GluA2 (D), pH-GluA2 and tdt-γ2S (E), pH-GluA2 and tdt-GluA2 (F), and pH-γ2S and tdt-γ2S (G). Green and magenta curves represent exocytic event of pH and tdt receptors, respectively. n = 13–17 for each group. (H and I) Effects of dominant negative Rabs on exocytic event distributions of GluA2 (H) and γ2S (I). Empty vector (−), Rab8(T22N), Rab4(S22N), Rab5(S34N), or Rab11(S25N) was coexpressed with pH receptors. n = 16–20 for each group. Asterisks indicate statistical significance compared with empty vector control.
Fig. S9.
Fig. S9.
Distributions of exocytosis of AMPA and GABAA receptors on the plasma membrane under coexpression of GluA1 or GluA3. (A) Demonstration of event detection by automated program. A raw image of pH-GluA2 from TIRF imaging was first obtained (Left). Event enhancement filtering was applied to reduce the noise (Middle). Objects with high intensity were then identified as events and their locations in the image were calculated (Right). (B) Averaged distribution of insertion events of pH-γ2S and tdt-GluA2 with coexpression of GluA1. The green and magenta curves represent the exocytic event distributions of pH-γ2S and tdt-GluA2, respectively. n = 17. (C) Averaged distribution of insertion events of pH-GluA2 and tdt-γ2S with coexpression of GluA1. The green and magenta curves represent the exocytic event distributions of pH-GluA2 and tdt-γ2S, respectively. n = 16. (D) Averaged distribution of insertion events of pH-γ2S and tdt-GluA2 with coexpression of GluA3. The green and magenta curves represent the exocytic event distributions of pH-γ2S and tdt-GluA2, respectively. n = 12. (E) Averaged distribution of the insertion events of pH-GluA2 and tdt-γ2S with coexpression of GluA3. The green and magenta curves represent the exocytic event distributions of pH-GluA2 and tdt-γ2S, respectively. n = 13. Asterisk indicates statistical significance.
Fig. 6.
Fig. 6.
GluA2 and γ2S are trafficked in different vesicles when they exit the Golgi apparatus. (A) Time series of a post-Golgi trafficking vesicle containing only EGFP-GluA2, but not tdt-γ2S, as indicated by arrows at corresponding locations. (Top) EGFP-GluA2. (Middle) tdt-γ2S. (Bottom) Overlay of top and middle panels. (Scale bar: 2.5 µm.) The kymographs show the trafficking of the vesicle along its trajectory for EGFP-GluA2, tdt-γ2S and overlaid signal. (B) Time series of a post-Golgi trafficking vesicle containing only EGFP-γ2S, but not tdt-GluA2. (C) Quantification of cotrafficking events of EGFP- and tdt-tagged receptors after exit the Golgi apparatus. Asterisks indicate statistical significances.
Fig. S10.
Fig. S10.
The trafficking of EGFP- or tdTomato-tagged GluA2 and γ2S was blocked in Golgi apparatus after 20 °C incubation, and cotrafficking of GluA2 or γ2S with different fluorescent tags when they exit the Golgi apparatus. (A) EGFP-γ2S, tdt-γ2S, EGFP-GluA2, or tdt-GluA2 were expressed in hippocampal neurons at DIV 11. After the incubation at 20 °C, EGFP-γ2S, tdt-γ2S, EGFP-GluA2, or tdt-GluA2 were stained by anti-GFP or tdTomato antibodies with a costaining of Golgi marker GM130. In the overlaid images, magenta shows the GM130 staining and green shows the staining of EGFP- or tdTomato-tagged receptors. (Scale bar: 20 µm.) (B) Time series of an example of a post-Golgi trafficking vesicle containing EGFP-γ2S and tdt-γ2S, as indicated by arrows (green, magenta, and white) at corresponding locations. For each time point, top: time-series images of EGFP-γ2S; middle: time-series images of tdt-γ2S; bottom: overlaid time-series images of top and middle panels. (Scale bar: 2.5 µm.) See Movie S6 for complete time lapse. The kymographs show the trafficking of the vesicle along its trajectory for EGFP-γ2S, tdt-γ2S, and overlaid signal. (C) Similar to B, time series of an example of a post-Golgi trafficking vesicle containing EGFP-GluA2 and tdt- GluA2, as indicated by arrows (green, magenta, and white) at corresponding locations. See Movie S6 for complete time lapse.
Fig. 7.
Fig. 7.
Endogenous AMPA and GABAA receptors are sorted into different vesicles. (A) Subcellular fractionation of adult rat brain. Each fraction was normalized based on protein concentration. H, whole brain homogenate; P1, cell debris and nuclei; P2, washed synaptosomal fraction; P3, microsomal pellet; S1, postnuclear supernatant; S2, postsynaptosomal fraction; S3, soluble protein fraction. (B and C) Morphology of vesicles inP3 fraction under EM. (Scale bars: B, 500 nm; C, 100 nm.) (D) Double-immunogold EM of GluA2 and γ2 in P3 sections. GluA2 and γ2 were labeled by 6-nm (arrows) and 12-nm (arrow heads) immunogold beads, respectively. (Scale bar: 100 nm.) (E) Quantification of vesicles containing GluA2 or γ2 observed under double-immunogold EM. Green: GluA2-only vesicles (37% of all vesicles). Magenta: γ2-only vesicles (51%). Purple: GluA2 and γ2-containing vesicles (12%). n = 73. (F) Vesicular sorting model for constitutive exocytosis of AMPA and GABAA receptors.

References

    1. Shepherd JD, Huganir RL. The cell biology of synaptic plasticity: AMPA receptor trafficking. Annu Rev Cell Dev Biol. 2007;23:613–643. - PubMed
    1. Jacob TC, Moss SJ, Jurd R. GABA(A) receptor trafficking and its role in the dynamic modulation of neuronal inhibition. Nat Rev Neurosci. 2008;9(5):331–343. - PMC - PubMed
    1. Craig AM, Blackstone CD, Huganir RL, Banker G. Selective clustering of glutamate and gamma-aminobutyric acid receptors opposite terminals releasing the corresponding neurotransmitters. Proc Natl Acad Sci USA. 1994;91(26):12373–12377. - PMC - PubMed
    1. Maletic-Savatic M, Koothan T, Malinow R. Calcium-evoked dendritic exocytosis in cultured hippocampal neurons. Part II: Mediation by calcium/calmodulin-dependent protein kinase II. J Neurosci. 1998;18(17):6814–6821. - PMC - PubMed
    1. Lledo PM, Zhang X, Südhof TC, Malenka RC, Nicoll RA. Postsynaptic membrane fusion and long-term potentiation. Science. 1998;279(5349):399–403. - PubMed

Publication types

LinkOut - more resources