

An Integrated Bayesian Nonparametric Approach for Stochastic and Variability Orders in ROC Curve Estimation: An Application to Endometriosis Diagnosis
- PMID: 26839441
- PMCID: PMC4733471
- DOI: 10.1080/01621459.2015.1023806
An Integrated Bayesian Nonparametric Approach for Stochastic and Variability Orders in ROC Curve Estimation: An Application to Endometriosis Diagnosis
Abstract
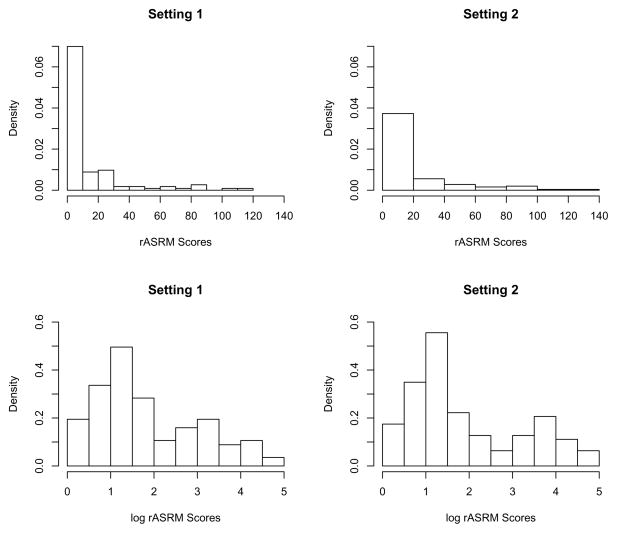
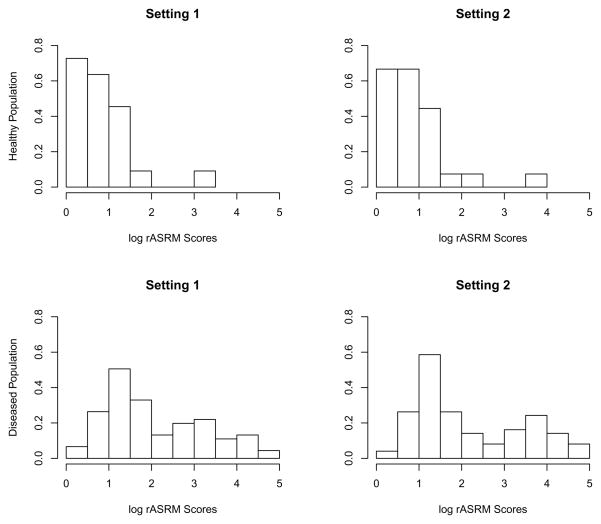
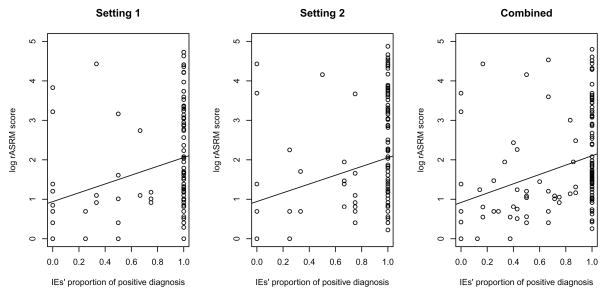
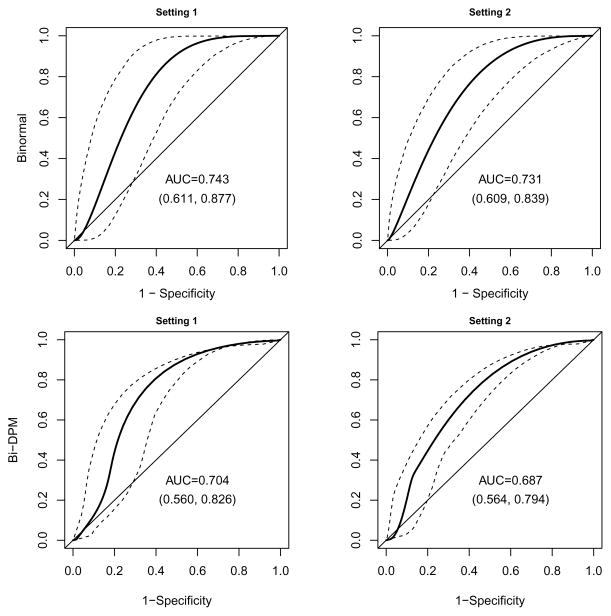
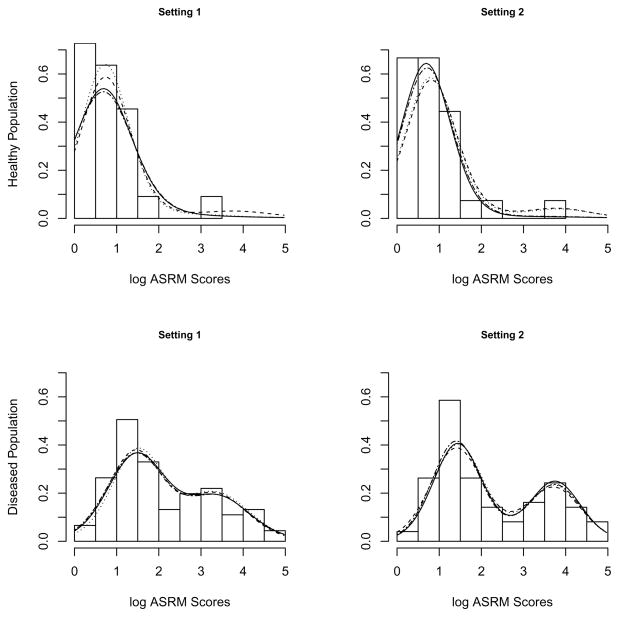
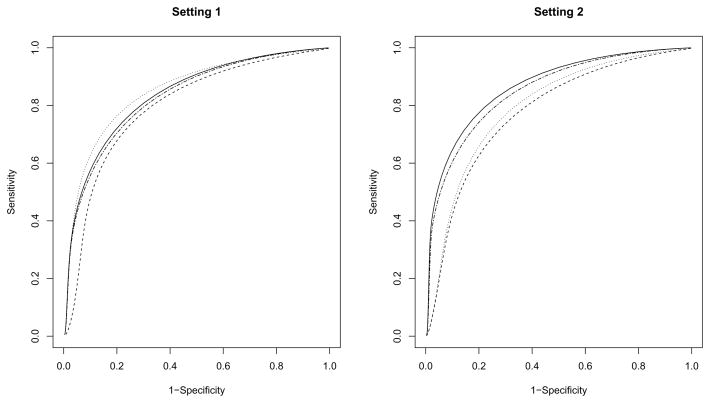
In estimating ROC curves of multiple tests, some a priori constraints may exist, either between the healthy and diseased populations within a test or between tests within a population. In this paper, we proposed an integrated modeling approach for ROC curves that jointly accounts for stochastic and variability orders. The stochastic order constrains the distributional centers of the diseased and healthy populations within a test, while the variability order constrains the distributional spreads of the tests within each of the populations. Under a Bayesian nonparametric framework, we used features of the Dirichlet process mixture to incorporate these order constraints in a natural way. We applied the proposed approach to data from the Physician Reliability Study that investigated the accuracy of diagnosing endometriosis using different clinical information. To address the issue of no gold standard in the real data, we used a sensitivity analysis approach that exploited diagnosis from a panel of experts. To demonstrate the performance of the methodology, we conducted simulation studies with varying sample sizes, distributional assumptions and order constraints. Supplementary materials for this article are available online.
Keywords: Area under the curve; Dirichlet process mixture; Gold standard; Order restricted analysis.
Figures
Similar articles
-
Estimation of multiple ordered ROC curves using placement values.Stat Methods Med Res. 2022 Aug;31(8):1470-1483. doi: 10.1177/09622802221094940. Epub 2022 Apr 21. Stat Methods Med Res. 2022. PMID: 35450477 Free PMC article.
-
A Bayesian semiparametric approach to correlated ROC surfaces with stochastic order constraints.Biometrics. 2019 Jun;75(2):539-550. doi: 10.1111/biom.12997. Epub 2019 Mar 29. Biometrics. 2019. PMID: 30390405
-
Sample size calculations for ROC studies: parametric robustness and Bayesian nonparametrics.Stat Med. 2012 Jan 30;31(2):131-42. doi: 10.1002/sim.4396. Epub 2011 Dec 5. Stat Med. 2012. PMID: 22139729
-
A correlated Bayesian rank likelihood approach to multiple ROC curves for endometriosis.Stat Med. 2019 Apr 15;38(8):1374-1385. doi: 10.1002/sim.8043. Epub 2018 Nov 12. Stat Med. 2019. PMID: 30421556
-
Statistical Methods for Phenotype Estimation and Analysis Using Electronic Health Records [Internet].Washington (DC): Patient-Centered Outcomes Research Institute (PCORI); 2021 Mar. Washington (DC): Patient-Centered Outcomes Research Institute (PCORI); 2021 Mar. PMID: 39133799 Free Books & Documents. Review.
Cited by
-
Order-restricted inference for clustered ROC data with application to fingerprint matching accuracy.Biometrics. 2020 Sep;76(3):863-873. doi: 10.1111/biom.13177. Epub 2019 Dec 4. Biometrics. 2020. PMID: 31725175 Free PMC article.
-
Estimation of multiple ordered ROC curves using placement values.Stat Methods Med Res. 2022 Aug;31(8):1470-1483. doi: 10.1177/09622802221094940. Epub 2022 Apr 21. Stat Methods Med Res. 2022. PMID: 35450477 Free PMC article.
-
Preoperative imaging of deep endometriosis: pitfalls of a diagnostic test before surgery.Facts Views Vis Obgyn. 2021 Jan 8;12(4):265-271. Facts Views Vis Obgyn. 2021. PMID: 33575675 Free PMC article.
-
Discriminatory capacity of prenatal ultrasound measures for large-for-gestational-age birth: A Bayesian approach to ROC analysis using placement values.Stat Biosci. 2022 Apr;14(1):1-22. doi: 10.1007/s12561-021-09311-9. Epub 2021 Jun 5. Stat Biosci. 2022. PMID: 35342482 Free PMC article.
-
Diagnostic test evaluation methodology: A systematic review of methods employed to evaluate diagnostic tests in the absence of gold standard - An update.PLoS One. 2019 Oct 11;14(10):e0223832. doi: 10.1371/journal.pone.0223832. eCollection 2019. PLoS One. 2019. PMID: 31603953 Free PMC article.
References
-
- Alonzo TA, Pepe MS. Distribution-free ROC analysis using binary regression techniques. Biostatistics. 2002;3:421–432. - PubMed
-
- Antoniak CE. Mixtures of Dirichlet processes with applications to nonparametric problems. The Annals of Statistics. 1974;2:1152–1174.
-
- Bamber D. The area above the ordinal dominance graph and the area below the receiver operating characteristic graph. Journal of Mathematical Psychology. 1975;12:387–415.
-
- Branscum AJ, Gardner IA, Johnson WO. Estimation of diagnostic-test sensitivity and specificity through Bayesian modeling. Preventive Veterinary Medicine. 2005;68:145–163. - PubMed
-
- Branscum AJ, Johnson WO, Hanson TE, Gardner IA. Bayesian semiparametric ROC curve estimation and disease diagnosis. Statistics in Medicine. 2008;27:2474–2496. - PubMed
Grants and funding
LinkOut - more resources
Full Text Sources
Other Literature Sources