. 2016 Feb 1:8:5.
doi: 10.1186/s13321-016-0116-8. eCollection 2016.

Fragmentation trees reloaded

Affiliations

Fragmentation trees reloaded

Sebastian Böcker et al. J Cheminform. .

Abstract

Background: Untargeted metabolomics commonly uses liquid chromatography mass spectrometry to measure abundances of metabolites; subsequent tandem mass spectrometry is used to derive information about individual compounds. One of the bottlenecks in this experimental setup is the interpretation of fragmentation spectra to accurately and efficiently identify compounds. Fragmentation trees have become a powerful tool for the interpretation of tandem mass spectrometry data of small molecules. These trees are determined from the data using combinatorial optimization, and aim at explaining the experimental data via fragmentation cascades. Fragmentation tree computation does not require spectral or structural databases. To obtain biochemically meaningful trees, one needs an elaborate optimization function (scoring).

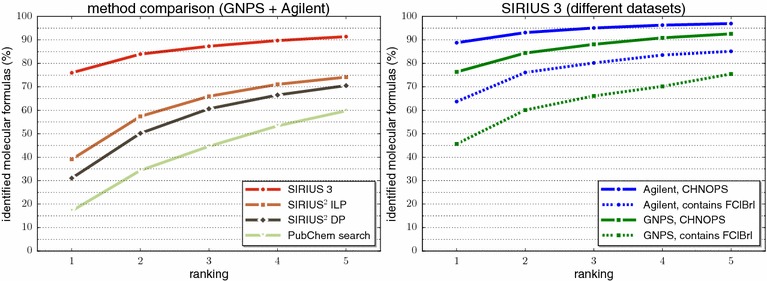
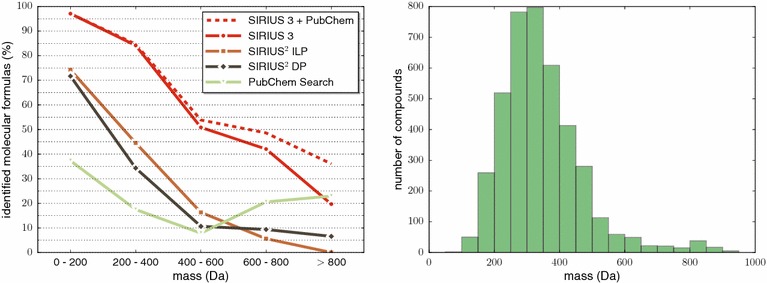
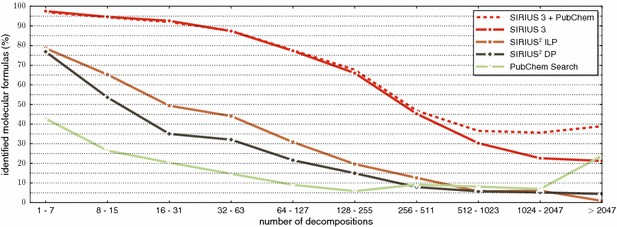
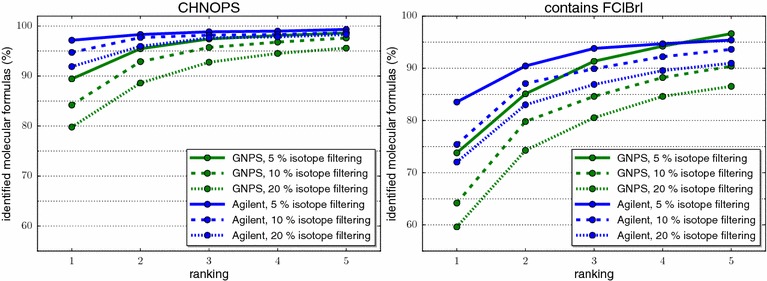
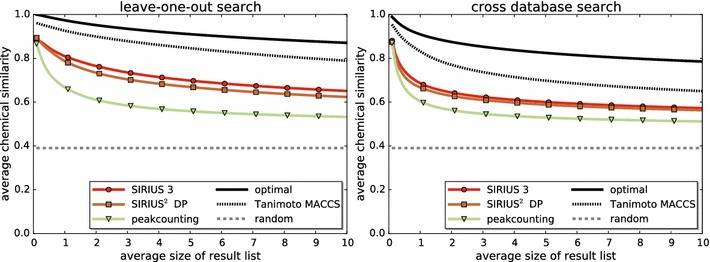
Results: We present a new scoring for computing fragmentation trees, transforming the combinatorial optimization into a Maximum A Posteriori estimator. We demonstrate the superiority of the new scoring for two tasks: both for the de novo identification of molecular formulas of unknown compounds, and for searching a database for structurally similar compounds, our method SIRIUS 3, performs significantly better than the previous version of our method, as well as other methods for this task.

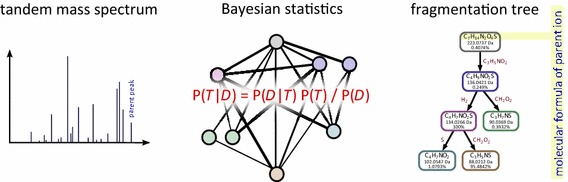
Conclusion: SIRIUS 3 can be a part of an untargeted metabolomics workflow, allowing researchers to investigate unknowns using automated computational methods.Graphical abstractWe present a new scoring for computing fragmentation trees from tandem mass spectrometry data based on Bayesian statistics. The best scoring fragmentation tree most likely explains the molecular formula of the measured parent ion.

Keywords: Computational methods; Fragmentation trees; Mass spectrometry; Metabolites; Natural products.


Figures

Graphical abstract
Graphical abstract
We present a new scoring for computing fragmentation trees from tandem mass spectrometry data based on Bayesian statistics. The best scoring fragmentation tree most likely explains the molecular formula of the measured parent ion
Fig. 1
Fig. 1
Number of molecular formulas that match the mass of some precursor peak in the Agilent and GNPS dataset, using the maximum of 10 ppm and 2 mDa as allowed mass deviation. Note the logarithmic scale of the y-axis. SIRIUS 3 restricts the set of candidate molecular formulas solely by the non-negative ring double bond equivalent (RDBE) rule (green), see (3). More restrictive filtering such as the Seven Golden Rules [20] (orange) further reduce the number of molecular formulas to be considered; nevertheless, multiple explanations remain for most precursor ions. We find that 1.6 % of the compounds in our datasets violate the Seven Golden Rules. We also report the number of molecular formulas found in PubChem for the above mentioned mass accuracy
Fig. 2
Fig. 2
Example of a fragmentation tree. Left the molecular structure of Nateglinide. Right the measured MS/MS spectrum of Nateglinide from the GNPS dataset. Middle the FT computed from the MS/MS spectrum. Each node is labeled with the molecular formula of the corresponding ion, and each edge is labeled with the molecular formula of the corresponding loss. For nodes, we also report m/z and relative intensity of the corresponding peak. We stress that the FT is computed without any knowledge of the molecular structure and without using any database, but solely from the MS/MS spectrum
Fig. 3
Fig. 3
Analysis Workflow. After importing the tandem mass spectra of a compound, all molecular formulas within the mass accuracy of the parent peak are generated (3). Each of these candidates is then scored (47) and, finally, candidates are sorted with respect to this score (8). To score a candidate molecular formula, we compute the fragmentation graph with the candidate formula being the root (4); score the edges of the graph using Bayesian statistics (5); find the best-scoring FT in this graph using combinatorial optimization (6); finally, we use hypothesis-driven recalibration to find a best match between theoretical and observed peak masses (7), recalibrate, and repeat steps (46) for this candidate formula. In our evaluation, we compare the output list with the true answer (9)
Fig. 4
Fig. 4
Performance evaluation, percentage of instances (y-axis) where the correct molecular formula is present in the top k for k=1,,5 (x-axis). Left performance evaluation for different methods on both datasets. Methods are “SIRIUS 3” (the method presented here), “SIRIUS2-ILP” (scores from [41, 42] solved by integer linear programming), “SIRIUS2-DP” (scores from [41, 42] solved by dynamic programming), and “PubChem search” (searching PubChem for the closest precursor mass). Right performance of SIRIUS 3 for the two compound batches (CHNOPS as solid line, “contains FClBrI” as dashed line) and the two datasets (GNPS green, Agilent blue)
Fig. 5
Fig. 5
Left identification rates of all methods in dependence on the mass of the compound, compare to Fig. 4. Restricting SIRIUS 3 to molecular formulas from PubChem is included for comparison. Right histogram for masses of all compounds in the two datasets, bin width 50 Da
Fig. 6
Fig. 6
Identification rates of SIRIUS 3, SIRIUS2-ILP and SIRIUS2-DP depending on the number of candidate molecular formulas: that is, the number of decompositions of the precursor mass that have non-negative RDBE, see (3). Searching PubChem by precursor mass, and restricting SIRIUS 3 to molecular formulas from PubChem are included for comparison
Fig. 7
Fig. 7
Performance evaluation of SIRIUS 3 when adding isotope information, percentage of instances (y-axis) where the correct answer is present in the top k for k=1,,10 (x-axis). Isotope pattern filtering efficiency 5 % (solid), 10 % (dashed), and 20 % (dotted). Batch CHNOPS (left) and “contains FClBrI” (right), datasets GNPS (green) and Agilent (blue)
Fig. 8
Fig. 8
Left histogram of running times of all instances (compounds) in the two datasets. Right cumulative distribution of running times
Fig. 9
Fig. 9
Similarity search performance plots for chemical similarity. Methods “SIRIUS 3” and “SIRIUS2-DP” compare trees via tree alignments [42]. Method “peak counting” uses direct spectral comparison. Method “MACCS” uses fingerprints computed from the structure of the compound. Left similarity search results using leave-one-out evaluation on both datasets. Right similarity search across databases: compounds from GNPS are searched in Agilent, and vice-versa
Fig. 10
Fig. 10
Left histogram of compounds from KEGG that show a particular ratio of hetero atoms except oxygen, and carbon atoms (green); histogram of all decompositions of compound masses from KEGG over the alphabet CHNOPS with mass accuracy 10 ppm (red). We observe that compounds from KEGG [56] have relatively small ratios, whereas this ratio can get arbitrarily large for the decompositions that, in most cases, do not correspond to true molecules. Normalized density of the prior (dashed). Right histogram of the corrected RDBE values from (4) (green); histogram of all decompositions (red); normalized density of the prior (dashed)
Fig. 11
Fig. 11
Left normalized histogram of the mass error distribution, for the GNPS dataset. Right normalized histogram of the noise peak intensity distribution and fitted Pareto distribution (dashed line), for the GNPS dataset
Fig. 12
Fig. 12
Loss mass distribution, after the final round of parameter estimation. Frequencies of the losses are weighted by the intensity of their peaks. The frequency of the identified common losses have been decreased to the value of the log-normal distribution. Left normalized histogram for bin width 17 Da (green). Right kernel density estimation (green). Maximum likelihood estimate of the log-normal distribution drawn in both plots (black, dashed)

References

    1. Baker M. Metabolomics: from small molecules to big ideas. Nat Methods. 2011;8:117–121. doi: 10.1038/nmeth0211-117. - DOI
    1. Patti GJ, Yanes O, Siuzdak G. Metabolomics: the apogee of the omics trilogy. Nat Rev Mol Cell Biol. 2012;13(4):263–269. doi: 10.1038/nrm3314. - DOI - PMC - PubMed
    1. Stein SE. Mass spectral reference libraries: an ever-expanding resource for chemical identification. Anal Chem. 2012;84(17):7274–7282. doi: 10.1021/ac301205z. - DOI - PubMed
    1. Horai H, Arita M, Kanaya S, Nihei Y, Ikeda T, Suwa K, et al. MassBank: a public repository for sharing mass spectral data for life sciences. J Mass Spectrom. 2010;45(7):703–714. doi: 10.1002/jms.1777. - DOI - PubMed
    1. Wishart DS, Knox C, Guo AC, Eisner R, Young N, Gautam B, et al. HMDB: a knowledgebase for the human metabolome. Nucleic Acids Res. 2009;37:D603–D610. doi: 10.1093/nar/gkn810. - DOI - PMC - PubMed