

Functional versus Nonfunctional Rehabilitation in Chronic Ischemic Stroke: Evidences from a Randomized Functional MRI Study
- PMID: 26839716
- PMCID: PMC4709724
- DOI: 10.1155/2016/6353218
Functional versus Nonfunctional Rehabilitation in Chronic Ischemic Stroke: Evidences from a Randomized Functional MRI Study
Abstract
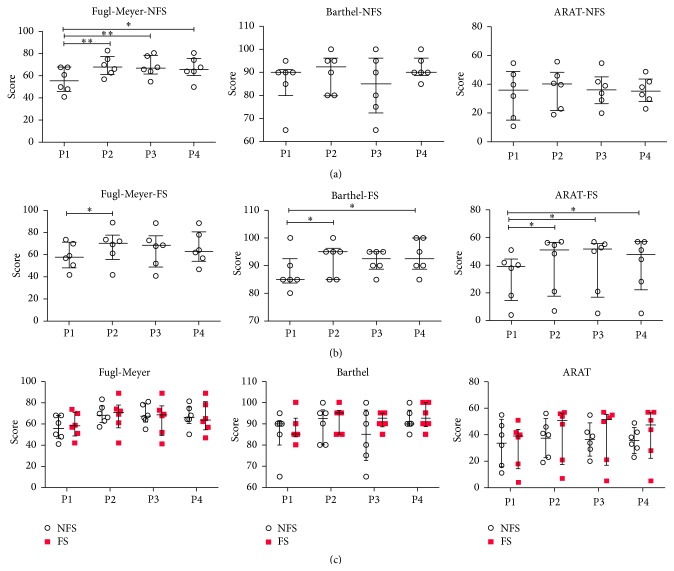
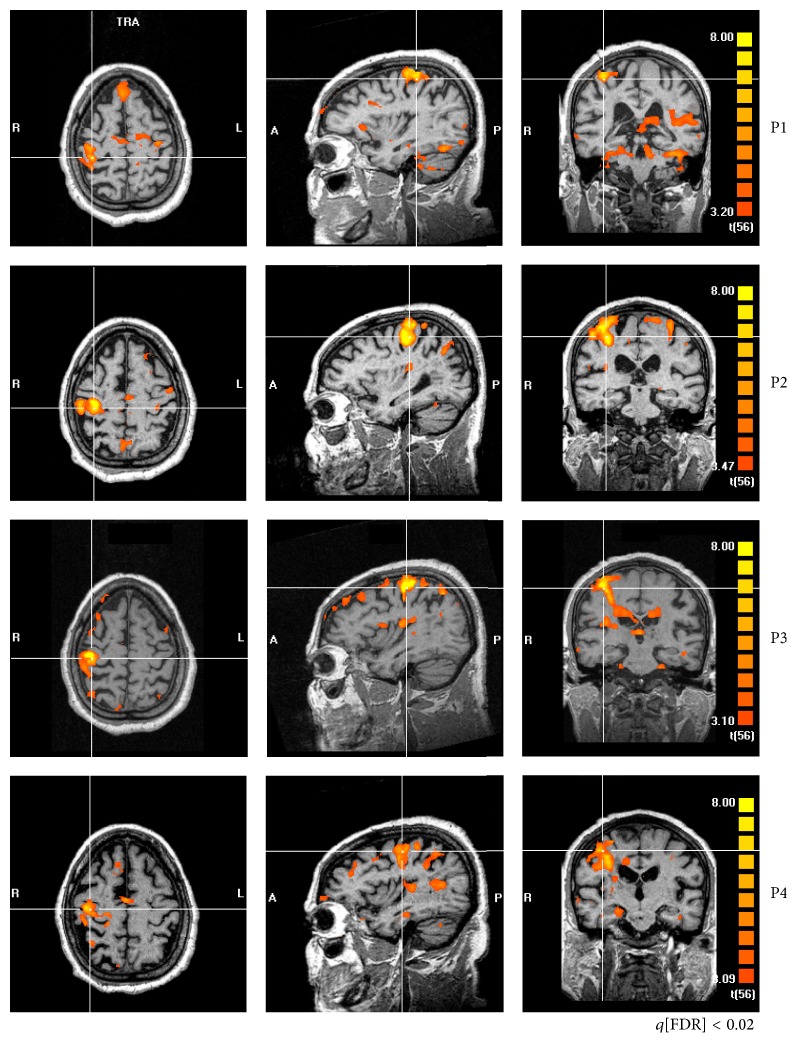
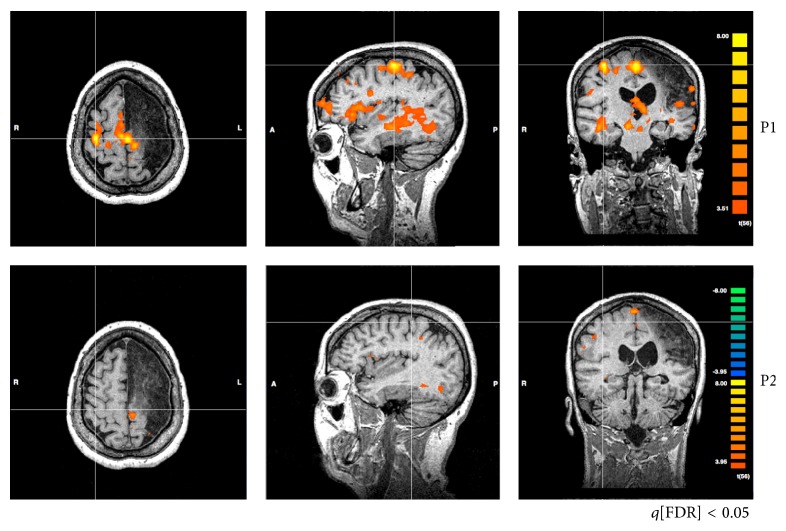
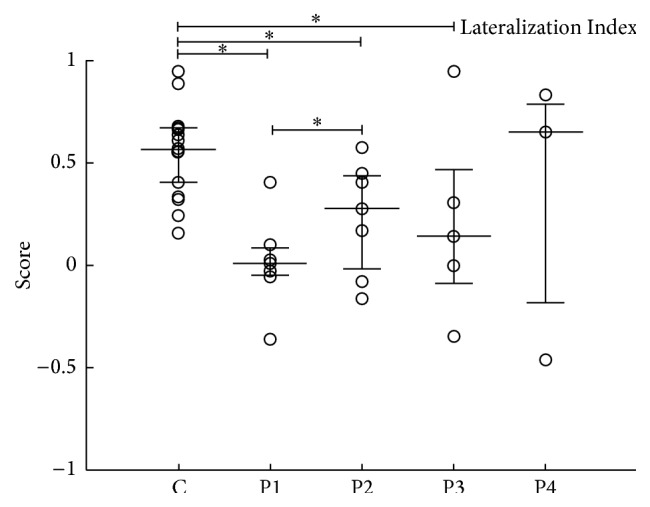
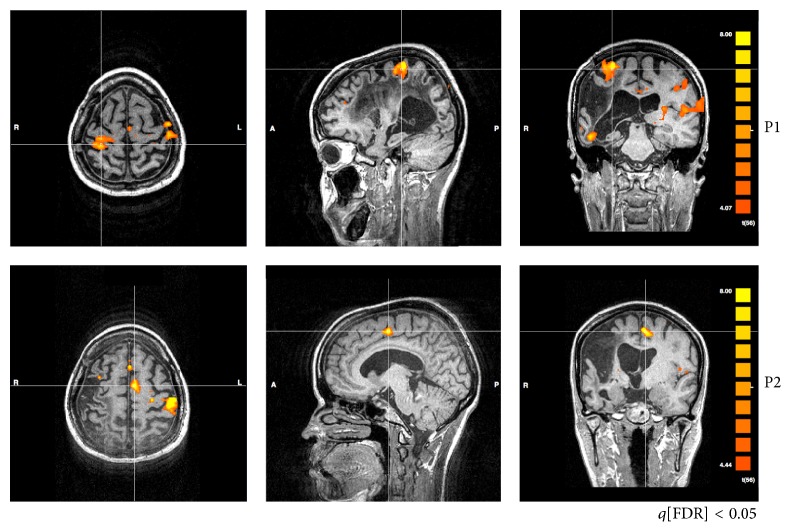
Motor rehabilitation of stroke survivors may include functional and/or nonfunctional strategy. The present study aimed to compare the effect of these two rehabilitation strategies by means of clinical scales and functional Magnetic Resonance Imaging (fMRI). Twelve hemiparetic chronic stroke patients were selected. Patients were randomly assigned a nonfunctional (NFS) or functional (FS) rehabilitation scheme. Clinical scales (Fugl-Meyer, ARA test, and modified Barthel) and fMRI were applied at four moments: before rehabilitation (P1) and immediately after (P2), 1 month after (P3), and three months after (P4) the end of rehabilitation. The NFS group improved significantly and exclusively their Fugl-Meyer scores at P2, P3, and P4, when compared to P1. On the other hand, the FS group increased significantly in Fugl-Meyer at P2, when compared to P1, and also in their ARA and Barthel scores. fMRI inspection at the individual level revealed that both rehabilitation schemes most often led to decreased activation sparseness, decreased activity of contralesional M1, increased asymmetry of M1 activity to the ipsilesional side, decreased perilesional activity, and decreased SMA activity. Increased M1 asymmetry with rehabilitation was also confirmed by Lateralization Indexes. Our clinical analysis revealed subtle differences between FS and NFS.
Figures
Similar articles
-
Neural correlates of proprioceptive integration in the contralesional hemisphere of very impaired patients shortly after a subcortical stroke: an FMRI study.Neurorehabil Neural Repair. 2008 Mar-Apr;22(2):154-65. doi: 10.1177/1545968307307118. Epub 2007 Oct 4. Neurorehabil Neural Repair. 2008. PMID: 17916656
-
Motor network changes associated with successful motor skill relearning after acute ischemic stroke: a longitudinal functional magnetic resonance imaging study.Neurorehabil Neural Repair. 2009 Mar-Apr;23(3):295-304. doi: 10.1177/1545968308322840. Epub 2008 Nov 4. Neurorehabil Neural Repair. 2009. PMID: 18984831
-
Efficacy of coupling inhibitory and facilitatory repetitive transcranial magnetic stimulation to enhance motor recovery in hemiplegic stroke patients.Stroke. 2013 May;44(5):1375-82. doi: 10.1161/STROKEAHA.111.000522. Epub 2013 Mar 26. Stroke. 2013. PMID: 23532011 Clinical Trial.
-
Activation likelihood estimation meta-analysis of motor-related neural activity after stroke.Neuroimage. 2012 Feb 1;59(3):2771-82. doi: 10.1016/j.neuroimage.2011.10.023. Epub 2011 Oct 17. Neuroimage. 2012. PMID: 22023742 Review.
-
Nuclear medicine in the rehabilitative treatment evaluation in stroke recovery. Role of diaschisis resolution and cerebral reorganization.Eura Medicophys. 2007 Jun;43(2):221-39. Epub 2007 Feb 1. Eura Medicophys. 2007. PMID: 17268387 Review.
Cited by
-
Enhanced Functional Connectivity between the Bilateral Primary Motor Cortices after Acupuncture at Yanglingquan (GB34) in Right-Hemispheric Subcortical Stroke Patients: A Resting-State fMRI Study.Front Hum Neurosci. 2017 Apr 10;11:178. doi: 10.3389/fnhum.2017.00178. eCollection 2017. Front Hum Neurosci. 2017. PMID: 28443010 Free PMC article.
-
Altered effective connectivity of resting state networks by acupuncture stimulation in stroke patients with left hemiplegia: A multivariate granger analysis.Medicine (Baltimore). 2017 Nov;96(47):e8897. doi: 10.1097/MD.0000000000008897. Medicine (Baltimore). 2017. PMID: 29382021 Free PMC article.
-
A Preliminary Study of Alterations in Iron Disposal and Neural Activity in Ischemic Stroke.Biomed Res Int. 2022 Aug 6;2022:4552568. doi: 10.1155/2022/4552568. eCollection 2022. Biomed Res Int. 2022. PMID: 35971446 Free PMC article.
-
Exploring Representation of Diverse Samples in fMRI Studies Conducted in Patients With Cardiac-Related Chronic Illness: A Focused Systematic Review.Front Hum Neurosci. 2020 May 14;14:108. doi: 10.3389/fnhum.2020.00108. eCollection 2020. Front Hum Neurosci. 2020. PMID: 32477079 Free PMC article.
-
Neural Patterns of Reorganization after Intensive Robot-Assisted Virtual Reality Therapy and Repetitive Task Practice in Patients with Chronic Stroke.Front Neurol. 2017 Sep 4;8:452. doi: 10.3389/fneur.2017.00452. eCollection 2017. Front Neurol. 2017. PMID: 28928708 Free PMC article.
References
-
- World Health Organization. World Health Statistics. Geneva, Switzerland: World Health Organization; 2008.
-
- O'Sullivan S. B., Schmitz T. J. Fisioterapia: Avaliação e Tratamento. 3rd 2004.
Publication types
MeSH terms
LinkOut - more resources
Full Text Sources
Other Literature Sources
Medical
