

A Vulnerability Assessment of Fish and Invertebrates to Climate Change on the Northeast U.S. Continental Shelf
- PMID: 26839967
- PMCID: PMC4739546
- DOI: 10.1371/journal.pone.0146756
A Vulnerability Assessment of Fish and Invertebrates to Climate Change on the Northeast U.S. Continental Shelf
Abstract
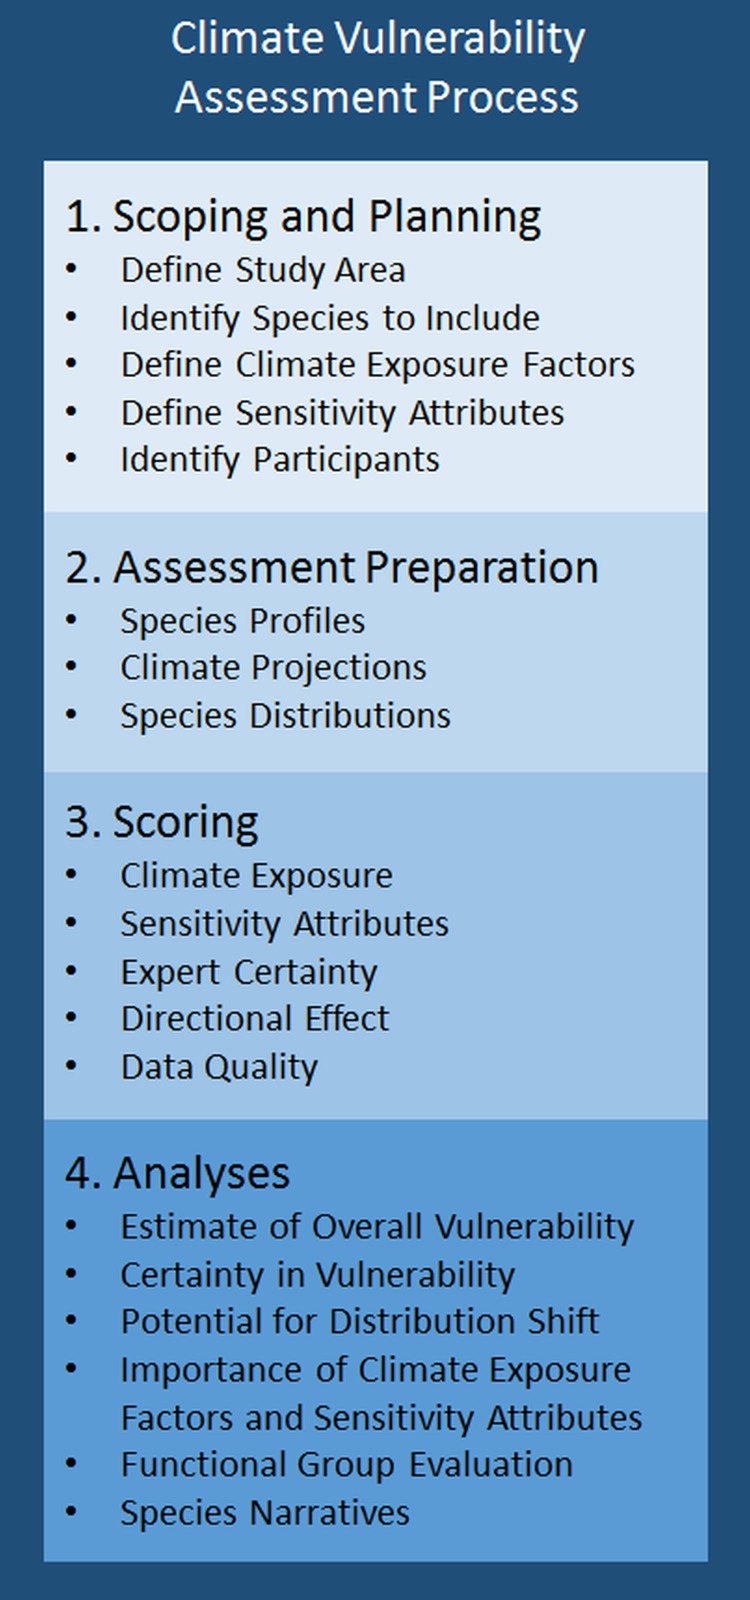
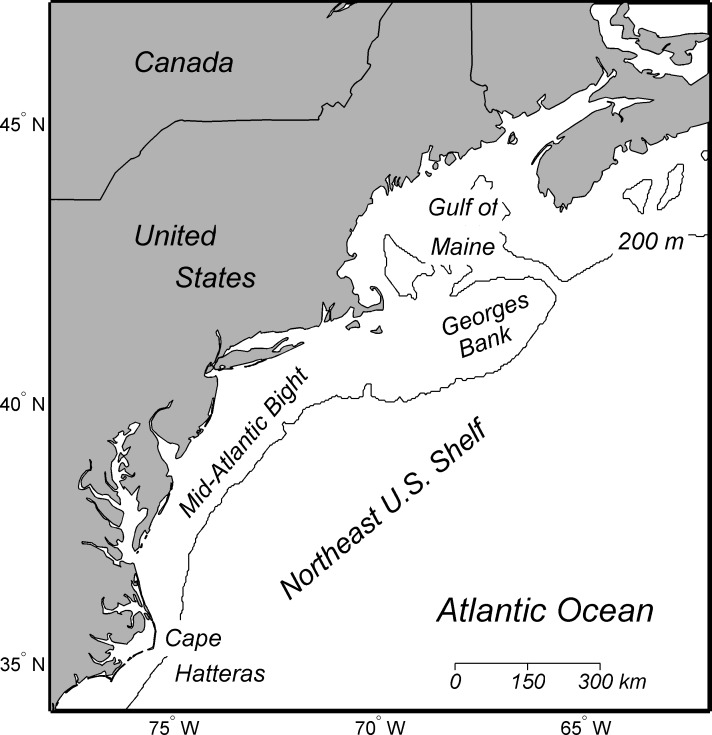
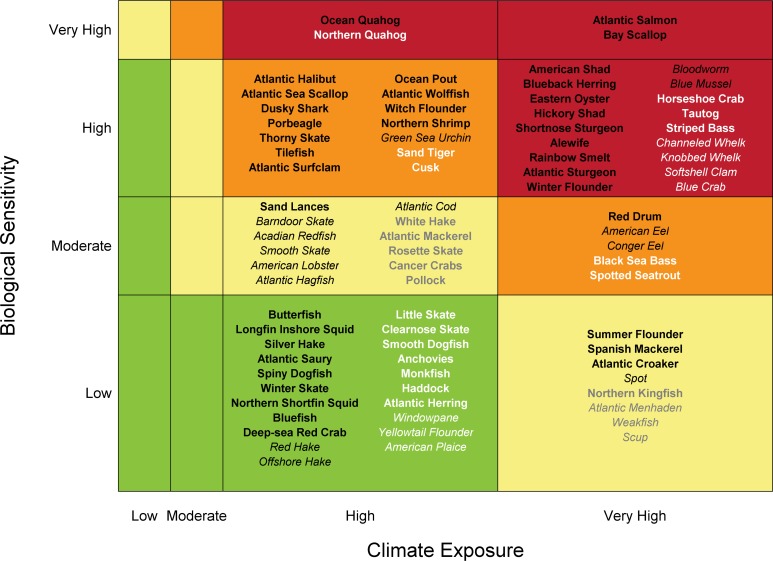
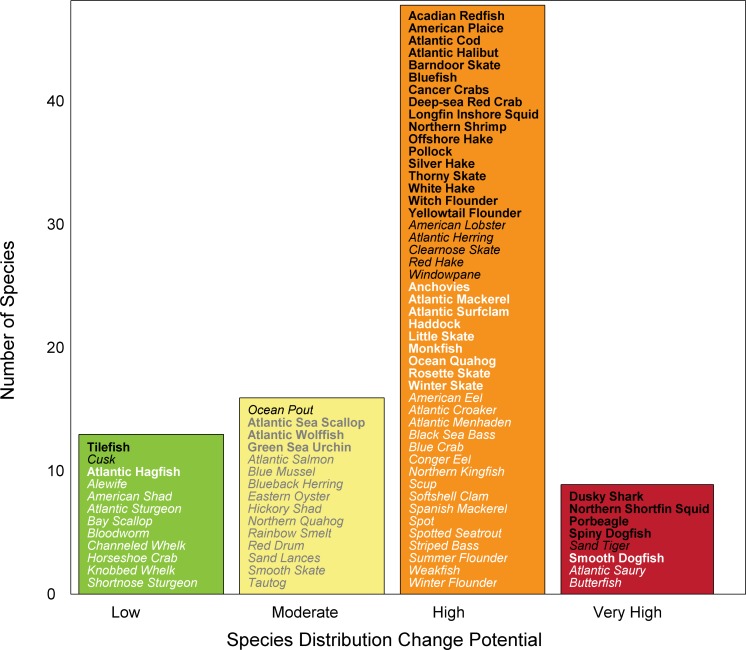
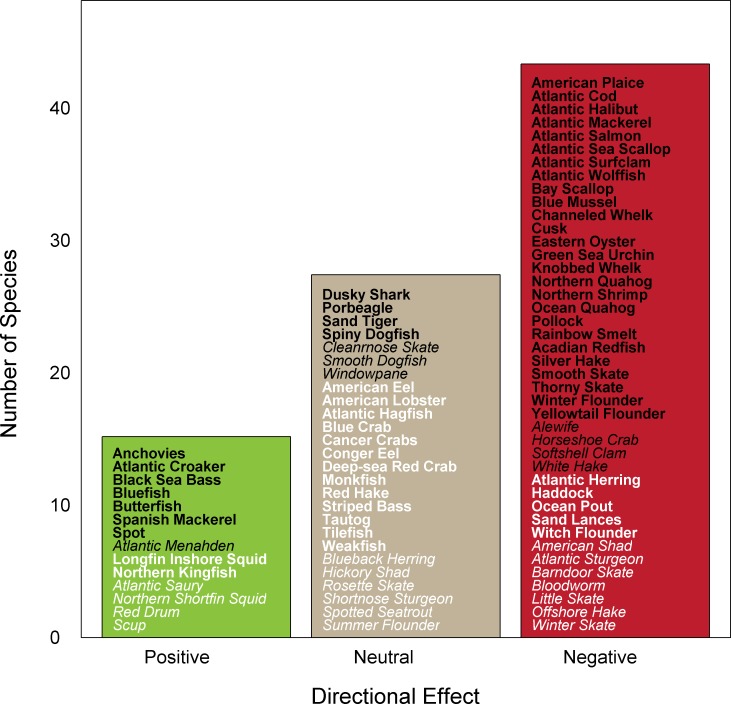
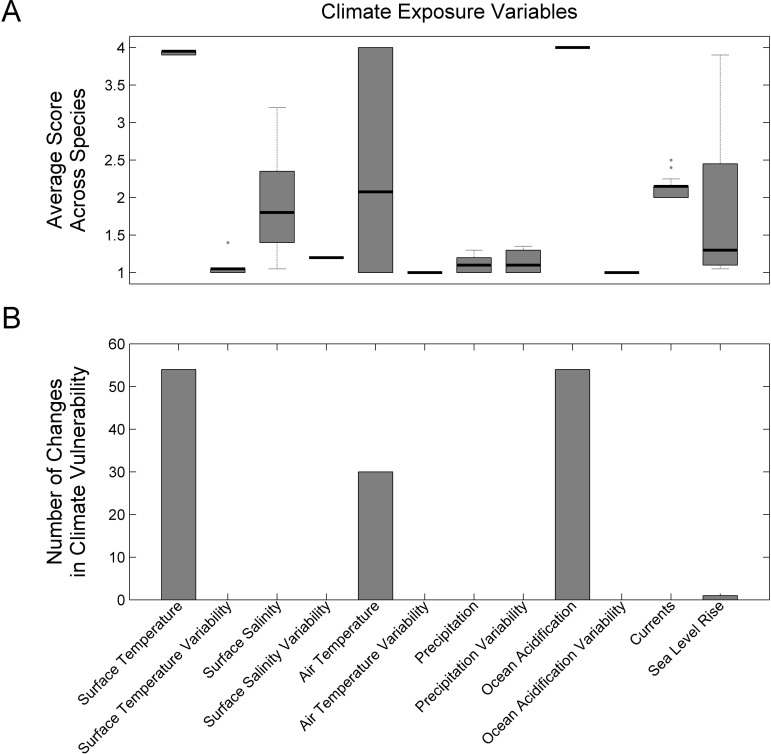
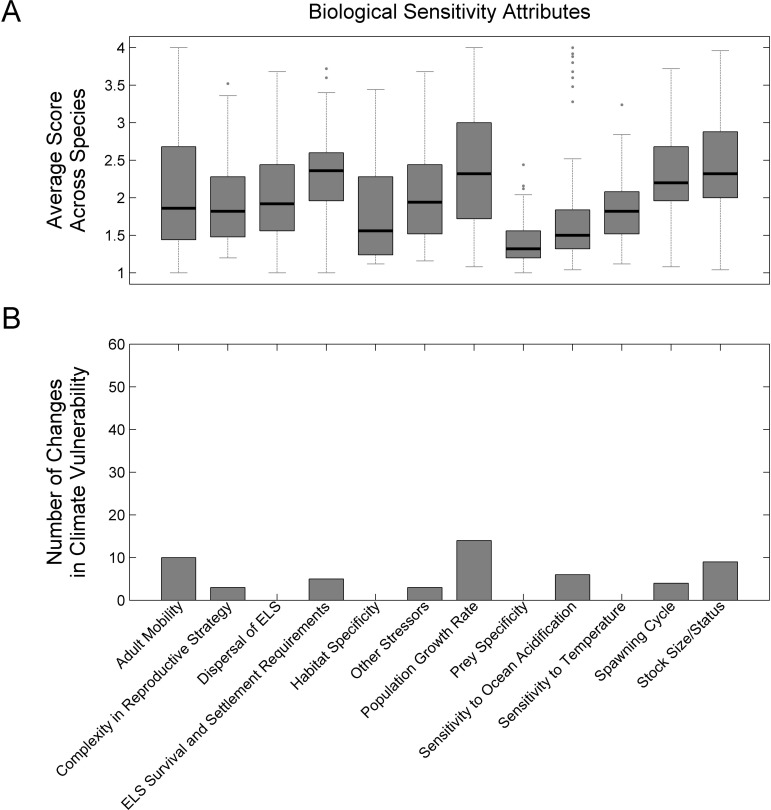
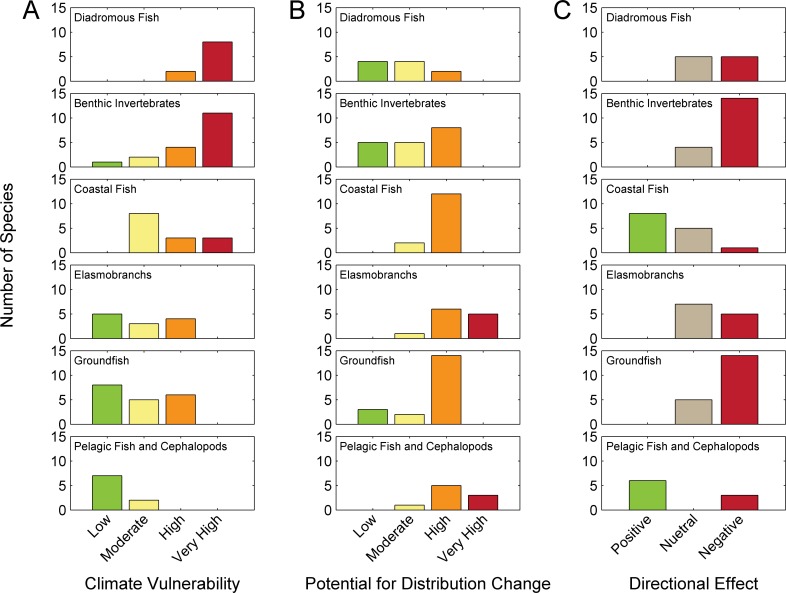
Climate change and decadal variability are impacting marine fish and invertebrate species worldwide and these impacts will continue for the foreseeable future. Quantitative approaches have been developed to examine climate impacts on productivity, abundance, and distribution of various marine fish and invertebrate species. However, it is difficult to apply these approaches to large numbers of species owing to the lack of mechanistic understanding sufficient for quantitative analyses, as well as the lack of scientific infrastructure to support these more detailed studies. Vulnerability assessments provide a framework for evaluating climate impacts over a broad range of species with existing information. These methods combine the exposure of a species to a stressor (climate change and decadal variability) and the sensitivity of species to the stressor. These two components are then combined to estimate an overall vulnerability. Quantitative data are used when available, but qualitative information and expert opinion are used when quantitative data is lacking. Here we conduct a climate vulnerability assessment on 82 fish and invertebrate species in the Northeast U.S. Shelf including exploited, forage, and protected species. We define climate vulnerability as the extent to which abundance or productivity of a species in the region could be impacted by climate change and decadal variability. We find that the overall climate vulnerability is high to very high for approximately half the species assessed; diadromous and benthic invertebrate species exhibit the greatest vulnerability. In addition, the majority of species included in the assessment have a high potential for a change in distribution in response to projected changes in climate. Negative effects of climate change are expected for approximately half of the species assessed, but some species are expected to be positively affected (e.g., increase in productivity or move into the region). These results will inform research and management activities related to understanding and adapting marine fisheries management and conservation to climate change and decadal variability.
Conflict of interest statement
Figures
References
-
- Baumgartner TR, Soutar A, Ferreira-Bartrina V. Reconstruction of the history of Pacific sardine and northern anchovy populations over the past two millennia from sediments of the Santa Barbara Basin, California. CalCOFI Rep. 1992; 33: 24–40.
-
- Hare JA, Able KW. Mechanistic links between climate and fisheries along the east coast of the United States: explaining population outbursts of Atlantic croaker (Micropogonias undulatus). Fish Oceanogr. 2007; 16(1): 31–45. 10.1111/j.1365-2419.2006.00407.x - DOI
-
- Petitgas P, Alheit J, Peck MA, Raab K, Irigoien X, Huret M, et al. 2012. Anchovy population expansion in the North Sea. Mar Ecol Prog Ser. 2012; 444: 1–13. 10.3354/meps09451 - DOI
Publication types
MeSH terms
LinkOut - more resources
Full Text Sources
Other Literature Sources
Medical
