Short Term Survival after Admission for Heart Failure in Sweden: Applying Multilevel Analyses of Discriminatory Accuracy to Evaluate Institutional Performance
- PMID: 26840122
- PMCID: PMC4739586
- DOI: 10.1371/journal.pone.0148187
Short Term Survival after Admission for Heart Failure in Sweden: Applying Multilevel Analyses of Discriminatory Accuracy to Evaluate Institutional Performance
Abstract
Background: Hospital performance is frequently evaluated by analyzing differences between hospital averages in some quality indicators. The results are often expressed as quality charts of hospital variance (e.g., league tables, funnel plots). However, those analyses seldom consider patients heterogeneity around averages, which is of fundamental relevance for a correct evaluation. Therefore, we apply an innovative methodology based on measures of components of variance and discriminatory accuracy to analyze 30-day mortality after hospital discharge with a diagnosis of Heart Failure (HF) in Sweden.
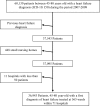
Methods: We analyzed 36,943 patients aged 45-80 treated in 565 wards at 71 hospitals during 2007-2009. We applied single and multilevel logistic regression analyses to calculate the odds ratios and the area under the receiver-operating characteristic (AUC). We evaluated general hospital and ward effects by quantifying the intra-class correlation coefficient (ICC) and the increment in the AUC obtained by adding random effects in a multilevel regression analysis (MLRA). Finally, the Odds Ratios (ORs) for specific ward and hospital characteristics were interpreted jointly with the proportional change in variance (PCV) and the proportion of ORs in the opposite direction (POOR).
Findings: Overall, the average 30-day mortality was 9%. Using only patient information on age and previous hospitalizations for different diseases we obtained an AUC = 0.727. This value was almost unchanged when adding sex, country of birth as well as hospitals and wards levels. Average mortality was higher in small wards and municipal hospitals but the POOR values were 15% and 16% respectively.
Conclusions: Swedish wards and hospitals in general performed homogeneously well, resulting in a low 30-day mortality rate after HF. In our study, knowledge on a patient's previous hospitalizations was the best predictor of 30-day mortality, and this information did not improve by knowing the sex and country of birth of the patient or where the patient was treated.
Conflict of interest statement
Figures


Similar articles
-
The role of the clinical departments for understanding patient heterogeneity in one-year mortality after a diagnosis of heart failure: A multilevel analysis of individual heterogeneity for profiling provider outcomes.PLoS One. 2017 Dec 6;12(12):e0189050. doi: 10.1371/journal.pone.0189050. eCollection 2017. PLoS One. 2017. PMID: 29211785 Free PMC article.
-
An Original Stepwise Multilevel Logistic Regression Analysis of Discriminatory Accuracy: The Case of Neighbourhoods and Health.PLoS One. 2016 Apr 27;11(4):e0153778. doi: 10.1371/journal.pone.0153778. eCollection 2016. PLoS One. 2016. PMID: 27120054 Free PMC article.
-
Survival after initial hospitalisation for heart failure: a multilevel analysis of patients in Swedish acute care hospitals.J Epidemiol Community Health. 2001 May;55(5):323-9. doi: 10.1136/jech.55.5.323. J Epidemiol Community Health. 2001. PMID: 11297650 Free PMC article.
-
Cross-classified Multilevel Analysis of Individual Heterogeneity and Discriminatory Accuracy (MAIHDA) to evaluate hospital performance: the case of hospital differences in patient survival after acute myocardial infarction.BMJ Open. 2020 Oct 23;10(10):e036130. doi: 10.1136/bmjopen-2019-036130. BMJ Open. 2020. PMID: 33099490 Free PMC article.
-
Association of Hospital Performance Based on 30-Day Risk-Standardized Mortality Rate With Long-term Survival After Heart Failure Hospitalization: An Analysis of the Get With The Guidelines-Heart Failure Registry.JAMA Cardiol. 2018 Jun 1;3(6):489-497. doi: 10.1001/jamacardio.2018.0579. JAMA Cardiol. 2018. PMID: 29532056 Free PMC article.
Cited by
-
Comparing Hospital Efficiency: An Illustrative Study of Knee and Hip Replacement Surgeries in Spain.Int J Environ Res Public Health. 2023 Feb 15;20(4):3389. doi: 10.3390/ijerph20043389. Int J Environ Res Public Health. 2023. PMID: 36834085 Free PMC article.
-
Quality and technical efficiency do not evolve hand in hand in Spanish hospitals: Observational study with administrative data.PLoS One. 2018 Aug 2;13(8):e0201466. doi: 10.1371/journal.pone.0201466. eCollection 2018. PLoS One. 2018. PMID: 30071062 Free PMC article.
-
Intermediate and advanced topics in multilevel logistic regression analysis.Stat Med. 2017 Sep 10;36(20):3257-3277. doi: 10.1002/sim.7336. Epub 2017 May 23. Stat Med. 2017. PMID: 28543517 Free PMC article.
-
Precision public health: Mapping socioeconomic disparities in opioid dispensations at Swedish pharmacies by Multilevel Analysis of Individual Heterogeneity and Discriminatory Accuracy (MAIHDA).PLoS One. 2019 Aug 27;14(8):e0220322. doi: 10.1371/journal.pone.0220322. eCollection 2019. PLoS One. 2019. PMID: 31454361 Free PMC article.
-
The role of the clinical departments for understanding patient heterogeneity in one-year mortality after a diagnosis of heart failure: A multilevel analysis of individual heterogeneity for profiling provider outcomes.PLoS One. 2017 Dec 6;12(12):e0189050. doi: 10.1371/journal.pone.0189050. eCollection 2017. PLoS One. 2017. PMID: 29211785 Free PMC article.
References
-
- Schaufelberger M, Swedberg K, Köster M, Rosén M, Rosengren A. Decreasing one-year mortality and hospitalization rates for heart failure in Sweden. European Heart Journal. 2004;25(4):300–7. - PubMed
-
- Krumholz HM, Merrill AR, Schone EM, Schreiner GC, Chen J, Bradley EH, et al. Patterns of Hospital Performance in Acute Myocardial Infarction and Heart Failure 30-Day Mortality and Readmission. Circulation: Cardiovascular Quality and Outcomes. 2009;2(5):407–13. 10.1161/circoutcomes.109.883256 - DOI - PubMed
Publication types
MeSH terms
LinkOut - more resources
Full Text Sources
Other Literature Sources
Medical
Research Materials
Miscellaneous

