. 2016 Feb 3;11(2):e0147470.
doi: 10.1371/journal.pone.0147470. eCollection 2016.

Competitive Mirror Image Phage Display Derived Peptide Modulates Amyloid Beta Aggregation and Toxicity

Affiliations

Competitive Mirror Image Phage Display Derived Peptide Modulates Amyloid Beta Aggregation and Toxicity

Stephan Rudolph et al. PLoS One. .

Erratum in

Abstract

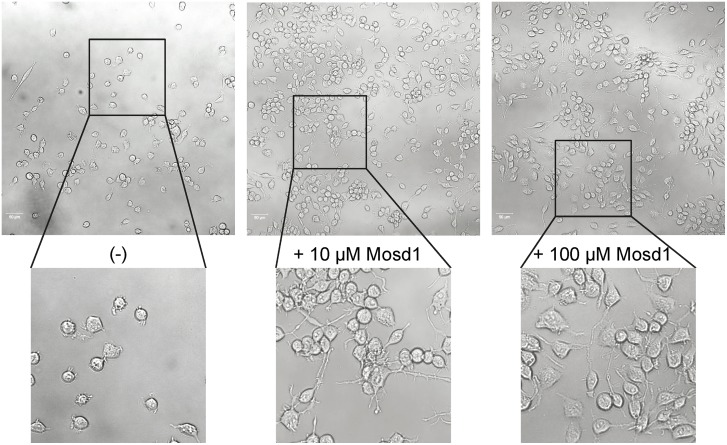
Alzheimer´s disease is the most prominent type of dementia and currently no causative treatment is available. According to recent studies, oligomeric species of the amyloid beta (Aβ) peptide appear to be the most toxic Aβ assemblies. Aβ monomers, however, may be not toxic per se and may even have a neuroprotective role. Here we describe a competitive mirror image phage display procedure that allowed us to identify preferentially Aβ1-42 monomer binding and thereby stabilizing peptides, which destabilize and thereby eliminate toxic oligomer species. One of the peptides, called Mosd1 (monomer specific d-peptide 1), was characterized in more detail. Mosd1 abolished oligomers from a mixture of Aβ1-42 species, reduced Aβ1-42 toxicity in cell culture, and restored the physiological phenotype in neuronal cells stably transfected with the gene coding for human amyloid precursor protein.


Conflict of interest statement

Competing Interests: The authors have declared that no competing interests exist.

Figures

Fig 1
Fig 1. Silver stained Tris-Tricine-SDS-PAGE of different Aβ1–42 species.
The Aβ1–42 species used for panning and counter selection during mirror image phage display were analyzed via DGC followed by Tris-Tricine-SDS-PAGE and silver staining. The SEC peak corresponding with Aβ1–42 monomers (A) presents Aβ1–42 content only in fractions 1 to 2 of a DGC gradient and therefore represents exclusively monomeric Aβ1–42. The SEC peak corresponding with Aβ1–42 oligomers (B) presents mainly Aβ1–42 in fractions 4 to 6, which is in accordance with oligomeric Aβ1–42 species. The preparation of fibrillary Aβ1–42 resulted in monomeric and fibrillary Aβ1–42 content as seen in fractions 1 to 2 and 13 to 14 (C). Using only the pooled fractions 12 to 14 ensured that no monomeric Aβ1–42 species were used as counterselective agent.
Fig 2
Fig 2. Single phage ELISA—immobilization control.
The immobilization efficiency of different Aβ1–42 species was analyzed by the binding affinity of Aβ1–42 specific antibody 6E10 to immobilized Aβ1–42 on each plate used for single phage ELISA. The Aβ1–42 specific antibody 6E10 was added to wells coated with 150 ng Aβ1–42 monomers (red) or 150 ng Aβ1–42 oligomers and fibrils (1:1; green) or to wells only coated with streptavidin (blue). Transformation of substrate by the secondary antibody-conjugated HRP was measured at 450 nm.
Fig 3
Fig 3. Single phage ELISA.
The relative binding affinity of single phage clones from mirror image phage display (clone numbers 6.xx) and a previously conducted mirror image phage display (clone numbers 5.xx) to SEC-derived biotinylated Aβ1–42 monomers, oligomers and fibrils as well as the non-coated wells was analyzed. The M13 phage-specific antibody was used for detection. Transformation of substrate by the antibody-conjugated HRP was measured at 450 nm. Amplified single phage clones were added to wells coated with 150 ng Aβ1–42 monomers (red) or 150 ng Aβ1–42 oligomers and fibrils (1:1; green) or to wells only coated with streptavidin (blue). Cross reactivity of the M13 phage-specific antibody was tested in an approach without addition of phages. After background subtraction of the anti M13 antibody values, the values for phage to Aβ1–42 oligomer/fibril binding were normalized to the values of phage to Aβ1–42 monomer binding according to the outcome of coating efficiency controls with the Aβ specific antibody 6E10.
Fig 4
Fig 4. Transmission electron microscopy.
After incubation of 10 μM pretreated Aβ1–42 without (left picture) and with 10 μM Mosd1 (right picture) for 24 hours at room temperature, samples were spotted onto a formvar/carbon coated copper grid and stained with 1% aqueous uranyl acetate. Samples were analyzed with a Libra 120 TEM operating at 120 kV. Scale bar presents 0.25 μm.
Fig 5
Fig 5. Qualitative Aβ1–42 distribution alteration.
Silver staining of SDS gels after incubation of 80 μM Aβ1–42 for 4.5 hours at RT and 600 rpm and additional coincubation for 40 minutes with 0 (A) / 10 (B) / 20 (C) / 40 (D) / 80 μM (E) Mosd1 followed by density gradient centrifugation for three hours at 4°C at 259,000 x g. The bands display the signal for Aβ1–42 (4.5 kDa).
Fig 6
Fig 6. Quantitative concentration determination (RP-HPLC) of Aβ1–42 distribution.
Concentrations of Aβ1–42 in each DGC fraction were determined quantitatively via RP-HPLC. Samples were loaded to a Zorbax 300SB-C8 column connected to a 1260 Infinity HPLC system. Separation of the samples was achieved by elevated column temperature (80°C) and an isocratic mobile phase of 30% acetonitrile/0.1% TFA in water. The averaged concentration of Aβ1–42 from three independent experiments (with standard deviation) is plotted against the obtained fractions F1 to F15 of different incubation approaches of Aβ1–42 without or with Mosd1. Shown in red are the concentrations of fractions from 80 μM Aβ1–42 incubated without Mosd1. The following columns represent the Aβ1–42 concentrations in the fractions from 80 μM Aβ1–42 samples coincubated with increasing concentrations of Mosd1 (10 μM = light blue; 20 μM = dark blue; 40 μM = light green; 80 μM = dark green).
Fig 7
Fig 7. Reduction of seeded Aβ1–42 growth and fibrillar Aβ1–42 content.
Seedless Aβ1–42 was incubated alone (black) or together with fibrillary Aβ1–42 seeds previously incubated with (green) or without (red) a fivefold molar excess of Mosd1. ThT (20 μM) was added to each sample in order to measure fibrillar content. The data were fitted with an asymmetric five parameter fit. The (A) amplitude of relative fluorescence (RFU) of fibrillated seedless Aβ1–42 served as 100% to which the other values were normalized. The (B) half-life (t1/2), displaying the point in time, when half of the maximum ThT signal (i.e. fibrillary content) was reached. Statistical significance was determined by one-way ANOVA. Error bars display SEM. ns: p > 0.05; *: p ≤ 0.05; **: p ≤ 0.01; ***: p ≤ 0.001.
Fig 8
Fig 8. Effect of Aβ1–42 and Mosd1 on cell viability.
1–42 and Mosd1 were tested for their influence on PC-12 cell viability by MTT reduction assay. Cell viability (in percent) is plotted against different treatment conditions. Adherently grown PC-12 cells were incubated 24 hours with medium (black) or 0.1% TritonX-100 (yellow) as controls for viable cells and cytotoxicity, respectively. Additionally, cells incubated for 24 hours with 1 μM Aβ1–42 (red), Aβ1–42 + Mosd1 1:1 (light blue) and 1:0.5 (dark blue), respectively. The green bar corresponds to cells incubated with 1 μM Mosd1 for 24 hours. Viability was analyzed by subsequent incubation with MTT substrate for four hours. After solubilization, absorbance was measured at 570 nm. The averages and standard deviations of absorbance values from five independently performed experiments were calculated and normalized to untreated cells (medium). Statistical significance was tested with Mann-Whitney U test. ***: p ≤ 0.001.
Fig 9
Fig 9. Effect of Mosd1 on Neuro-2a cells.
Overview and detailed pictures of wild type Neuro-2a cells are shown. Neuro-2a cells were treated with 0, 10 and 100 μM of Mosd1, respectively. The left panel shows untreated wild type Neuro-2a cells. In the middle and right panel, incubation of wild type Neuro-2a cells with 10 μM Mosd1 and 100 μM Mosd1 are shown. Cell viability and morphology were analyzed with a LSM 710 laser scanning microscope. Scale bars equate 50 μm.
Fig 10
Fig 10. Effect of Mosd1 on Neuro-2a cells stably transfected with human APP695.
Overview and detailed pictures of Neuro-2a cells, stably transfected with human APP695, are shown. Cells were treated with 0, 10 and 100 μM of Mosd1, respectively. The left panel shows untreated hAPP695-transfected Neuro-2a cells. In the middle and right panel, incubation of hAPP695-transfected Neuro-2a cells with 10 μM Mosd1 and 100 μM Mosd1 are shown. Cell viability and morphology were analyzed with a LSM 710 laser scanning microscope. Scale bars equate 50 μm.
Fig 11
Fig 11. Analysis of potential γ-secretase activity alterations by Mosd1.
Detection of CTFβ and β-actin by enhanced chemoluminescence on a Western blot of lysed human APP695-transfected Neuro-2a cells. Human APP695-transfected Neuro-2a cells were grown in 24-well plates for 24 hours. Cells were incubated with DMSO (lane 1), DAPT (lane 2), 10 μM Mosd1 (lane 3) or 100 μM Mosd1 (lane 4) for additional 24 hours. The cells were harvested, lysed and proteins were separated by Tris-tricine SDS-PAGE. Proteins were blotted on a PVDF membrane and detected with an anti-APP-CTF antibody as well as an anti-β-actin antibody. Binding of HRP conjugated secondary antibodies was detected by transformation of enhanced chemoluminescence (ECL) substrate by HRP.

Similar articles

Cited by

References

    1. Organization WH. Dementia: A Public Health Priority: World Health Organization; 2012.
    1. Querfurth HW, LaFerla FM. Alzheimer's disease. The New England journal of medicine. 2010;362(4):329–44. Epub 2010/01/29. 10.1056/NEJMra0909142 . - DOI - PubMed
    1. Ritchie K, Lovestone S. The dementias. Lancet. 2002;360(9347):1759–66. Epub 2002/12/14. . - PubMed
    1. Bauer J. [Clinical diagnosis and therapeutic possibilities for dementia of the Alzheimer type]. Fortschritte der Neurologie-Psychiatrie. 1994;62(11):417–32. Epub 1994/11/01. 10.1055/s-2007-1002299 . - DOI - PubMed
    1. Selkoe DJ. Translating cell biology into therapeutic advances in Alzheimer's disease. Nature. 1999;399(6738 Suppl):A23–31. Epub 1999/07/07. . - PubMed

Publication types

MeSH terms