. 2016 Feb 23;7(8):8850-65.
doi: 10.18632/oncotarget.7091.

Nogo-B receptor promotes the chemoresistance of human hepatocellular carcinoma via the ubiquitination of p53 protein

Affiliations

Nogo-B receptor promotes the chemoresistance of human hepatocellular carcinoma via the ubiquitination of p53 protein

Chengyong Dong et al. Oncotarget. .

Abstract

Nogo-B receptor (NgBR), a type I single transmembrane domain receptor is the specific receptor for Nogo-B. Our previous work demonstrated that NgBR is highly expressed in breast cancer cells, where it promotes epithelial mesenchymal transition (EMT), an important step in metastasis. Here, we show that both in vitro and in vivo increased expression of NgBR contributes to the increased chemoresistance of Bel7402/5FU cells, a stable 5-FU (5-Fluorouracil) resistant cell line related Bel7402 cells. NgBR knockdown abrogates S-phase arrest in Bel7402/5FU cells, which correlates with a reduction in G1/S phase checkpoint proteins p53 and p21. In addition, NgBR suppresses p53 protein levels through activation of the PI3K/Akt/MDM2 pathway, which promotes p53 degradation via the ubiquitin proteasome pathway and thus increases the resistance of human hepatocellular cancer cells to 5-FU. Furthermore, we found that NgBR expression is associated with a poor prognosis of human hepatocellular carcinoma (HCC) patients. These results suggest that targeting NgBR in combination with chemotherapeutic drugs, such as 5-FU, could improve the efficacy of current anticancer treatments.

Keywords: HCC; NgBR; chemoresistance.


Conflict of interest statement

CONFLICTS OF INTEREST

The authors declare no conflicts of interest and no financial disclosures.

Figures

Figure 1
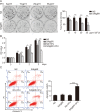
Figure 1. NgBR is highly expressed in the chemoresistant Bel/5FU cells
(A) The 5-FU resistant phenotype was confirmed in Bel/5FU cells. Clonogenic survival assay was used for measuring clonogenicity of Bel7402 and Bel/5FU cells treated with different concentrations of 5-FU (0, 5, 20, and 50 μg/mL) (left panel). The number of untreated cells is set as 100%. The results were analyzed and show the average percentage of surviving colonies (right panel). (B) High mRNA level of NgBR was detected in chemoresistant Bel/FU cells. mRNA level of NgBR was analyzed using real-time RT-PCR and normalized to the β-actin. (C) High NgBR protein level was detected in chemoresistant Bel/5FU cells. Protein level was monitored using western blot (left panel). B and intensities were quantified using Image Lab 5.0 software and were normalized to β-actin (right panel). The data are presented as the mean ± SD of three independent experiments. (**P < 0.01, ***P < 0.001).
Figure 2
Figure 2. Knockdown of NgBR decreases the chemoresistance of Bel/5FU cells to 5-FU
(A) Knockdown of NgBR decreases the clonogenenicity of Bel/5FU cells. Clonogenic formation assay was used for measuring clonogenicity of Bel/5FU cells treated with different concentrations of 5-FU (0, 10, 20, and 50 μg/mL) (left panel). The number of untreated cells is set as 100% and the results show the average percentage of surviving colonies (right panel). (B) Knockdown of NgBR decreases Bel/5FU cell viability. Cell viability was analyzed by CCK8 assay in Bel/5FU cells treated with 5-FU (0 and 50 μg/mL) for different times 24 h, 48 h, and 72 h. (C) Knockdown of NgBR increases apoptosis of Bel/5FU cells induced by 5-FU. The apoptotic cells were detected by Annexin V-PI dual staining. Representative data from three independent experiments are shown in left panel, the total number of cells in the Q2 and Q4 quadrant was regarded as apoptotic cells. Percentages of apoptotic cells are shown in the bar graph (right panel). The data are means ± SD of three independent assays. (*P < 0.05,**P < 0.01, ***P < 0.001).
Figure 3
Figure 3. Knockdown of NgBR abrogates the S phase arrest in Bel/5FU cells
(A) Bel/5FU cells undergo S phase arrest. The cell cycle distribution in Bel7402 cells and Bel/5FU cells was analyzed by flow cytometry by using PI staining. Representative figure from three independent experiments is shown in left panel. The percentage of different cell cycle phases was drawn in histogram form to reflect the alteration of cell cycle phases (right panel). The mean and SD obtained from three independent experiments are plotted (*P < 0.05, **P < 0.01). (B) Knockdown of NgBR restores the S phase arrest in Bel/5FU cells. The cell cycle distribution in Bel/5FU cells was analyzed by flow cytometry by using PI staining. Results are shown as the mean ± SD of three independent experiments (***P < 0.001). (C) Overexpression of NgBR rescued the cell cycle distribution impaired by siNgBR in Bel/5FU cells. Bel/5FU cells were co-transfected with siNgBR or NS and NgBR expression vector pIRES-NgBR or pIRES empty vector. Cell cycle was measured using flow cytometry. The mean and SD obtained from three independent experiments are plotted (***P < 0.001).
Figure 4
Figure 4. NgBR regulates p53 protein expression in Bel/5FU cells
(A) p53 protein was decreased in Bel/5FU cells. p53, p21, cyclinD1, CDK6, and Phos-Rb protein levels in Bel7402 cells and Bel/5FU cells were determined using western blot analysis (left panel). Band intensities were quantified using Image Lab 5.0 software and were normalized to β-actin (right panel). The data are presented as the mean ± SD of three separate experiments. (*P < 0.05, **P < 0.01). (B) Knockdown of NgBR increases p53 protein level in Bel/5FU cells. The expression of p53, p21, cyclinD1, CDK6, and Phos-Rb in Bel/5FU cells were detected by western blot assay (left panel). The quantitative measurement is shown in right panel. The mean and SD obtained from three independent experiments are plotted (*P < 0.05, **P < 0.01, ***P < 0.001). (C) Overexpression of NgBR rescued the p53 protein level change induced by NgBR siRNA in Bel/5FU cells. The Bel/5FU cells were co-transfected with siNgBR or NS as well as pIRES-NgBR or pIRES empty vector. Expression of p53, p21, cyclinD1, CDK6, and Phos-Rb proteins was then examined using western blot analysis (left panel). The quantitative measurement is shown in right panel. The mean and SD obtained from three independent experiments are plotted (*P < 0.05, **P < 0.01, ***P < 0.001).
Figure 5
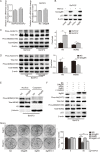
Figure 5. NgBR inhibits p53 expression by activating the PI3K/Akt/MDM2 mediated ubiquitin proteasome pathway
(A) The mRNA level of p53 is not changed in Bel/5FU cells. The mRNA level of p53 in Bel7402 cells and Bel/5FU cells was analyzed using real-time RT-PCR (left panel). Bel/5FU cells were transfected with the indicated siRNA and then the mRNA level of p53 was analyzed by real-time RT-PCR (right panel). The relative amount of p53 mRNA level was normalized to the β-actin. (B) NgBR negatively regulates p53 expression in a proteasome dependent manner. Bel7402 cells were transfected with pIRES-NgBR or pIRES empty vector plasmid DNA for 48 h and then incubated with or without MG132 (20 μM) for an additional 4 h. Whole-cell lysates were analyzed by western blotting. (C) Phos-Akt and phos-MDM2 levels are increased in Bel/5FU cells. The phos-Akt and phos-MDM2 levels were assessed by western blotting. Total Akt and total MDM2 protein levels were used as a loading control (left panel). Band intensities were quantified using Image Lab 5.0 software(right panel). Results are shown as the mean ± SD of three independent experiments (*P < 0.05, **P < 0.01). (D) Knockdown of NgBR decreases the phos-Akt and phos-MDM2 level in Bel/5FU cells. Phos-Akt and phos-MDM2 levels were detected by western blot assay (left panel). The expression of each protein was quantified as the densitometry value analyzed by Image Lab 5.0 software and is normalized to total Akt and total MDM2 (right panel). The data are presented as the mean ± SD of three separate experiments. (*P < 0.05, **P < 0.01). (E) NgBR knockdown decreases the translocation of MDM2 from the cytoplasm to the nucleus. Localization of total MDM2 and phos-MDM2 proteins in nuclear (N) and cytoplasmic (C) cell fractions from Bel/5FU NS and Bel/5FU siNgBR cells was examined by western blot assay. Histone H3 and β-tublin were used as internal markers for the nucleus and cytoplasm, respectively. (F) NgBR regulates phos-MDM2 via Akt pathway. The Bel/5FU cells were co-transfected with siNgBR or NS with pIRES–NgBR plasmid or pIRES empty vector for 24 h and then incubated with or without LY294002 (25 μM) for an additional 48 h. The levels of phos-Akt, phos-MDM2, and p53 were detected by western blot assay. Total Akt, total MDM2, and β-actin protein levels were used as loading control. (G) NgBR regulates chemoresistance of Bel/5FU cells via Akt pathway. Clonogenic formation assay was used for measuring clonogenicity of Bel/5FU cells. The number of untreated cells is set as 100% and the results show the average percentage of surviving colonies. The data are presented as the mean ± SD of three independent experiments. (**P < 0.01, ***P < 0.001).
Figure 6
Figure 6. NgBR deficiency reverses the chemoresistance of human hepatocellular drug-resistant tumor to 5-FU through regulating p53 expression in vivo
(A) Knockdown of NgBR decreases the tumor size. The representative images of Bel/5FU xenograft tumors injected intratumorally with non-silencing control siRNA (NS) or NgBR siRNA (siNgBR) and treated with vehicle or 5-FU for 3 weeks. (B) Knockdown of NgBR decreases the tumor volumes. Tumor volumes of different tumor and treatment groups were calculated as described in methods. The data are presented as the mean ± SD of three independent experiments. (**P < 0.01, ***P < 0.001). (C) Knockdown of NgBR decreases the tumor weights. The data are presented as the mean ± SD of three independent experiments. (**P < 0.01, ***P < 0.001). (D) Knockdown of NgBR increases p53 protein level in vivo. Representative immunohistochemical staining images showing the staining of NgBR and p53 in tumors tissue samples obtained from treatment groups at the end point. Scale bars, 50 μm. (E) NgBR expression is negatively associated with overall survival of human HCC patients. Kaplan-Meier analysis of overall survival with high or low NgBR expression of 89 primary human HCC patients (P = 0.017, log-rank test).
Figure 7
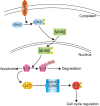
Figure 7. The proposed working model elucidating the roles of NgBR in regulating the chemoresistance of HCC cells

Similar articles

Cited by

References

    1. Jemal A, Bray F, Center MM, Ferlay J, Ward E, Forman D. Global cancer statistics. CA Cancer J Clin. 2011;61:69–90. - PubMed
    1. Siegel R, Naishadham D, Jemal A. Cancer statistics, 2012. CA Cancer J Clin. 2012;62:10–29. - PubMed
    1. Maluccio M, Covey A. Recent progress in understanding, diagnosing, and treating hepatocellular carcinoma. CA Cancer J Clin. 2012;62:394–399. - PubMed
    1. Llovet JM, Burroughs A, Bruix J. Hepatocellular carcinoma. Lancet. 2003;362:1907–1917. - PubMed
    1. Llovet JM, Di Bisceglie AM, Bruix J, Kramer BS, Lencioni R, Zhu AX, Sherman M, Schwartz M, Lotze M, Talwalkar J, Gores GJ. Design and endpoints of clinical trials in hepatocellular carcinoma. J Natl Cancer Inst. 2008;100:698–711. - PubMed

Publication types

MeSH terms