. 2016 Feb 11;530(7589):219-22.
doi: 10.1038/nature16954. Epub 2016 Feb 3.

A thalamic input to the nucleus accumbens mediates opiate dependence

Affiliations

A thalamic input to the nucleus accumbens mediates opiate dependence

Yingjie Zhu et al. Nature. .

Abstract

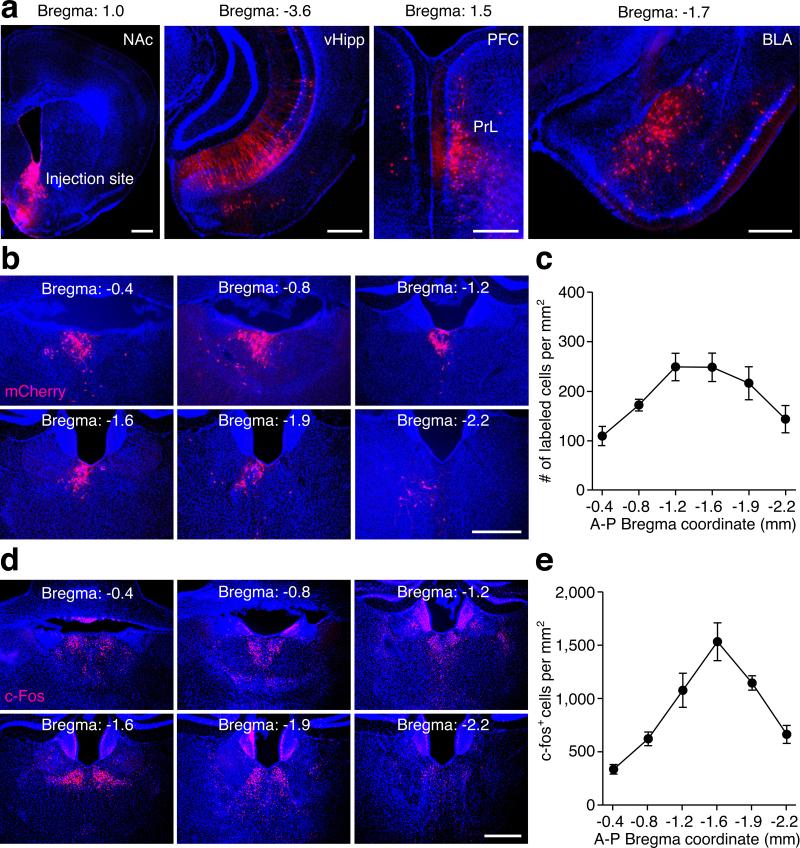
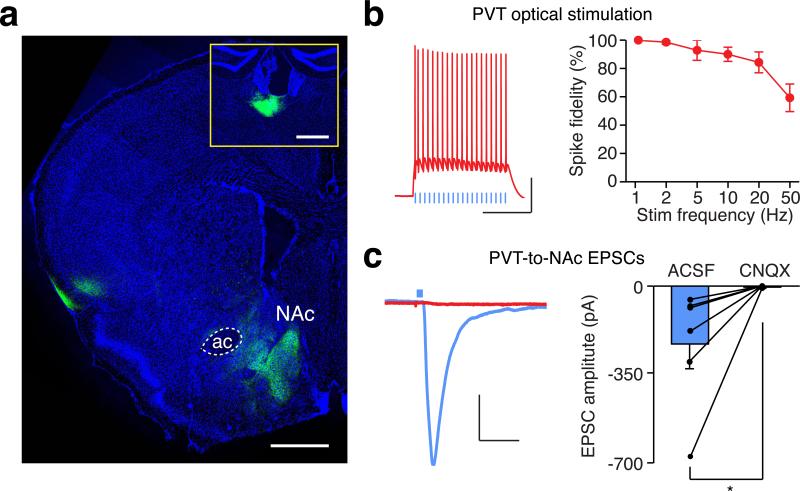
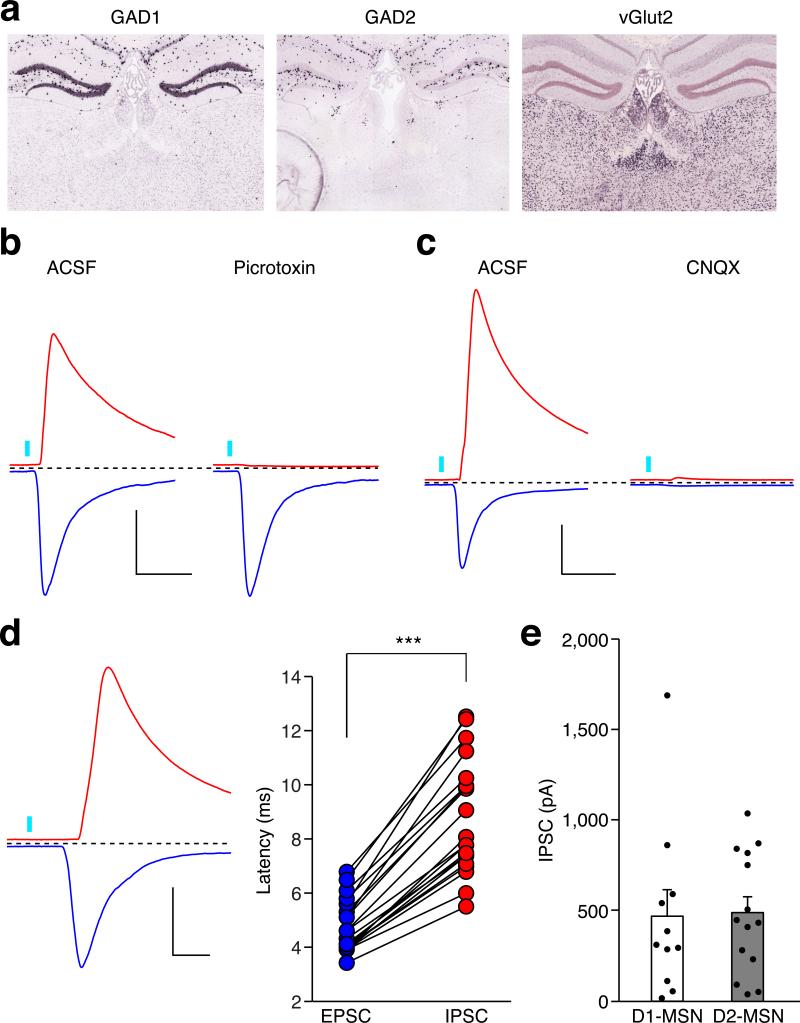
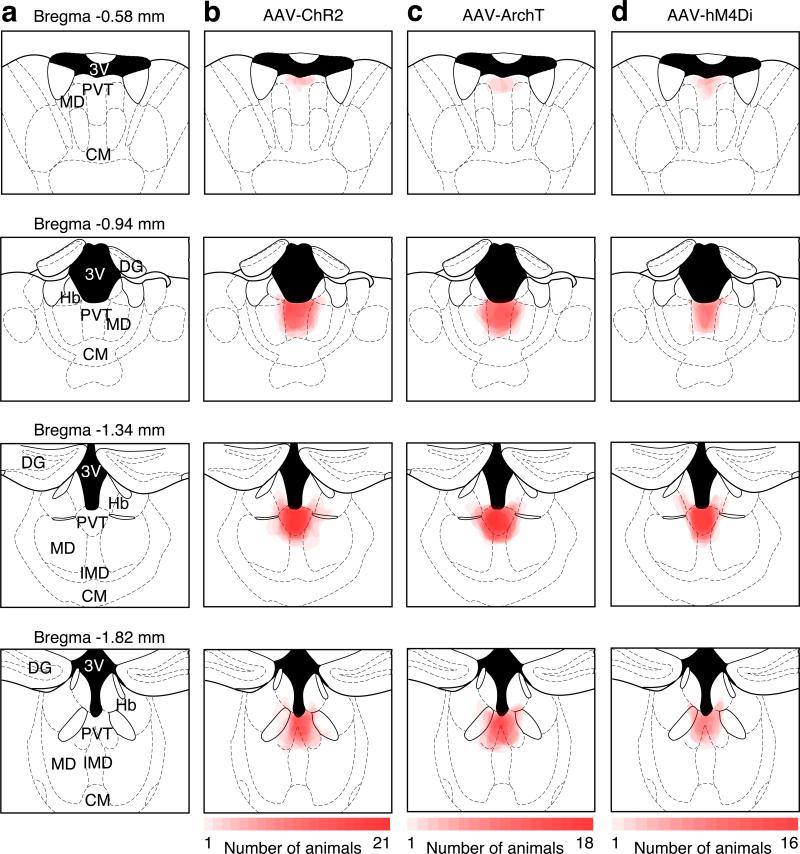
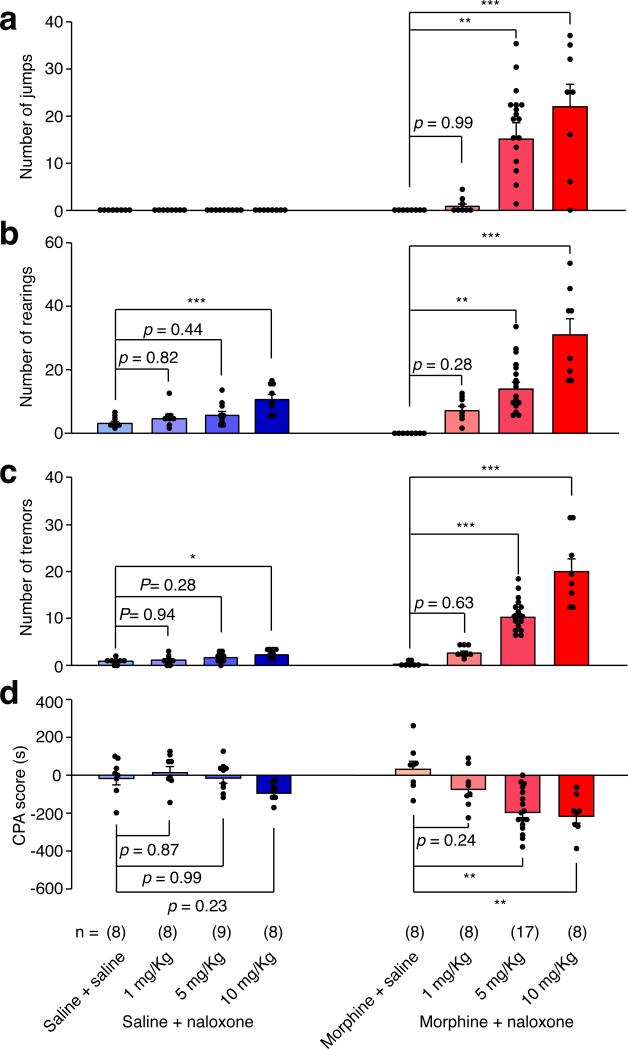
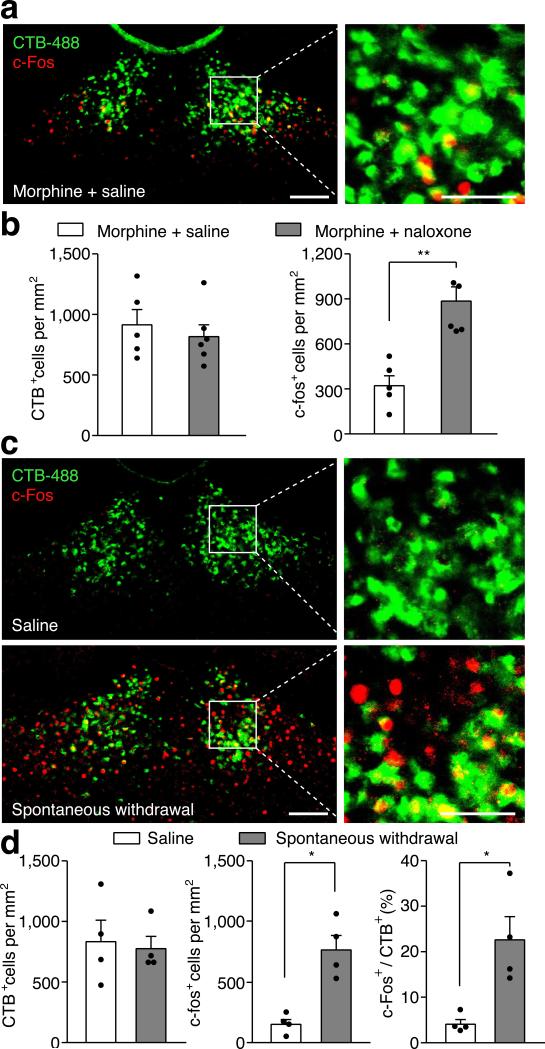
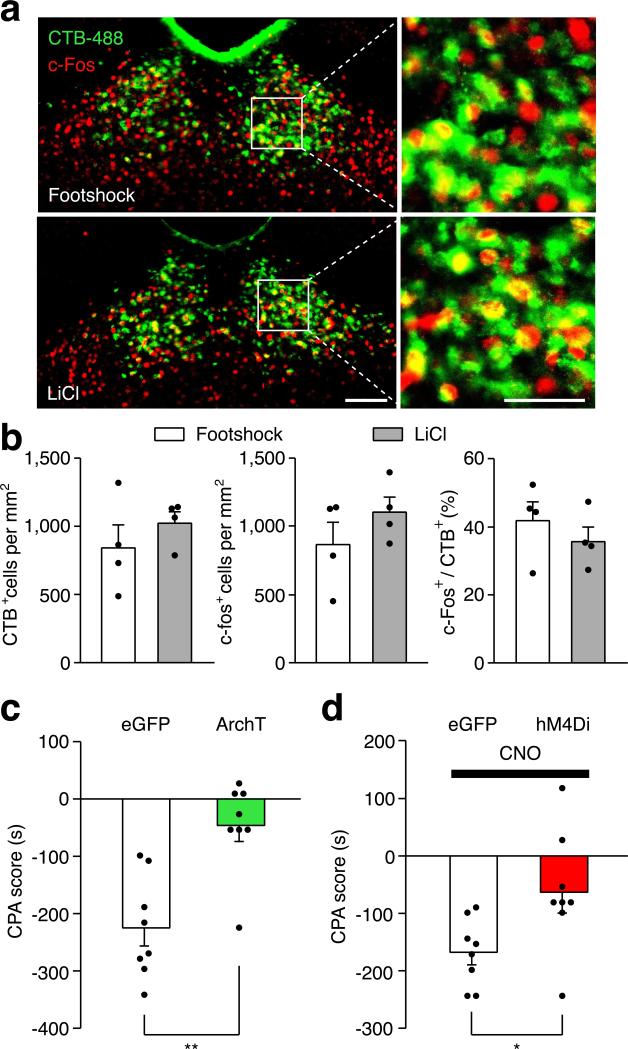
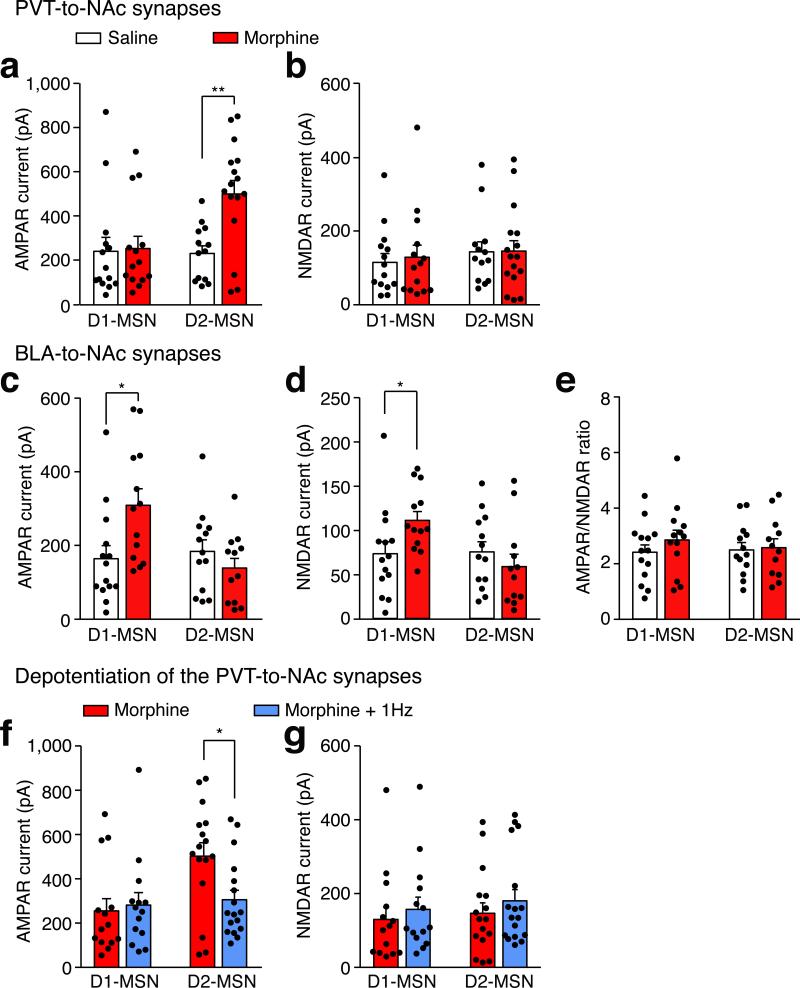
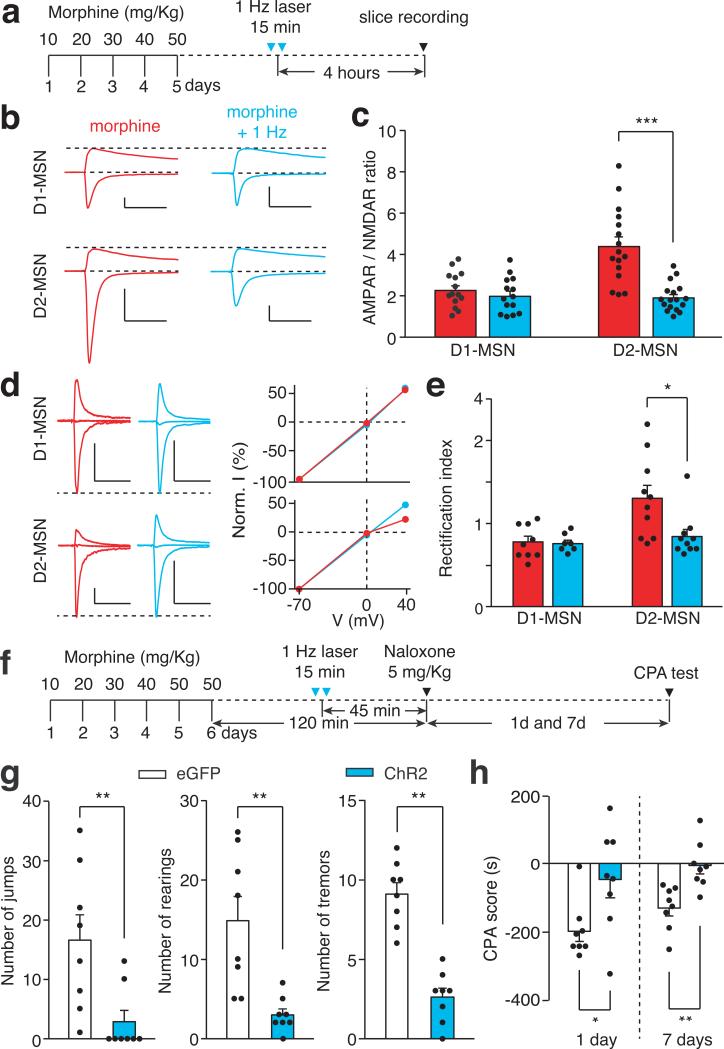
Chronic opiate use induces opiate dependence, which is characterized by extremely unpleasant physical and emotional feelings after drug use is terminated. Both the rewarding effects of a drug and the desire to avoid withdrawal symptoms motivate continued drug use, and the nucleus accumbens is important for orchestrating both processes. While multiple inputs to the nucleus accumbens regulate reward, little is known about the nucleus accumbens circuitry underlying withdrawal. Here we identify the paraventricular nucleus of the thalamus as a prominent input to the nucleus accumbens mediating the expression of opiate-withdrawal-induced physical signs and aversive memory. Activity in the paraventricular nucleus of the thalamus to nucleus accumbens pathway is necessary and sufficient to mediate behavioural aversion. Selectively silencing this pathway abolishes aversive symptoms in two different mouse models of opiate withdrawal. Chronic morphine exposure selectively potentiates excitatory transmission between the paraventricular nucleus of the thalamus and D2-receptor-expressing medium spiny neurons via synaptic insertion of GluA2-lacking AMPA receptors. Notably, in vivo optogenetic depotentiation restores normal transmission at these synapses and robustly suppresses morphine withdrawal symptoms. This links morphine-evoked pathway- and cell-type-specific plasticity in the paraventricular nucleus of the thalamus to nucleus accumbens circuit to opiate dependence, and suggests that reprogramming this circuit holds promise for treating opiate addiction.


Figures

Extended Data Figure 1
Extended Data Figure 1. Retrograde tracing with rabies virus labels brain areas innervating the NAc and naloxone-precipitated opiate withdrawal induces c-Fos expression in the PVT
a, Representative images show the injection site in the medial shell of the NAc, and retrograde labeling with mCherry in the ventral hippocampus (vHipp), prelimbic cortex (PrL) and basolateral amygdala (BLA). b, Representative images show retrograde labeling with mCherry in the PVT, ranging from Bregma −0.4 mm to −2.2 mm. c, Distribution of the density of retrogradely labeled neurons in the PVT (n = 7). d, Representative images show c-Fos expression in the PVT induced by naloxone-precipitated opiate withdrawal. e, Distribution of the density of c-Fos expressing neurons in the PVT (n = 5). Area of the PVT at different A-P coordinates are determined based on the brain atlas published by Allen Institute for Brain Science (Available from: http://mouse.brain-map.org/experiment/thumbnails/100142143?image_type=atlas). Scale bar: 500 μm. Mean ± s.e.m.
Extended Data Figure 2
Extended Data Figure 2. Optogenetic targeting of glutamatergic transmission between the PVT and the NAc
a, A confocal image shows ChR2-eYFP expressing terminals from the PVT in the medial shell of the NAc. Inset, injection site in the PVT. Scale bar: 500 μm. b, Example traces (left) and quantification (right) of action potential firing evoked by light stimulation at different frequencies in ChR2-expressing PVT neurons (n = 7). Scale bar: 25 mV, 250 ms. c, Example traces (left) and quantification (right) of photo-evoked EPSCs recorded from the NAc before and after superfusion of CNQX (10 μM, n = 6). Scale bar: 50 pA, 25 ms. Wilcoxon signed-rank test, *p < 0.05. Mean ± s.e.m.
Extended Data Figure 3
Extended Data Figure 3. Optogenetic activation of the PVT input evoked feed-forward inhibition onto MSNs in the NAc
a, in situ hybridization with GAD1 (http://mouse.brain-map.org/gene/show/14191), GAD2 (http://mouse.brain-map.org/experiment/show/79591669) and vGlut2 (http://mouse.brain-map.org/experiment/show/73818754) in the PVT (©2014 Allen Institute for Brain Science). b,c, Superfusion of a GABAA receptor antagonist (Picrotoxin, 100 μM) selectively blocked IPSCs (b) (n = 4), whereas superfusion of an AMPAR antagonist (CNQX, 10 μM) blocked both IPSCs and EPSCs (c) (n = 5). Scale bar: 400 pA, 30 ms. d, Example trace (left) and quantification (right) of the onset latency for photo-evoked IPSCs and EPSCs in the same neuron (n = 20). Scale bar: 400 pA, 10 ms. Wilcoxon signed-rank test. *** p < 0.001. e, Averaged amplitude of photo-evoked IPSCs in D1-MSNs (n = 11) and D2-MSNs (n = 14). Mann–Whitney U-test, p = 0.67. Mean ± s.e.m.
Extended Data Figure 4
Extended Data Figure 4. Location of ChR2, ArchT and hM4Di expression in the PVT
a, Schematics showing the PVT and its surrounding brain nucleus from anterior to posterior locations. 3V, third ventricle; MD, mediodorsal thalamus; CM, central middle thalamus; DG, dentate gyrus; Hb, habenula; IMD, intermediodorsal thalamus. b, Overlay of ChR2-YFP expression in 21 mice, including 13 mice in Fig. 1d and 8 mice in Fig. 4g,h. c, Overlay of ArchT-YFP expression in 18 mice, including 10 mice in Fig. 2d and 8 mice in Extended Data Fig. 7c. d, Overlay of hM4Di-mCherry expression in 16 mice, including 8 mice in Fig. 2g and 8 mice in Extended Data Fig. 7d. Intensity of red color is proportional to the number of mice expressing virus in the marked area.
Extended Data Figure 5
Extended Data Figure 5. Dose-response analysis of naloxone-precipitated withdrawal symptoms
Concentration of naloxone was determined by 2 × 2 factorial design. Different doses of naloxone (0, 1, 5, 10 mg Kg−1) were injected in chronic saline (blue) or morphine (red) treated mice. Behavioral signs of withdrawal including jump (a), rearing (b) and tremor (c) were recorded for 20 min immediately after naloxone injection. CPA (d) tests were performed 24 hours after withdrawal. One-way ANOVA followed by Tukey's test. Jumping: Morphine + Naloxone group F(3,36) = 9.93, p < 0.0001; Rearing: Saline + Naloxone group F(3,36) = 7.07, p < 0.01; Morphine + Naloxone group F(3,36) = 22.98, p < 0.0001; Tremor: Saline + Naloxone group F(3,29) = 3.74, p < 0.05; Morphine + Naloxone group F(3,36) = 40.48, p < 0.0001; CPA: Saline + Naloxone group F(3,29) = 2.67, p = 0.066; Morphine + Naloxone group F(3,36) = 9.93, p < 0.0001; p values for post-hoc Tukey's test are indicated on each comparison pair. Mean ± s.e.m.
Extended Data Figure 6
Extended Data Figure 6. Opiate withdrawal induced c-Fos expression in the PVTNAc projection neurons
a, Example confocal image shows expression of c-Fos in a small number of PVTNAc projection neurons after injection of saline into chronic morphine treated mice. Left: scale bar, 100 μm; Right: magnified image shows the boxed area. Scale bar, 50 μm. b, Quantification of CTB (left) and c-fos (right) positive cells per mm2 after injection of saline (white bar, n = 5) or naloxone (gray bar, n = 6) into chronic morphine treated mice. c, Example confocal images show that spontaneous withdrawal from morphine (lower panel) but not saline (upper panel) treatment increases the expression of c-Fos in PVTNAc projection neurons. Left: scale bar, 100 μm; Right: magnified image shows the boxed area. Scale bar, 50 μm. d, Quantification of CTB (left) and c-fos (middle) positive cells per mm2 and percentage of PVTNAc projection neurons (right) that express c-Fos induced by spontaneous withdrawal from morphine (gray bar, n = 4) or saline (white bar, n = 4). Mann–Whitney U-test, *p < 0.05, **p < 0.01. Mean ± s.e.m.
Extended Data Figure 7
Extended Data Figure 7. The PVT→NAc pathway is required for expression of behavioral aversion to footshock and LiCl injection
a, Confocal images show robust expression of c-Fos (red) in the PVTNAc projection neurons (green) after footshock (upper panel) and LiCl injection (lower panel). Left: scale bar, 100 μm; Right: magnified image shows the boxed area. Scale bar, 50 μm. b, Quantification of CTB (left) and c-fos (middle) positive cells per mm2 and percentage of PVTNAc projection neurons (right) expressing c-Fos induced by footshock (white bar, n = 4) or LiCl injection (gray bar, n = 4). c, Light stimulation suppressed the expression of footshock-induced CPA in ArchT- (n = 8) but not eGFP- (n = 8) expressing mice. d, Local infusion of CNO reduced the expression of LiCl-induced CPA in hM4Di- (n = 8) but not eGFP- (n = 8) expressing mice. Mann–Whitney U-test, *p < 0.05, ** p < 0.01. Mean ± s.e.m.
Extended Data Figure 8
Extended Data Figure 8. Effects of chronic morphine treatment and in vivo optogenetic LTD induction on the strength of AMPAR and NMDAR current in MSNs receiving input from the PVT or BLA
a,b, In the PVT→NAc pathway, chronic morphine treatment specifically increases AMPAR but not NMDAR current on D2-MSNs (saline/morphine, n = 13/16 cells) but not D1-MSNs (saline/morphine, n = 14/14 cells). Two-way ANOVA (AMPAR: F(1,53) = 5.24, p < 0.05; NMDAR: F(1,53) = 0.04, p = 0.83) followed by Tukey's test, ** p < 0.01. c,d, In the BLA→NAc pathway, chronic morphine treatment increases both AMPAR current (c) and NMDAR current (d) on D1-MSNs (saline/morphine, n=14/13 cells) but not D2-MSNs (saline/morphine, n=13/12 cells). Two-way ANOVA (AMPAR: F(1,51) = 7.06, p < 0.05; NMDAR: F(1,51) = 0.35, p = 0.55) followed by Tukey's test, * P<0.05. e, Chronic morphine treatment has no effect on the AMPAR/NMDAR ratio in either D1-MSNs or D2-MSNs in the BLA→NAc pathway. Two-way ANOVA (F(1,51) = 7.06, p < 0.05). f,g, In the PVT→NAc pathway, in vivo optogenetic stimulation (4 ms, 1 Hz, 900 pulses) in morphine-treated mice specifically decreases AMPAR but not NMDAR current in D2-MSNs (morphine/morphine + 1 Hz, n = 16/17 cells) but not D1-MSNs (morphine/morphine + 1 Hz, n = 14/14 cells). Two-way ANOVA (AMPAR: F(1,57) = 4.24, p = 0.04; NMDAR: F(1,57) = 0.01, p = 0.92) followed by Tukey's test. * p < 0.05. Mean ± s.e.m.
Extended Data Figure 9
Extended Data Figure 9. Chronic morphine treatment and in vivo optogenetic LTD induction does not affect paired-pulse ratio of MSNs receiving PVT input
Example traces (a) and quantification (b) of paired-pulse ratio of photo-evoked EPSCs in D1- and D2-MSNs. An escalating regimen of morphine treatment and in vivo optogenetic stimulation (4 ms, 1 Hz, 900 pulses) in morphine-treated mice had no obvious effect on the paired-pulse ratio of MSNs receiving PVT input (Two-way ANOVA, F(2,35) = 0.02 p = 0.97). D1-MSNs: saline/morphine/morphine + 1 Hz, n = 9/7/6; D2-MSNs: saline/morphine/morphine + 1 Hz, n = 7/6/6. Scale bar: 200 pA, 50 ms. Mean ± s.e.m.
Figure 1
Figure 1. In vivo optical activation of the PVT→NAc pathway evokes behavioral aversion
a, Left: Cluster of retrogradely labeled cells was observed in the PVT 5 days after injection of RV-mCherry into the medial shell of the NAc (n = 7). Scale bar, 500 μm; Inset shows the RV-mCherry injection site. Right: magnified image shows the morphology of labeled neurons in the boxed area. Scale bar, 50 μm. D, dorsal; L, lateral; 3V, third ventricle; DG, dentate gyrus. b, Schematics of in vivo manipulation of the PVT→NAc circuit in behaving animals. c, Representative RTPP tracks illustrate light-evoked behavioral aversion in ChR2-expressing mice (bottom, n = 10) but not in eGFP-expressing control mice (top, n = 8). d, Quantification of light-evoked aversion and its effect by intra-NAc pharmacological manipulations. Intra-NAc infusions of NBQX (AMPAR antagonist, 1.0 μg in 200 nl, n = 8) but not saline (n = 10), SCH23390 (D1R antagonist, 0.2 μg in 200 nl, n = 8) or Raclopride (D2R antagonist, 0.3 μg in 200 nl, n = 8) abolished behavioral aversion evoked by optical stimulation of the PVT→NAc fibers. One-way ANOVA (F(4, 37) = 29.61, p < 0.0001) followed by Post-hoc Tukey's test. *** p < 0.001. Mean ± s.e.m.
Figure 2
Figure 2. The PVT→NAc pathway is required for expression of aversive withdrawal symptoms
a, Experimental timeline for b-e. b, Confocal images showing that naloxone-precipitated withdrawal induced robust expression of c-Fos (red) in the PVTNAc projection neurons (green) that were retrogradely labeled by injection of CTB-488 into the medial shell of the NAc (n = 6). Left: scale bar, 100 μm; Right: magnified image shows the boxed area. Scale bar, 50 μm. c, Percentage of PVTNAc projection neurons expressing c-Fos. Naloxone (gray bar, n = 6) but not saline (white bar, n = 5) injection evoked significant expression of c-Fos in the PVTNAc projection neurons. Mann-Whitney U-test. ** p < 0.01. d,e, Quantification of naloxone-precipitated withdrawal behaviors and CPA score. Light stimulation in ArchT- (green bar, n = 10) but not eGFP- (white bar, n = 9) expressing mice during withdrawal significantly reduces the number of jump, rearing and tremor events (d) as well as the expression of CPA (e). Mann-Whitney U-test. * p < 0.05, ** p < 0.01. f, CNO (3 μM) inhibits light-evoked synaptic current recorded from postsynaptic MSNs (n = 5). Inset shows example light-evoked EPSC traces before (black) and after (red) perfusion of CNO. Wilcoxon signed-rank test, * p < 0.05. Scale bar: 20 pA, 25 ms. g, Spontaneous opiate withdrawal induced CPA was reduced by local infusion of CNO in hM4Di- (red, n = 8) but not eGFP- (black, n = 8) expressing mice, or local infusion of saline in hM4Di- (magenta, n = 8) expressing mice. One-way ANOVA (F(2,21) = 7.4, p < 0.01) followed by Post-hoc Tukey's test. * p < 0.05, ** p < 0.01. h, Light stimulation has no effect on locomotor velocity in either saline (n = 9, p = 0.57) or morphine (n = 9, p = 0.5) injected animals. Wilcoxon signed-rank test. Mean ± s.e.m.
Figure 3
Figure 3. Morphine-induced potentiation at the PVT→D2-MSN synapses
a, Image of a NAc slice from a D1–TdTomato and D2–eGFP double transgenic mouse (n = 5). Scale bar, 50 μm. b,c, Example traces (b) and quantification (c) of light-evoked EPSCs at −70 mV and +40 mV show that chronic morphine treatment significantly increased the AMPAR/NMDAR ratio in D2-MSNs (saline/morphine, n = 13/16 cells), but not D1-MSNs (saline/morphine, n = 14/14 cells). Two-way ANOVA (F(1,53) = 12.58, p < 0.001) followed by Post-hoc Tukey's test. *** p < 0.001. For comparison, EPSC amplitudes are normalized to peaks at +40 mV. Solid dots indicate the current amplitude used for calculating the AMPAR/NMDAR ratio. Scale bar: 300 pA, 50 ms. d,e, Example traces (d, left), I/V curve (d, right) and quantification (e) of light-evoked AMPAR EPSCs at −70 mV, 0 mV and +40 mV show that morphine treatment selectively increased the rectification index of AMPAR EPSCs in D2-MSNs (saline/morphine, n = 7/10 cells), but not D1-MSNs (saline/morphine, n = 8/9 cells). Two-way ANOVA (F(1,30) = 9.87, p < 0.01) followed by Post-hoc Tukey's test. ** p < 0.01. For comparison, amplitudes of AMPAR EPSCs are normalized to peaks at −70 mV. Scale bar: 250 pA, 50 ms. Mean ± s.e.m.
Figure 4
Figure 4. In vivo optogenetic LTD induction restores normal transmission at PVT→D2-MSN synapses and suppresses withdrawal symptoms
a, Experimental timeline for b-e. b-e, in vivo 1Hz photostimulation successfully normalized morphine-induced changes of AMPAR/NMDAR ratio and rectification index in D2-MSNs, but had little effect on D1-MSNs. b,c, AMPAR/NMDAR ratio of D2-MSNs (morphine/morphine+1 Hz, n = 16/17 cells) and D1-MSNs (morphine/morphine+1 Hz, n = 14/14); Two-way ANOVA (F(1,57) = 13.86, p < 0.001) followed by Post-hoc Tukey's test. *** p < 0.001. d,e, Rectification index for AMPAR EPSCs in D2-MSNs (morphine/morphine+1 Hz, n = 10/10) and D1-MSNs (morphine/morphine+1 Hz, n = 9/7). Two-way ANOVA (F(1,32) = 4.3, p < 0.05) followed by Post-hoc Tukey's test. * p < 0.05. Scale bars: 300 pA, 50 ms (b); 250 pA, 50 ms (d). f, Experimental timeline for g,h. g,h, Quantification of withdrawal behaviors (g) and CPA score (h). In ChR2-(blue bar, n = 8) but not eGFP- (white bar, n = 8) expressing mice, in vivo 1Hz stimulation suppressed naloxone-precipitated jumping, rearing and tremor events (g), and also suppressed conditioned place aversion to the withdrawal chamber (h). Mann-Whitney U-test, * p < 0.05, ** p < 0.01. Mean ± s.e.m.

Comment in

  • Addiction: Road to aversion.
    Carr F. Carr F. Nat Rev Neurosci. 2016 Apr;17(4):200. doi: 10.1038/nrn.2016.25. Epub 2016 Feb 25. Nat Rev Neurosci. 2016. PMID: 26911434 No abstract available.

References

    1. Koob GF, LeMoal M. Drug abuse: Hedonic homeostatic dysregulation. Science. 1997;278:52–58. doi:DOI 10.1126/science.278.5335.52. - PubMed
    1. Vargas-Perez H, Ting AKRA, Heinmiller A, Sturgess JE, van der Kooy D. A test of the opponent-process theory of motivation using lesions that selectively block morphine reward. Eur J Neurosci. 2007;25:3713–3718. doi:10.1111/j.1460-9568.2007.05599.x. - PubMed
    1. Wikler A. A theory of opioid dependence. NIDA Res Monogr. 1980;30:174–178. - PubMed
    1. Harris GC, Astonjones G. Involvement of D2 Dopamine-Receptors in the Nucleus-Accumbens in the Opiate Withdrawal Syndrome. Nature. 1994;371:155–157. doi:Doi 10.1038/371155a0. - PubMed
    1. Koob GF, Wall TL, Bloom FE. Nucleus Accumbens as a Substrate for the Aversive Stimulus Effects of Opiate Withdrawal. Psychopharmacology. 1989;98:530–534. doi:Doi 10.1007/Bf00441954. - PubMed

Publication types

MeSH terms