. 2016 Feb 11;530(7589):171-176.
doi: 10.1038/nature16931. Epub 2016 Feb 3.

Re-engineering the zinc fingers of PRDM9 reverses hybrid sterility in mice

Affiliations

Re-engineering the zinc fingers of PRDM9 reverses hybrid sterility in mice

Benjamin Davies et al. Nature. .

Abstract

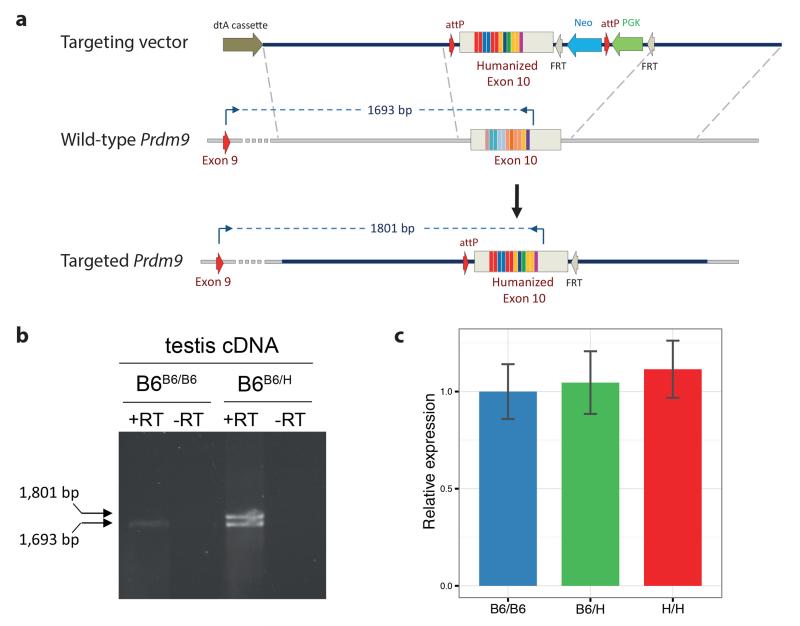
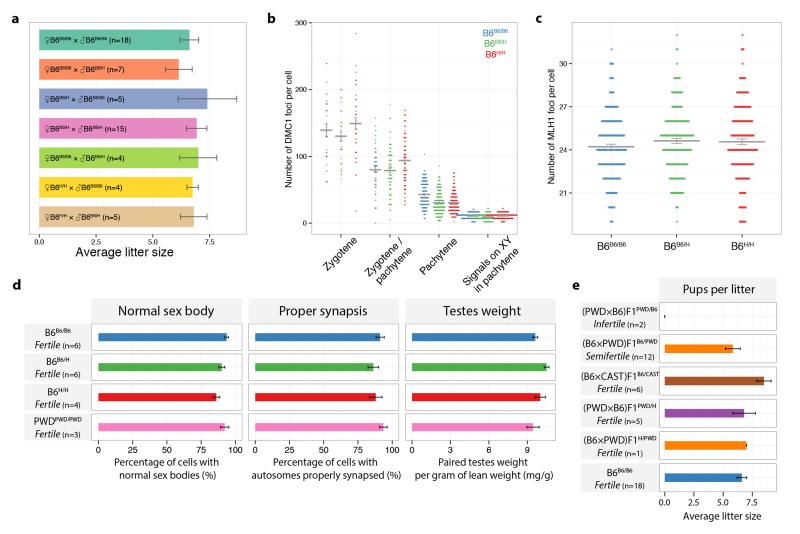
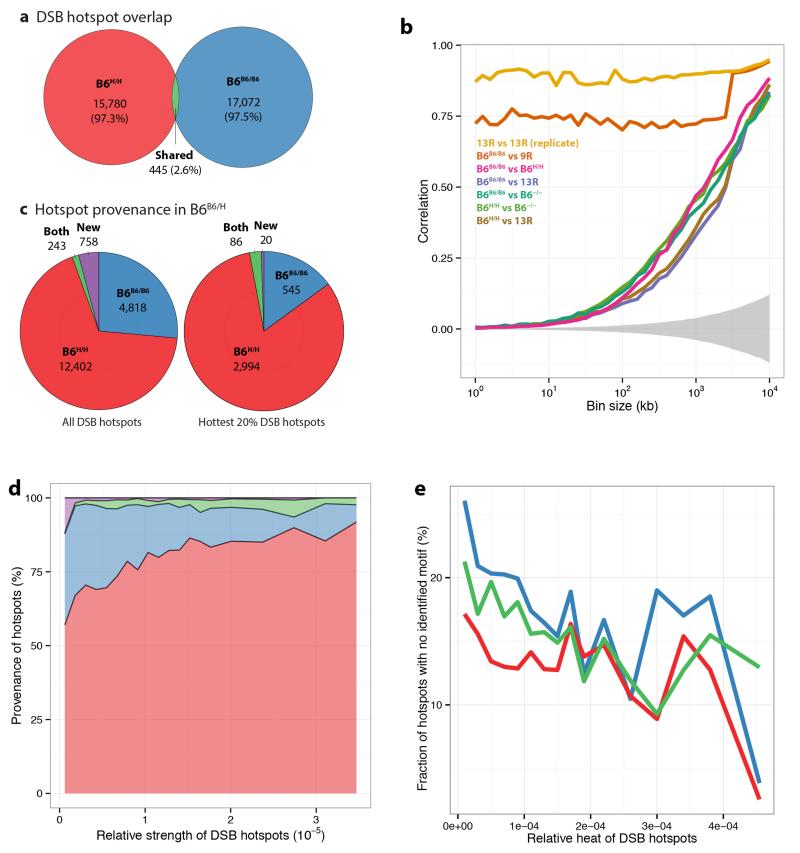
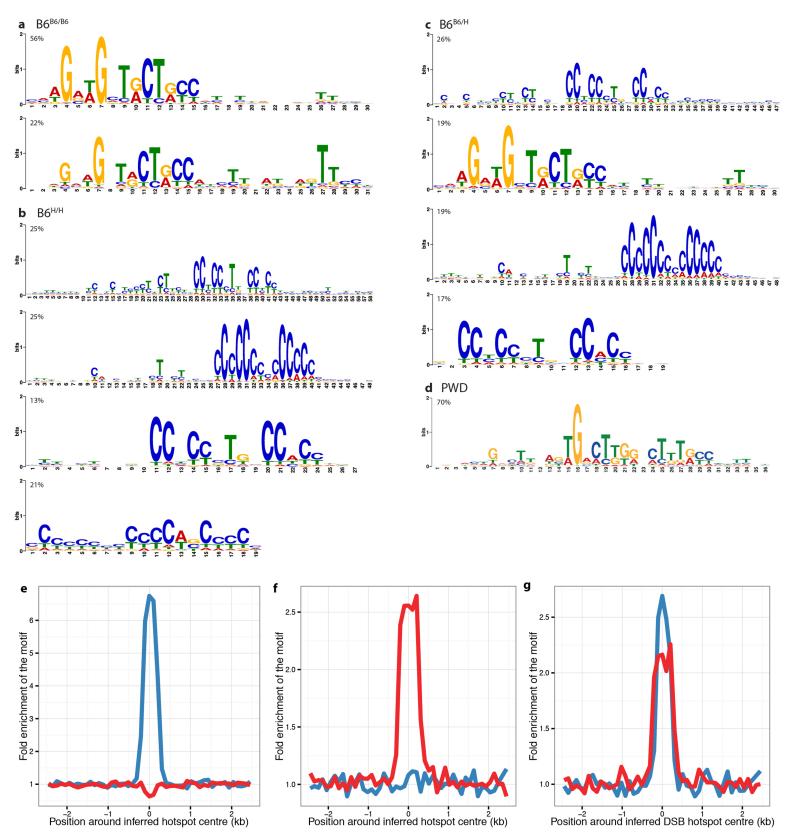
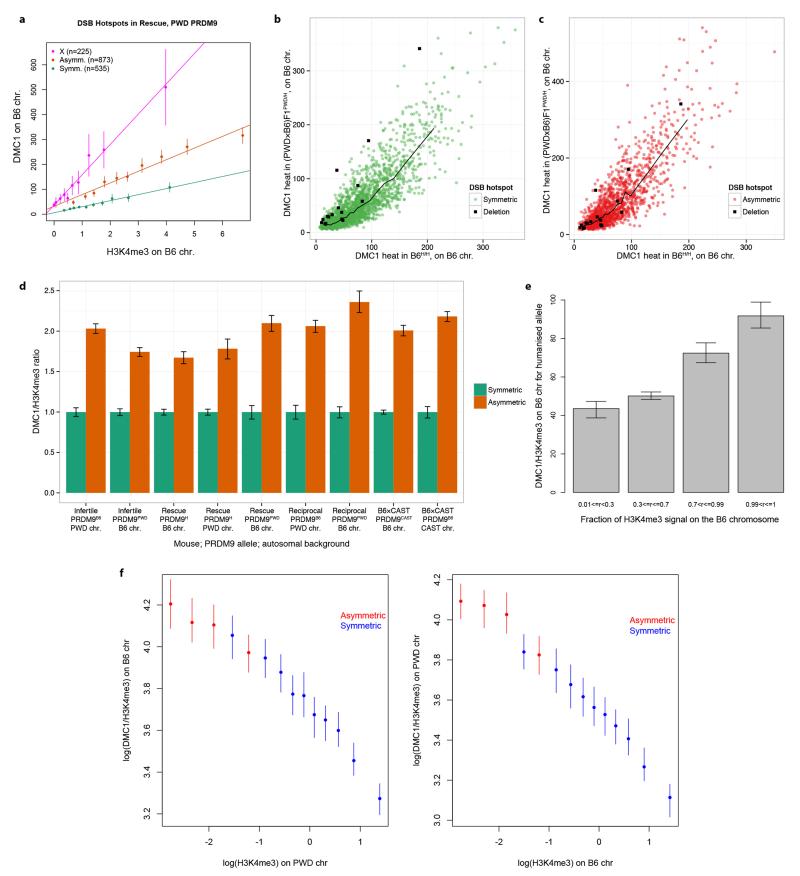
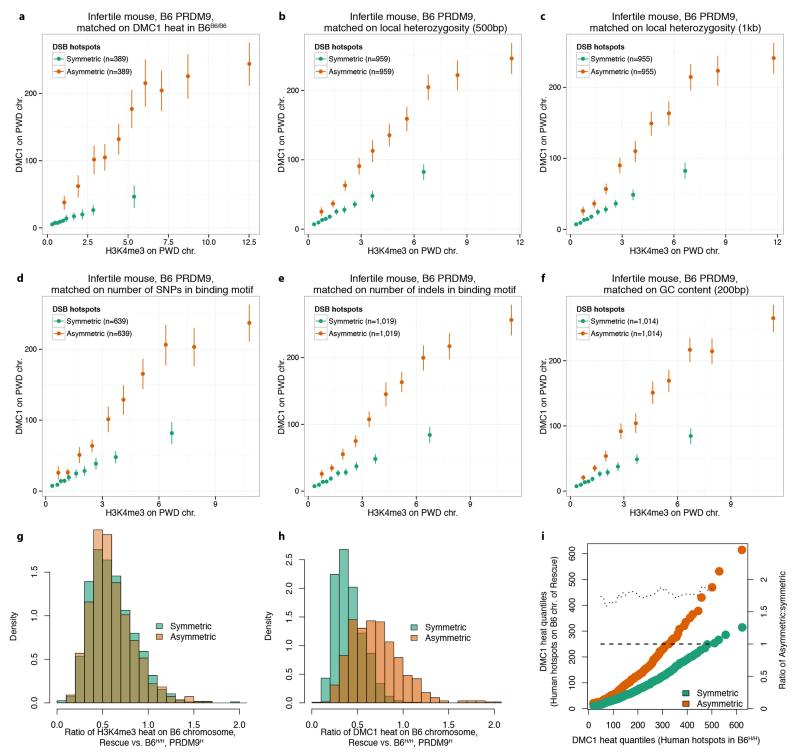
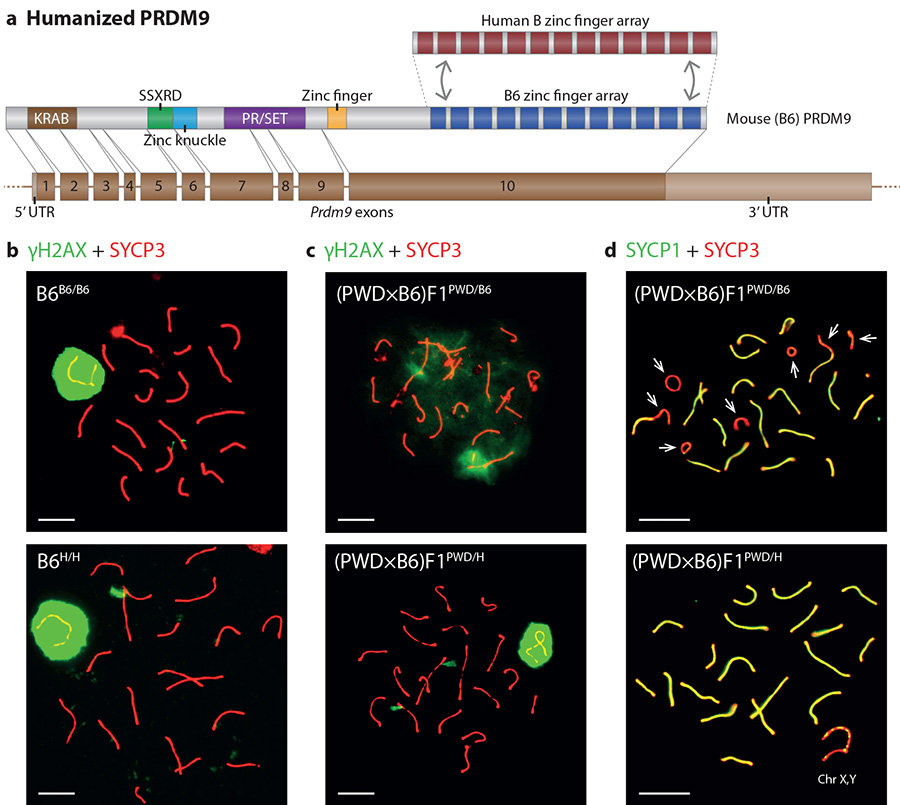
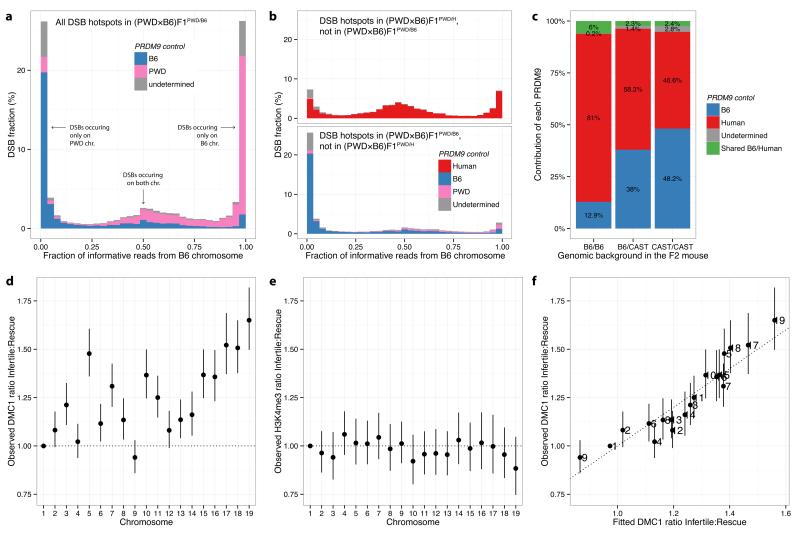
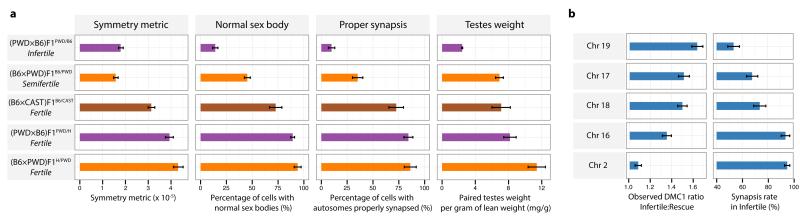
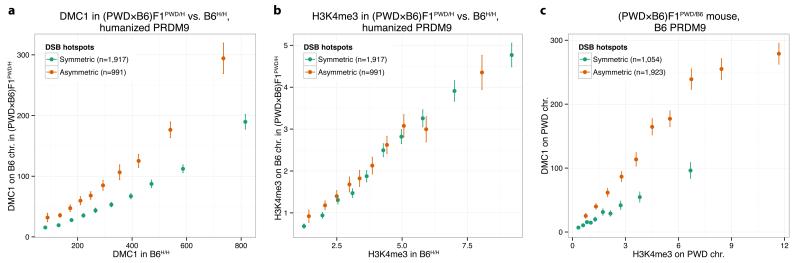
The DNA-binding protein PRDM9 directs positioning of the double-strand breaks (DSBs) that initiate meiotic recombination in mice and humans. Prdm9 is the only mammalian speciation gene yet identified and is responsible for sterility phenotypes in male hybrids of certain mouse subspecies. To investigate PRDM9 binding and its role in fertility and meiotic recombination, we humanized the DNA-binding domain of PRDM9 in C57BL/6 mice. This change repositions DSB hotspots and completely restores fertility in male hybrids. Here we show that alteration of one Prdm9 allele impacts the behaviour of DSBs controlled by the other allele at chromosome-wide scales. These effects correlate strongly with the degree to which each PRDM9 variant binds both homologues at the DSB sites it controls. Furthermore, higher genome-wide levels of such 'symmetric' PRDM9 binding associate with increasing fertility measures, and comparisons of individual hotspots suggest binding symmetry plays a downstream role in the recombination process. These findings reveal that subspecies-specific degradation of PRDM9 binding sites by meiotic drive, which steadily increases asymmetric PRDM9 binding, has impacts beyond simply changing hotspot positions, and strongly support a direct involvement in hybrid infertility. Because such meiotic drive occurs across mammals, PRDM9 may play a wider, yet transient, role in the early stages of speciation.


Figures

Extended Data Figure 1
Extended Data Figure 1. Humanization of the zinc finger domain of Prdm9
a, Top panel: the targeting vector used for the humanization of the ZF-array encoded by a portion of exon 10. Middle panel: wild-type Prdm9 allele. Lower panel: the targeted humanized allele, following the action of Flp recombinase which removes the FRT flanked neomycin selection cassette. The positions of primers used for the exon spanning RT-PCR are shown along with the sizes of the predicted amplification products from cDNA. b, RT-PCR analysis using the exon spanning primers shown in a from testis cDNA prepared from wild-type (B6B6/B6) and heterozygous humanized (B6B6/H) mice. For gel source data, see Supplementary Figure 1. c, Relative expression of the Prdm9 transcript from testis cDNA prepared from wild-type (B6B6/B6), heterozygous (B6B6/H) and humanized (B6H/H) testis cDNA, normalised to Hprt (n=2 for each genotype). Bars: 1 SE.
Extended Data Figure 2
Extended Data Figure 2. Effects of the humanization of the Prdm9 zinc finger domain on fertility parameters
a, The average litter size is shown for all combinations of genotype matings. Bars: 1 SE. b, Numbers of DMC1 foci colocalising with SYCP3 immunoreactivity per cell, grouped according to meiotic stage (wild-type (B6B6/B6): n=5 mice; heterozygous (B6B6/H): n=7 mice; homozygous (B6H/H): n=6 mice; cell numbers counted: zygotene: 32, 38, 37; zygotene/pachytene: 55, 96, 90; pachytene: 188, 210, 176; signals on XY in pachytene: 188, 210, 175 for B6B6/B6, B6B6/H and B6H/H, respectively). Mean values are shown c, Number of MLH1 foci per cell in pachytene stage meiotic spreads. (B6B6/B6: n=6 mice, 180 cells; B6B6/H: n=6 mice, 185 cells; B6H/H: n=6 mice, 183 cells). Mean values are shown. d, Comparison of fertility metrics in four mice with homozygous genetic background (B6 or PWD). Across all four mice, there is no statistically significant evidence of differences in these fertility parameters (ANOVA, Bonferroni corrected p-values > 0.08). Bars: 1 SE. e, Average litter sizes in F1 crosses. Bars: 1 SE.
Extended Data Figure 3
Extended Data Figure 3. Further features revealed by DMC1 signal analysis in mice with homozygous genetic background
a, Effect of humanization of the Prdm9 zinc finger domain on DSB hotspots. A total of 16,225 and 17,517 DSB hotspots were localized in the homozygous humanized and wild-type mice, respectively. Only 2.6% of these hotspots overlap. b, Correlations between DSB hotspot maps at different scales. Autosomes are divided into bins of given length, and correlations between the sums of the heats of the hotspots falling into each bin are reported, for different bin sizes. Grey region: empirical 95% confidence envelope for the correlation under the null hypothesis of no association between the B6B6/B6 and B6H/H DSB maps. DSB maps for B6B6/B6, 13R, 9R and Prdm9 knockout (B6−/−) mice come from ref. . B6B6/B6 and 9R have the same Prdm9 allele, but different genomic backgrounds. c, Breakdown of hotspot provenance (defined by overlap) in the heterozygous humanized mouse for all DSB hotspots (left panel) and for the hottest 20% of hotspots (right panel). d, Distributions of hotspot provenance in the heterozygous humanized mice as a function of the estimated hotspot heats (blue: wild-type B6 mouse, red: humanized homozygous mouse, green: humanized heterozygous mouse, purple: undetermined). The human allele dominates over the mouse allele in terms of heat, as the proportion of DSB hotspots found in the heterozygous mouse that are shared with the homozygous humanized mouse increases with estimated heat. The relative heat/strength of a hotspot is the ratio of this hotspot’s estimated heat to the sum of all the estimated heats (on autosomes). e, Hotter hotspots present a PRDM9 binding motif more often than weaker hotspots in all samples (same colour legend).
Extended Data Figure 4
Extended Data Figure 4. Inferred PRDM9 binding motifs are enriched at DSB hotspot centres
a-d, Refined PRDM9 binding motifs detected in the wild-type B6 mouse (a), in the homozygous humanized mouse (b), in the heterozygous humanized mouse (c) and in wild-type PWD (d). Percentages above each motif indicate the fraction of DSB hotspots that are found to harbour this motif, with each DSB hotspot assigned at most to one motif. In logo plots, letter height in bits of information determines degree of base specificity. e-g, Enrichment of the most prevalent 15bp wild-type (blue) and humanized homozygous (red) motifs within 100bp bins across a 5kb window centred on the DSB hotspot centres. Enrichments were computed for the wild-type (e), humanized (f) and heterozygous humanized (g) mice DSB hotspots.
Extended Data Figure 5
Extended Data Figure 5. Differential epigenetic mark distributions at PRDM9 binding motifs
a, Enrichment of H3K4me3 marks at mouse motifs that are either within a B6 (left) or human (right) PRDM9 allele controlled DSB hotspot, or outside such a hotspot. The enrichment is relative to a control genomic track. Given the spread of the distributions, the interaction range between the histones and the DSB hotspot seems to be ~1.5 kb on each side of the motif. b, As a, for H3K36me3 marks. c, Mean coverage of H3K4me3 (left) or H3K36me3 (right) signal around the mouse motif nearest to each B6 DSB hotspot, split according to the strand on which the motif lies. d-h, As a, for H3K9ac (d), H3K27ac (e), H3K27me3 (f), H3K4me1 (g) and H3K79me2 (h) marks. All ChIP-seq data for histone modifications used in this analysis were obtained from the Mouse Encode Project.
Extended Data Figure 6
Extended Data Figure 6. Further features of DSB hotspot asymmetry
a-c, DSB hotspot asymmetry in (B6×PWD)F1B6/PWD and in (B6×PWD)F1H/PWD. a, Distribution of the fraction of (DMC1) informative reads originating from the B6 chromosome in the reciprocal (B6×PWD)F1B6/PWD mouse. PRDM9 control at each DSB is attributed either to the B6 allele (blue) or the PWD allele (pink) or is undeterminable (grey). b-c, As a, but showing fractions only for non-shared hotspots, unique to either the reciprocal (B6×PWD)F1B6/PWD (b) or the reciprocal rescue (B6×PWD)F1H/PWD (c) mice. d-e, Comparison of the levels of asymmetric binding in the (PWD×B6)F1PWD/B6 and (B6×CAST)F1B6/CAST mice, using H3K4me3 signal. d, Distributions of the fraction of H3K4me3 reads from the B6 chromosome in the two mice. We used raw data from ref. for the (B6×CAST)F1B6/CAST mouse, and processed both data sets in the same way. H3K4me3 heats were capped at the 95th percentile in each case, and only H3K4me3 binding peaks not inferred to be independent of PRDM9 binding (Supplementary Information Section 7), and overlapping with a DMC1 hotspot in the same mouse, were considered. e, Quantile-quantile plot for the distributions shown in d (blue). Dark grey: y=x line; light grey: 95% confidence band. f, Density plot comparing, for each hotspot in the (PWD×B6)F1PWD/B6 mouse, its DMC1 and H3K4me3 asymmetries. The correlation between the two measures is 0.93. g, Mutations within 1kb regions around B6 and PWD PRDM9 motifs, on the B6 and PWD genomes. Main plot: For each combination of motif and lineage (PWD or B6), we plot the fraction of 30bp windows, along the 1kb regions surrounding motif occurrences within DSB hotspots, where at least one SNP or indel mutation occurred along the respective lineage. Inset plot: Distribution of motif score differences (derived-ancestral) for motif changes shown in the main plot. Motif score was defined as the logarithm of the probability that a motif was drawn from the motif’s position weight matrix, in the ancestral sequence and in the current-day mouse. A negative difference indicates the motif match worsened along the corresponding lineage. This panel is based on the (PWD×B6)F1PWD/B6 DMC1 map. h, Mutations within 1kb regions around B6 PRDM9 motifs, on the B6 and CAST genomes, as in g, using the (B6×CAST)F1B6/CAST DMC1 map. We see no evidence of erosion of B6 PRDM9 motifs on the CAST genome.
Extended Data Figure 7
Extended Data Figure 7. Chromosome effects following Prdm9 humanization in B6B6/B6
a, Individual chromosome effects (relative to chromosome 1) when comparing DMC1 signals in the B6B6/H mouse relative to the B6B6/B6 mouse, for the DSB hotspots that are shared between these two mice. b, Comparison of the observed chromosome effects for DMC1 signals with the fitted chromosome effects, using the 2-predictor model including the sum of symmetric H3K4me3 heats in B6B6/B6 and in B6H/H. Bars conservatively show 3 SEs in both plots.
Extended Data Figure 8
Extended Data Figure 8. Value by chromosome and sensitivity analysis for the symmetry metric
a, Symmetry metric, as defined in the main text, for each sample (ALL), and for each autosome amongst those samples. Error bars represent bootstrap 95% CIs in all panels. b, Alternative symmetric metrics (to the ones reported in the main text), using only 10,000 hotspots per sample, or without weighting each chromosome specific metric, to compute the average metric genome-wide. Both metrics are computed using the DMC1 maps. c, Alternative symmetric metrics using H3K4me3 maps, similarly to b. The threshold of 12,540 hotspots per sample corresponds to the number of hotspots with ratio estimates in the (PWDxB6)F1PWD/H mouse, which was the lowest amongst the three samples shown here.
Extended Data Figure 9
Extended Data Figure 9. Asymmetric hotspots, hotspots on the X chromosome and hotspots opposite deletions show systematic increase of DMC1 heat, relative to symmetric hotspots
a, For the PWD allele in the humanized rescue (PWD×B6)F1PWD/H mouse, mean DMC1 signal is plotted in decile bins of H3K4me3 enrichment on the B6 chromosome (or the PWD X-chromosome), with error bars showing 95% CIs and lines of best fit (as in Fig. 4c). The slope of the line for asymmetric hotspots is 2.5-fold greater than that of the symmetric hotspots, and the slope for hotspots on the X-chromosome is 5.2-fold greater, illustrating that the DMC1 signal at asymmetric sites is elevated in a similar fashion to hotspots on the X-chromosome, which do not repair until late in meiosis. We found similar results in all cases tested. b, Comparison of DMC1 heats on B6 chromosome for hotspots shared between the humanized B6H/H and the humanized rescue (PWD×B6)F1PWD/H mice, under humanized PRDM9 control. We show symmetric hotspots (fraction of DMC1 informative reads between 0.4 and 0.6, green), and hotspots opposite a deletion on the PWD chromosome (deletion of at least 200bp, encompassing a human PRDM9 binding motif, black). The black line represents the median DMC1 heat for symmetric hotspots. c, As b, but showing the asymmetric hotspots (fraction of DMC1 informative reads above 0.9, red), with the corresponding median line. Hotspots opposite PWD deletion show a significant elevation in DMC1 heat relative to symmetric hotspots (14/16 hotspots above the symmetric median line, p=0.004). This elevation is similar to the one showed by asymmetric hotspots (9/16 hotspots above the asymmetric median line, p=0.80). d, Barplot showing the genome-wide ratio of mean DMC1 heat to mean H3K4me3 enrichment for asymmetric hotspots relative to symmetric hotspots in 9 scenarios studied, each for a different combination of mouse, Prdm9 allele, and haplotype, with error bars representing 95% bootstrap CIs for the ratio of means. In all cases, asymmetric hotspots show an elevation in DMC1 signal for a given H3K4me3 signal. e, Ratio of mean DMC1 and H3K4me3 signals on the B6 chromosome for the humanized allele in the humanized rescue mouse. Hotspots are clustered according to the fractions of their H3K4me3 signal that is on the B6 chromosome (r), and the ratio of the mean DMC1 and H3K4me3 signals in each class is shown here. The whiskers show 95% CIs for the mean, estimated using bootstrapping. When r>0.5, the B6 chromosome has greater H3K4me3 than the PWD chromosome, and vice versa. The ratio could not be estimated for r<=0.01 due to H3K4me3 levels being zero or nearly zero in those cases. f, (Left) Ratio of mean DMC1 and H3K4me3 signals on the B6 chromosome compared with the H3K4me3 signal on the PWD chromosome (log scale) in the infertile mouse. Asymmetric hotspots were defined as those with H3K4me3 fraction on the B6 chromosome > 0.9, and symmetric hotspots were those with the fraction between 0.1 and 0.9. Hotspots that we estimated to be completely asymmetric (H3K4me3 fraction=0 on either chromosome) or those with H3K4me3 enrichment on either chromosome close to zero (enrichment < 0.05) were excluded to avoid singularities on either axis. Asymmetric hotspots were binned into 4 bins of equal size and symmetric hotspots were binned into 10 bins of equal size. Different numbers of bins were used for asymmetric and symmetric hotspots to get approximately similar confidence intervals (error bars represent 95% CIs) to enable comparison. We did not observe many weak symmetric hotspots as we have limited power to detect such hotspots, which is why there are no symmetric bins with very low H3K4me3 levels on the homologue (Right). As (Left), but with the ratio determined for the PWD chromosome relative to H3K4me3 on the B6 chromosome. Accordingly, asymmetric hotspots are defined as those with H3K4me3 fraction on the PWD chromosome > 0.9.
Extended Data Figure 10
Extended Data Figure 10. Elevation of DMC1 asymmetric heat is not explained by GC content, local heterozygosity, differences in binding motif-disrupting mutations or by outliers
a-f, Comparison of DMC1 signals in the infertile (PWD×B6)F1PWD/B6 mouse, at symmetric and asymmetric hotspots respectively, binned by H3K4me3 enrichment, after matching symmetric and asymmetric hotspots on various features: a, DMC1 heat in B6B6/B6; b, local heterozygosity outside the PRDM9 binding motif, in a 500bp window; c, as b, but for a 1kb window; d, number of SNPs in binding motif; e, number of indels in binding motif; f, local GC content, computed in a 200bp window around hotspot centre. g, Distributions of the ratios of H3K4me3 heats on the B6 chromosome, in the rescue (PWD×B6)F1PWD/H vs humanized B6H/H mice, for the symmetric (fraction of informative DMC1 reads in the range 0.4-0.6, green) and asymmetric (fraction 0.9-1, orange) hotspots under humanized PRDM9 control shared between the two mice. The distributions are very close, suggesting similar trimethylation by PRDM9 on the B6 chromosome in both mice. h, As g, but for the DMC1 heats. Despite similar trimethylation marking by PRDM9 in both mice, we observed striking changes in the distribution of DMC1 ratios. This could be due to either more breaks occurring at the asymmetric sites, or a longer time taken to repair them. i, Quantile-quantile plots of DMC1 heats for hotspots under the control of the human allele on the B6 chromosome in the rescue (PWD×B6)F1PWD/H (y-axis, left) vs the humanized B6H/H (x-axis) mice, for symmetric (green) and asymmetric (orange) hotspots. Dotted line represents the ratios of asymmetric to symmetric quantiles (excluding distribution tails; y-axis, right). Dashed line represents expected ratio if there were no differences between symmetric and asymmetric hotspots. The observed ratio of DMC1 quantiles is constant across DMC1 heats, emphasizing that the increase in DMC1 heat at asymmetric sites is very similar across the whole range of DMC1 heats, and does not simply result from a few outlying hotspots.
Figure 1
Figure 1. Humanizing the ZF domain of PRDM9 does not impact fertility
a, Domain structure of the re-engineered PRDM9 protein b, γH2AX staining of the sex body (green), SYCP3 staining of the chromosome axis (red) in late pachytene in B6B6/B6 (top) and B6H/H (bottom). c, As b, but for (PWD×B6)F1PWD/B6 and (PWD×B6)F1PWD/H. d, SYCP1 staining of the synaptonemal-complex transverse filament (green), and SYCP3 staining of the chromosome axis (red) in pachytene for (PWD×B6)F1PWD/B6 and (PWD×B6)F1PWD/H. Arrows: unsynapsed autosomes. Scale bars: 10 μm.
Figure 2
Figure 2. DSB hotspot asymmetry in hybrids
a, Distribution of the fraction of reads originating from the B6 chromosome in the infertile (PWD×B6)F1PWD/B6. PRDM9 control at each hotspot is attributed to B6 (blue), PWD (pink) or undetermined (grey). b, As a, but for non-shared hotspots, unique to either the rescue (PWD×B6)F1PWD/H (top) or the infertile (PWD×B6)F1PWD/B6 (bottom). c, Relative contributions of B6 and humanized PRDM9 to DMC1 signal in (B6/CAST)F2B6/H. Bars represent the three possible genomic backgrounds. d, Individual chromosome effects (relative to Chromosome 1) when comparing DMC1 signals in (PWD×B6)F1PWD/B6 relative to (PWD×B6)F1PWD/H, for shared DSB hotspots. Bars: 1 SE. e, As d, but for H3K4me3. f, Comparison of DMC1 chromosome effects (as in d) with the fitted chromosome effects, using a model including the symmetric hotspot measures for the three Prdm9 alleles. Bars: 3 SE (95% simultaneous confidence level for 19 chromosomes).
Figure 3
Figure 3. Humanizing PRDM9 restores proper synapsis and rescues fertility in hybrids
a, Fertility metrics in hybrid mice. Bars: bootstrap 95% CI (symmetry metric), or 1 SE. b, Chromosome effects in DMC1 signals (as Fig. 2d) versus previously reported asynapsis rates for five chromosomes in infertile (PWD×B6)F1PWD/B6. Bars: 1 SE.
Figure 4
Figure 4. Asymmetric DSB hotspots show elevated DMC1 signals but no H3K4me3 elevation
a, Comparison of B6H/H and (PWD×B6)F1PWD/H DMC1 signals (medians shown). Signals are compared for symmetric and asymmetric hotspots in (PWD×B6)F1PWD/H, on the shared B6 chromosomes. Bars: 95% CIs. b, As a, but for H3K4me3. c, Comparison of DMC1 signals in (PWD×B6)F1PWD/B6, at symmetric and asymmetric hotspots, binned by H3K4me3 enrichment (medians shown). H3K4me3 and DMC1 signals are estimated on the PWD chromosome only, for hotspots associated with B6 PRDM9.

Comment in

References

    1. Presgraves DC. The molecular evolutionary basis of species formation. Nat Rev Genet. 2010;11:175–180. 10.1038/nrg2718. - PubMed
    1. Mihola O, Trachtulec Z, Vlcek C, Schimenti JC, Forejt J. A mouse speciation gene encodes a meiotic histone H3 methyltransferase. Science. 2009;323:373–375. 10.1126/science.1163601. - PubMed
    1. Oliver PL, et al. Accelerated evolution of the Prdm9 speciation gene across diverse metazoan taxa. PLoS genetics. 2009;5:e1000753. 10.1371/journal.pgen.1000753. - PMC - PubMed
    1. Gregorova S, Forejt J. PWD/Ph and PWK/Ph inbred mouse strains of Mus m. musculus subspecies--a valuable resource of phenotypic variations and genomic polymorphisms. Folia biologica. 2000;46:31–41. - PubMed
    1. Bhattacharyya T, et al. Mechanistic basis of infertility of mouse intersubspecific hybrids. Proceedings of the National Academy of Sciences of the United States of America. 2013;110:E468–477. 10.1073/pnas.1219126110. - PMC - PubMed

Additional references for methods

    1. Chen CM, Krohn J, Bhattacharya S, Davies B. A comparison of exogenous promoter activity at the ROSA26 locus using a PhiiC31 integrase mediated cassette exchange approach in mouse ES cells. PloS one. 2011;6:e23376. 10.1371/journal.pone.0023376. - PMC - PubMed
    1. Daniel K, et al. Meiotic homologue alignment and its quality surveillance are controlled by mouse HORMAD1. Nature cell biology. 2011;13:599–610. 10.1038/ncb2213. - PMC - PubMed
    1. Barchi M, et al. ATM promotes the obligate XY crossover and both crossover control and chromosome axis integrity on autosomes. PLoS Genet. 2008;4:e1000076. 10.1371/journal.pgen.1000076. - PMC - PubMed
    1. Peters AH, Plug AW, van Vugt MJ, de Boer P. A drying-down technique for the spreading of mammalian meiocytes from the male and female germline. Chromosome research : an international journal on the molecular, supramolecular and evolutionary aspects of chromosome biology. 1997;5:66–68. - PubMed
    1. Anderson LK, Reeves A, Webb LM, Ashley T. Distribution of crossing over on mouse synaptonemal complexes using immunofluorescent localization of MLH1 protein. Genetics. 1999;151:1569–1579. - PMC - PubMed

Publication types

MeSH terms

Substances

Associated data