. 2016 Feb 11;530(7589):228-232.
doi: 10.1038/nature16996. Epub 2016 Feb 3.

Real-time, portable genome sequencing for Ebola surveillance

Joshua Quick #  1 Nicholas J Loman #  1 Sophie Duraffour #  2   3 Jared T Simpson #  4   5 Ettore Severi #  6 Lauren Cowley #  7 Joseph Akoi Bore  2 Raymond Koundouno  2 Gytis Dudas  8 Amy Mikhail  7 Nobila Ouédraogo  9 Babak Afrough  2   10 Amadou Bah  2   11 Jonathan Hj Baum  2 Beate Becker-Ziaja  2   3 Jan-Peter Boettcher  2   12 Mar Cabeza-Cabrerizo  2   3 Alvaro Camino-Sanchez  2 Lisa L Carter  2   13 Juiliane Doerrbecker  2   3 Theresa Enkirch  2   14 Isabel Graciela García Dorival  2   15 Nicole Hetzelt  2   12 Julia Hinzmann  2   12 Tobias Holm  2   3 Liana Eleni Kafetzopoulou  2   16 Michel Koropogui  2   17 Abigail Kosgey  2   18 Eeva Kuisma  2   10 Christopher H Logue  2   10 Antonio Mazzarelli  2   19 Sarah Meisel  2   3 Marc Mertens  2   20 Janine Michel  2   12 Didier Ngabo  2   10 Katja Nitzsche  2   3 Elisa Pallash  2   3 Livia Victoria Patrono  2   3 Jasmine Portmann  2   21 Johanna Gabriella Repits  2   22 Natasha Yasmin Rickett  2   15   23 Andrea Sachse  2   12 Katrin Singethan  2   24 Inês Vitoriano  2   10 Rahel L Yemanaberhan  2   3 Elsa G Zekeng  2   15   23 Racine Trina  25 Alexander Bello  25 Amadou Alpha Sall  26 Ousmane Faye  26 Oumar Faye  26 N'Faly Magassouba  27 Cecelia V Williams  28   29 Victoria Amburgey  28   29 Linda Winona  28   29 Emily Davis  29   30 Jon Gerlach  29   30 Franck Washington  29   30 Vanessa Monteil  31 Marine Jourdain  31 Marion Bererd  31 Alimou Camara  31 Hermann Somlare  31 Abdoulaye Camara  31 Marianne Gerard  31 Guillaume Bado  31 Bernard Baillet  31 Déborah Delaune  32   33 Koumpingnin Yacouba Nebie  34 Abdoulaye Diarra  34 Yacouba Savane  34 Raymond Bernard Pallawo  34 Giovanna Jaramillo Gutierrez  35 Natacha Milhano  36   6 Isabelle Roger  34 Christopher J Williams  37   6 Facinet Yattara  17 Kuiama Lewandowski  10 Jamie Taylor  38 Philip Rachwal  38 Daniel Turner  39 Georgios Pollakis  15   23 Julian A Hiscox  15   23 David A Matthews  40 Matthew K O'Shea  1   41 Andrew McD Johnston  41 Duncan Wilson  41 Emma Hutley  42 Erasmus Smit  43 Antonino Di Caro  19 Roman Woelfel  2   44 Kilian Stoecker  3   44 Erna Fleischmann  2   44 Martin Gabriel  2   3 Simon A Weller  38 Lamine Koivogui  45 Boubacar Diallo  34 Sakoba Keita  17 Andrew Rambaut  8   46   47 Pierre Formenty  34 Stephan Gunther  2   3 Miles W Carroll  2   10   48   49
Affiliations

Real-time, portable genome sequencing for Ebola surveillance

Joshua Quick et al. Nature. .

Abstract

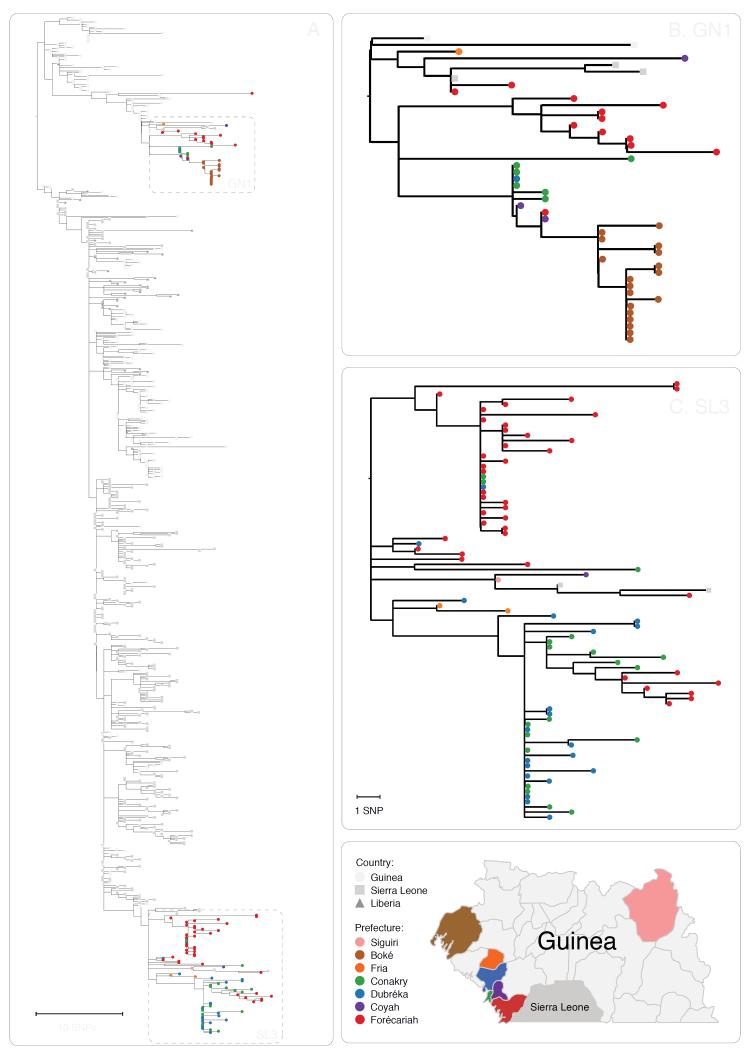
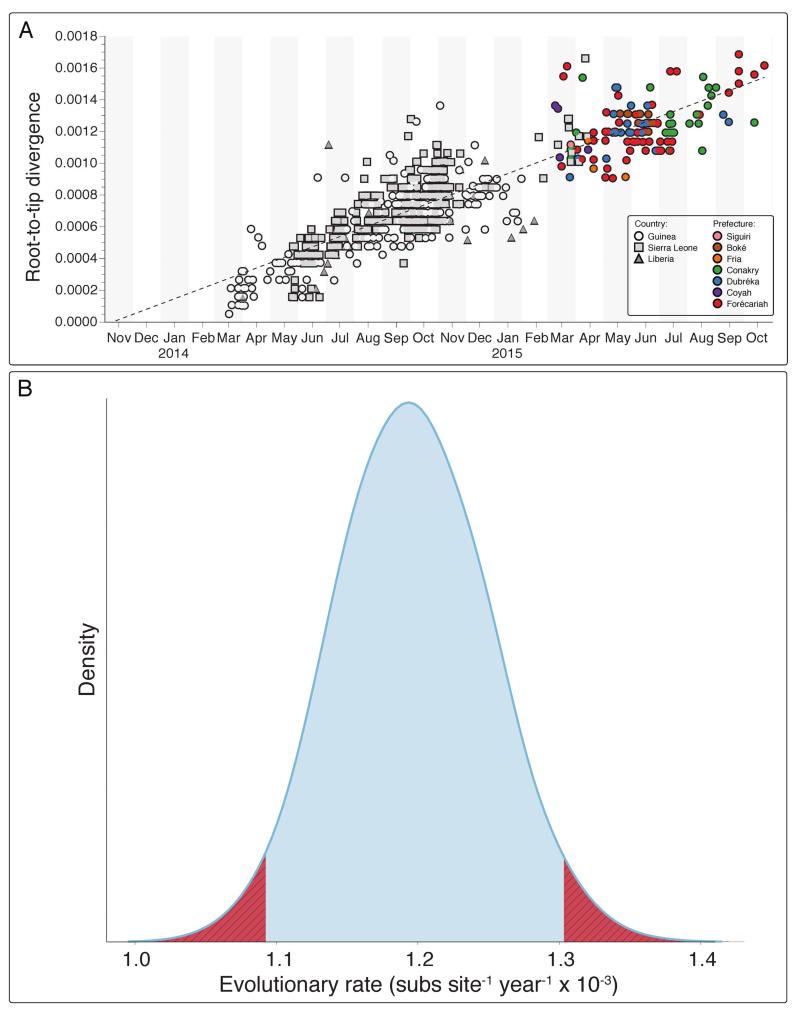
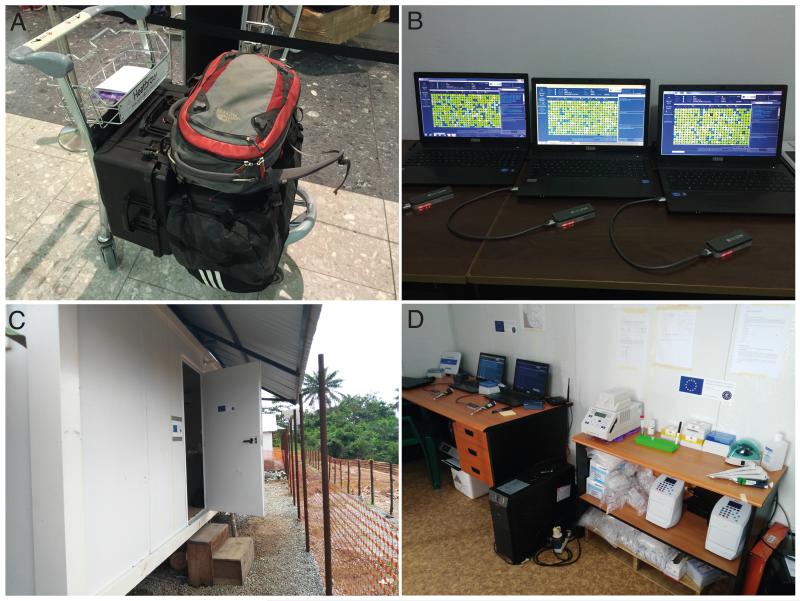
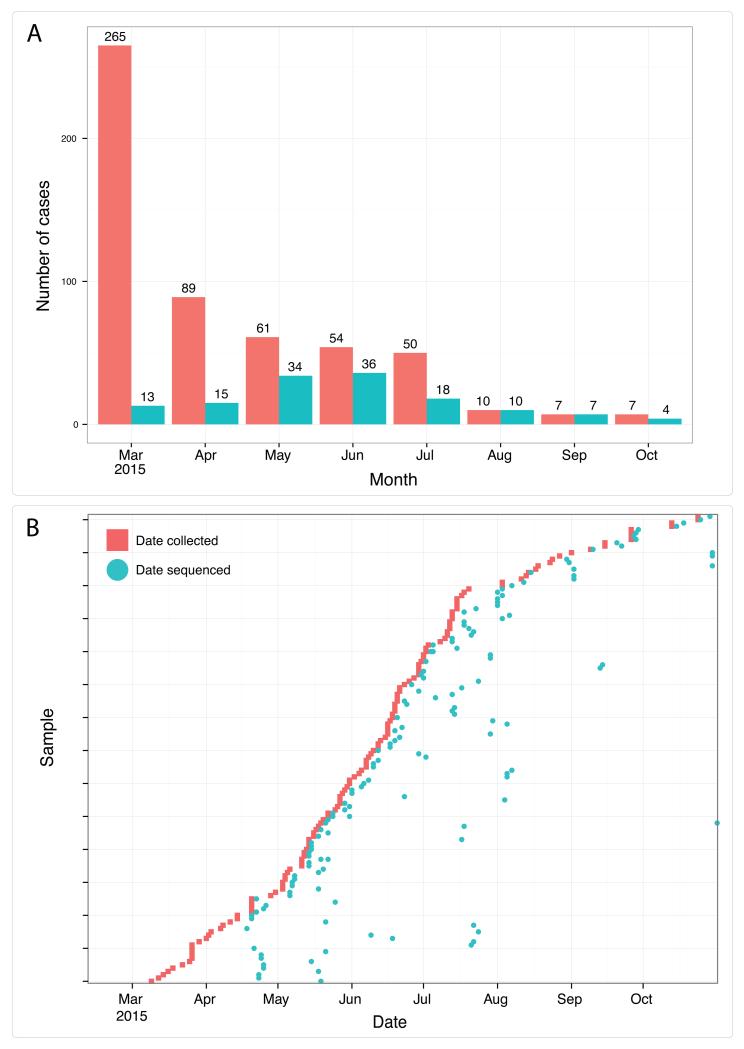
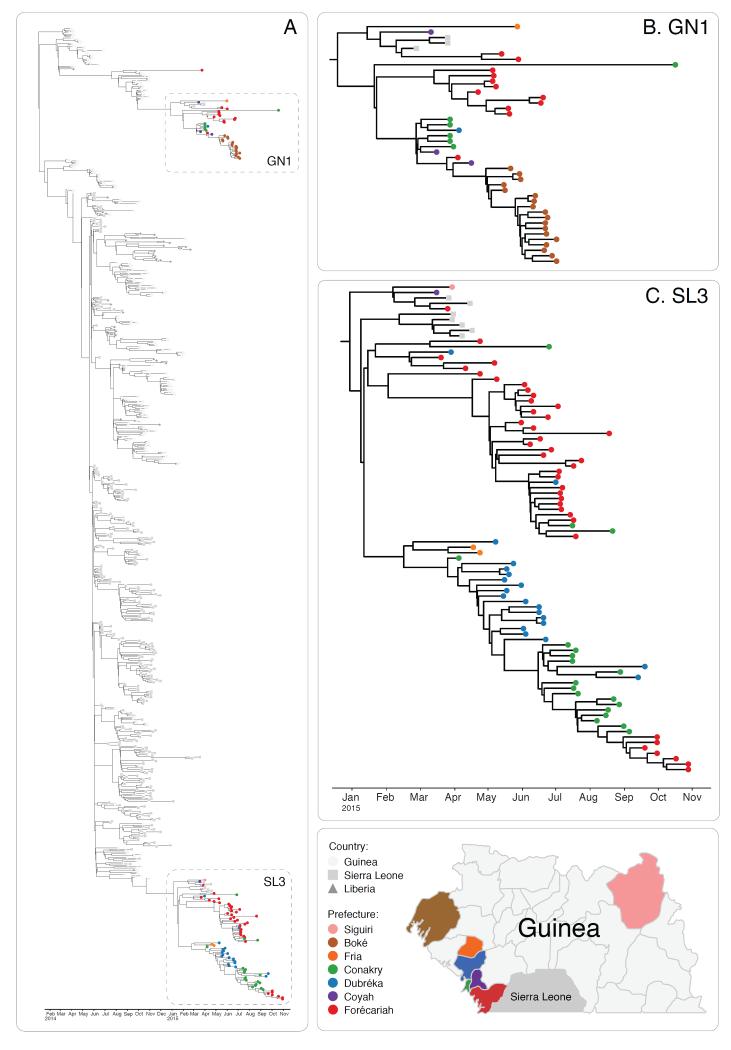
The Ebola virus disease epidemic in West Africa is the largest on record, responsible for over 28,599 cases and more than 11,299 deaths. Genome sequencing in viral outbreaks is desirable to characterize the infectious agent and determine its evolutionary rate. Genome sequencing also allows the identification of signatures of host adaptation, identification and monitoring of diagnostic targets, and characterization of responses to vaccines and treatments. The Ebola virus (EBOV) genome substitution rate in the Makona strain has been estimated at between 0.87 × 10(-3) and 1.42 × 10(-3) mutations per site per year. This is equivalent to 16-27 mutations in each genome, meaning that sequences diverge rapidly enough to identify distinct sub-lineages during a prolonged epidemic. Genome sequencing provides a high-resolution view of pathogen evolution and is increasingly sought after for outbreak surveillance. Sequence data may be used to guide control measures, but only if the results are generated quickly enough to inform interventions. Genomic surveillance during the epidemic has been sporadic owing to a lack of local sequencing capacity coupled with practical difficulties transporting samples to remote sequencing facilities. To address this problem, here we devise a genomic surveillance system that utilizes a novel nanopore DNA sequencing instrument. In April 2015 this system was transported in standard airline luggage to Guinea and used for real-time genomic surveillance of the ongoing epidemic. We present sequence data and analysis of 142 EBOV samples collected during the period March to October 2015. We were able to generate results less than 24 h after receiving an Ebola-positive sample, with the sequencing process taking as little as 15-60 min. We show that real-time genomic surveillance is possible in resource-limited settings and can be established rapidly to monitor outbreaks.


Figures

<b>Extended Figure 1</b>.
Extended Figure 1.. Primer schemes employed during the study
We designed PCR primers to generate amplicons that would span the EBOV genome. We initially designed 38 primer pairs which were used in the initial validation study and which cover >98% of the EBOV genome (Panel A). During in-field sequencing we used a 19 reaction scheme or 11 reaction scheme which generated longer products. The predicted amplicon products are shown with forward primers and reverse primers indicated by green bars on the forward and reverse strand respectively, scaled according to the EBOV virus coordinates. The amplicon product sizes expected are shown for the 19 reaction scheme (Panel B) and the 11 reaction scheme (Panel C). No amplicon covers the extreme 3′ region of the genome. The last primer pair, 38_R, ends at position 18578, 381 bases away from the end of the virus genome. The primer diagram was created with Biopython .
<b>Extended Figure 2</b>.
Extended Figure 2.. List of equipment and consumables to establish the genome surveillance system
We show the list of equipment (Panel A), disposable consumables (Panel B) and reagents (Panel C) to establish in-field genomic surveillance. Sufficient reagents were shipped for 20 samples. MinION sequencing requires a mix of chilled and frozen reagents. Recommended shipping conditions are specified. The picture underneath depicts MinION flowcells ready for shipping with insulating material (left) and frozen reagents (right).
<b>Extended Figure 3</b>.
Extended Figure 3.. Bioinformatics workflow
This figure summarises the steps performed during bioinformatics analysis (ordered from top to bottom), in order to generate consensus sequences. The right column shows the example UNIX command executed at each step.
<b>Extended Figure 4</b>.
Extended Figure 4.. Results of MinION validation
The results of comparing four MinION sequences with Illumina sequences generated as part of a previous study are shown in Panel A. Each row in the table demonstrates the number of true positives, false positives and false negatives for a sample. False negatives may result in masked sequences, due to being outside of regions covered by the amplicon scheme, having low coverage or falling within a primer binding site. Results before and after quality filtering (log-likelihood ratio of >200) are shown. After quality filtering, no false positive calls were detected. All detected false negatives were masked with Ns in the final consensus sequence. No positions were called incorrectly. The four consensus sequences, plus an additional sample that had missing coverage in one amplicon are shown as part of a phylogenetic reconstruction with genomes from Carroll et al. . Sample labels in red, blue, pink, yellow and blue represent pairs of sequences generated on MinION and llumina that fall into identical clusters.
<b>Extended Figure 5</b>.
Extended Figure 5.. Relationship between coverage and log-likelihood ratio for sample 076769
Line-plot showing the relationship between sequence depth of coverage (x axis) and the log-likelihood ratio for detected SNPs derived by subsampling reads from a single sequencing run to simulate the effect of low coverage. The horizontal and vertical line indicates the cut-offs (quality and coverage respectively) for consensus calling. Therefore, all variants are detected below 25x coverage, and the vast majority meet the threshold quality at 25x coverage or slightly above. Any combination of log likelihood ratio or coverage which placed variants in the grey box would be represented as a masked position in the final consensus sequence.
<b>Extended Figure 6</b>.
Extended Figure 6.. Duration of MinION sequencing runs
For each sequence run the sequencing duration, measured as the difference between timestamp of the first read seen and the last read transferred for analysis. 127 runs are shown, with 15 outliers with duration greater than 200 minutes excluded.
<b>Extended Figure 7</b>.
Extended Figure 7.. Histogram of Ct values for study samples
Ct values for samples in the study (where information was available) ranged between 13.8 and 35.7, with a mean of 22.
<b>Extended Figure 8</b>.
Extended Figure 8.. Sequence accuracy for samples
Accuracy measurements for the entire set of two-direction reads were made for the validation samples, sequenced in the United Kingdom (Panel A) and each of the 142 samples from real-time genomic surveillance (Panel B). Accuracy is defined according to the definition from Quick et al. . Vertical dashed lines indicate the mean accuracy for the sample.
<b>Extended Figure 9</b>.
Extended Figure 9.. Maximum Likelihood phylogenetic inference of 125 Ebola virus samples from this study with 603 previously published sequences
Coloured nodes are from this study. Node shape reflects country of origin. Panel A depicts the entire dataset, with zoomed regions focusing on lineages GN1 (Panel B) and SL3 (Panel C) identified during real-time sequencing. Map figure adapted from SimpleMaps website (http://simplemaps.com/resources/svg-gn).
<b>Extended Figure 10</b>.
Extended Figure 10.
Root-to-tip divergence plot for the 728 Ebola samples generated through Maximum-Likelihood analysis (Panel A). Samples from real-time genomic surveillance are coloured as per Figure 3 and Extended Figure 2. Panel B. Mean evolutionary rate estimate (in substitutions per site per year) across the EBOV phylogeny recovered using BEAST under a relaxed lognormal molecular clock Blue area corresponds to the 95% highest posterior density (HPD) (mean of the distribution is 1.19E-3, 95% HPDs: 1.09 - 1.29 E-3 substitutions per site per year). Hatched regions in red are outside the 95% HPD intervals.
Figure 1
Figure 1. Deployment of the portable genome surveillance system in Guinea
We were able to pack all instruments, reagents and disposable consumables within aircraft baggage (Panel A). We initially established the genomic surveillance laboratory in Donka Hospital, Conakry (Panel B). Later we moved the laboratory to a dedicated sequencing laboratory in Coyah prefecture (Panel C). Within this laboratory (Panel D) we separated the sequencing instruments (on the left) from the PCR bench (to the right). An uninterruptable power supply can be seen in the middle which provides power to the thermocycler. (Photographs taken by Josh Quick and Sophie Duraffour.)
Figure 2
Figure 2. Real-time genomics surveillance in context of the Guinea EVD epidemic
Here we show the number of reported cases of EVD in Guinea (red) in relation to the number of EBOV new patient samples (n=137, in blue) generated during this study (Panel A). For each of the 142 sequenced samples, we show the relationship between sample collection date (red) and the date of sequencing (blue) (Panel B). Twenty-eight samples were sequenced within three days of the sample being taken, and sixty-eight samples within a week. Larger gaps represent retrospective sequencing of cases to provide additional epidemiological context.
Figure 3
Figure 3. Evolution of EBOV over the course of the EVD epidemic
Time-scaled phylogeny of 603 published sequences with 125 high quality sequences from this study (Panel A). The shape of nodes on the tree demonstrates country of origin. Our results show Guinean samples (coloured circles) belong to two previously identified lineages, GN1 and SL3. GN1 is deeply branching with early epidemic samples (Panel B). SL3 is related to cases identified in Sierra Leone (Panel C). Samples are frequently clustered by geography (indicated by colour of circle) and this provides information as to origins of new introductions, such as in the Boké epidemic in May 2015. Map figure adapted from SimpleMaps website (http://simplemaps.com/resources/svg-gn).

Comment in

Similar articles

  • Genetic diversity and evolutionary dynamics of Ebola virus in Sierra Leone.
    Tong YG, Shi WF, Liu D, Qian J, Liang L, Bo XC, Liu J, Ren HG, Fan H, Ni M, Sun Y, Jin Y, Teng Y, Li Z, Kargbo D, Dafae F, Kanu A, Chen CC, Lan ZH, Jiang H, Luo Y, Lu HJ, Zhang XG, Yang F, Hu Y, Cao YX, Deng YQ, Su HX, Sun Y, Liu WS, Wang Z, Wang CY, Bu ZY, Guo ZD, Zhang LB, Nie WM, Bai CQ, Sun CH, An XP, Xu PS, Zhang XL, Huang Y, Mi ZQ, Yu D, Yao HW, Feng Y, Xia ZP, Zheng XX, Yang ST, Lu B, Jiang JF, Kargbo B, He FC, Gao GF, Cao WC; China Mobile Laboratory Testing Team in Sierra Leone. Tong YG, et al. Nature. 2015 Aug 6;524(7563):93-6. doi: 10.1038/nature14490. Epub 2015 May 13. Nature. 2015. PMID: 25970247 Free PMC article.
  • Temporal and spatial analysis of the 2014-2015 Ebola virus outbreak in West Africa.
    Carroll MW, Matthews DA, Hiscox JA, Elmore MJ, Pollakis G, Rambaut A, Hewson R, García-Dorival I, Bore JA, Koundouno R, Abdellati S, Afrough B, Aiyepada J, Akhilomen P, Asogun D, Atkinson B, Badusche M, Bah A, Bate S, Baumann J, Becker D, Becker-Ziaja B, Bocquin A, Borremans B, Bosworth A, Boettcher JP, Cannas A, Carletti F, Castilletti C, Clark S, Colavita F, Diederich S, Donatus A, Duraffour S, Ehichioya D, Ellerbrok H, Fernandez-Garcia MD, Fizet A, Fleischmann E, Gryseels S, Hermelink A, Hinzmann J, Hopf-Guevara U, Ighodalo Y, Jameson L, Kelterbaum A, Kis Z, Kloth S, Kohl C, Korva M, Kraus A, Kuisma E, Kurth A, Liedigk B, Logue CH, Lüdtke A, Maes P, McCowen J, Mély S, Mertens M, Meschi S, Meyer B, Michel J, Molkenthin P, Muñoz-Fontela C, Muth D, Newman EN, Ngabo D, Oestereich L, Okosun J, Olokor T, Omiunu R, Omomoh E, Pallasch E, Pályi B, Portmann J, Pottage T, Pratt C, Priesnitz S, Quartu S, Rappe J, Repits J, Richter M, Rudolf M, Sachse A, Schmidt KM, Schudt G, Strecker T, Thom R, Thomas S, Tobin E, Tolley H, Trautner J, Vermoesen T, Vitoriano I, Wagner M, Wolff S, Yue C, Capobianchi MR, Kretschmer B, Hall Y, Kenny JG, Rickett NY, Dudas G, Coltart CE, Kerber R, Steer D, Wrigh… See abstract for full author list ➔ Carroll MW, et al. Nature. 2015 Aug 6;524(7563):97-101. doi: 10.1038/nature14594. Epub 2015 Jun 17. Nature. 2015. PMID: 26083749 Free PMC article.
  • Genomic surveillance elucidates Ebola virus origin and transmission during the 2014 outbreak.
    Gire SK, Goba A, Andersen KG, Sealfon RS, Park DJ, Kanneh L, Jalloh S, Momoh M, Fullah M, Dudas G, Wohl S, Moses LM, Yozwiak NL, Winnicki S, Matranga CB, Malboeuf CM, Qu J, Gladden AD, Schaffner SF, Yang X, Jiang PP, Nekoui M, Colubri A, Coomber MR, Fonnie M, Moigboi A, Gbakie M, Kamara FK, Tucker V, Konuwa E, Saffa S, Sellu J, Jalloh AA, Kovoma A, Koninga J, Mustapha I, Kargbo K, Foday M, Yillah M, Kanneh F, Robert W, Massally JL, Chapman SB, Bochicchio J, Murphy C, Nusbaum C, Young S, Birren BW, Grant DS, Scheiffelin JS, Lander ES, Happi C, Gevao SM, Gnirke A, Rambaut A, Garry RF, Khan SH, Sabeti PC. Gire SK, et al. Science. 2014 Sep 12;345(6202):1369-72. doi: 10.1126/science.1259657. Epub 2014 Aug 28. Science. 2014. PMID: 25214632 Free PMC article.
  • The evolution of Ebola virus: Insights from the 2013-2016 epidemic.
    Holmes EC, Dudas G, Rambaut A, Andersen KG. Holmes EC, et al. Nature. 2016 Oct 13;538(7624):193-200. doi: 10.1038/nature19790. Nature. 2016. PMID: 27734858 Free PMC article. Review.
  • Ebolavirus Evolution: Past and Present.
    de La Vega MA, Stein D, Kobinger GP. de La Vega MA, et al. PLoS Pathog. 2015 Nov 12;11(11):e1005221. doi: 10.1371/journal.ppat.1005221. eCollection 2015. PLoS Pathog. 2015. PMID: 26562671 Free PMC article. Review.

Cited by

References

    1. World Health Organisation [11 November 2015];Ebola Situation Report. 2015 at < http://apps.who.int/ebola/current-situation/ebola-situation-report-11-no...>.
    1. Gire SK, et al. Genomic surveillance elucidates Ebola virus origin and transmission during the 2014 outbreak. Science. 2014;345:1369–1372. - PMC - PubMed
    1. Carroll MW, et al. Temporal and spatial analysis of the 2014-2015 Ebola virus outbreak in West Africa. Nature. 2015;524:97–101. - PMC - PubMed
    1. Simon-Loriere E, et al. Distinct lineages of Ebola virus in Guinea during the 2014 West African epidemic. Nature. 2015;524:102–104. - PMC - PubMed
    1. Park DJ, et al. Ebola Virus Epidemiology, Transmission, and Evolution during Seven Months in Sierra Leone. Cell. 2015;161:1516–1526. - PMC - PubMed

Publication types