. 2016 Mar 3;531(7592):101-4.
doi: 10.1038/nature16941. Epub 2016 Feb 3.

Late acquisition of mitochondria by a host with chimaeric prokaryotic ancestry

Affiliations

Late acquisition of mitochondria by a host with chimaeric prokaryotic ancestry

Alexandros A Pittis et al. Nature. .

Abstract

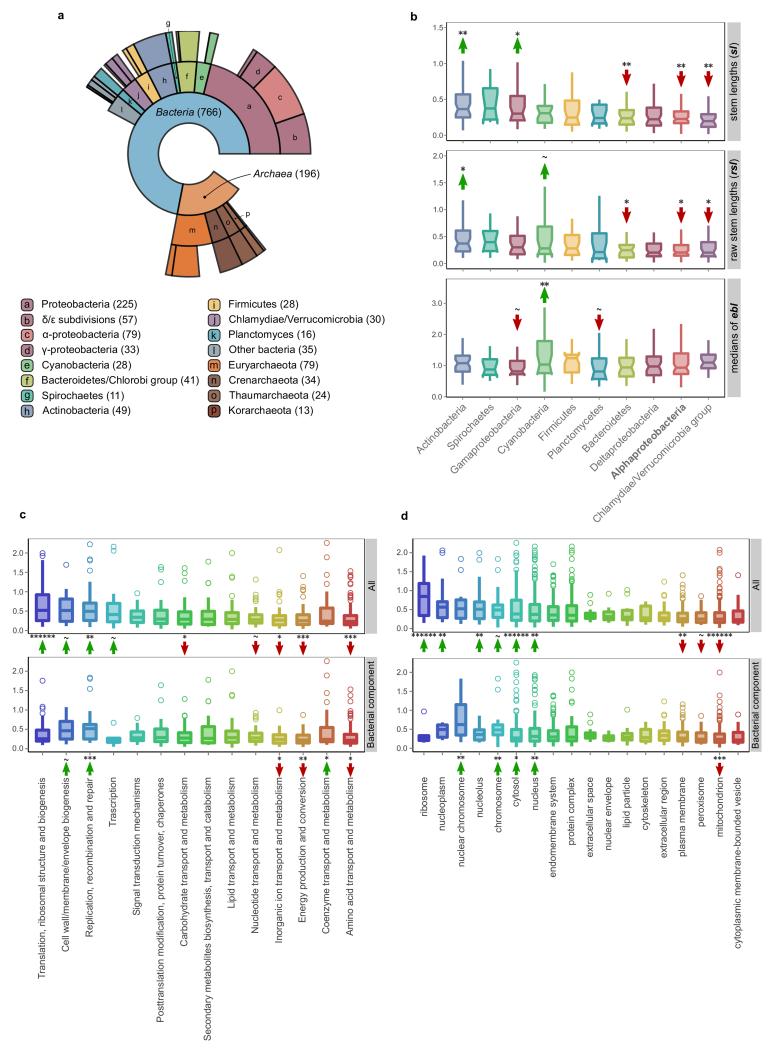
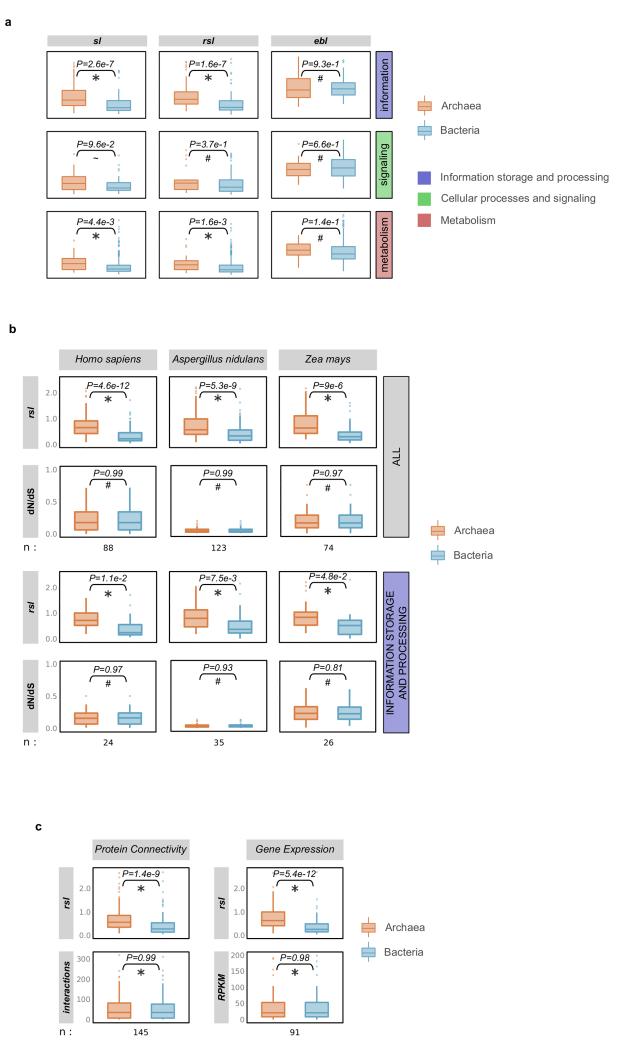
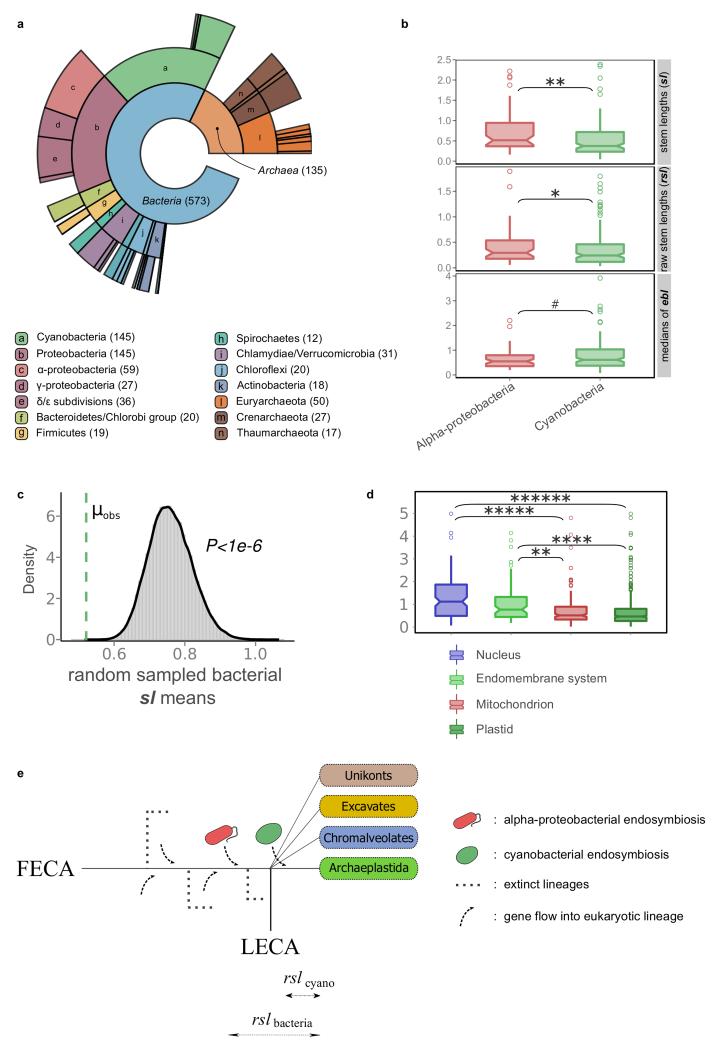
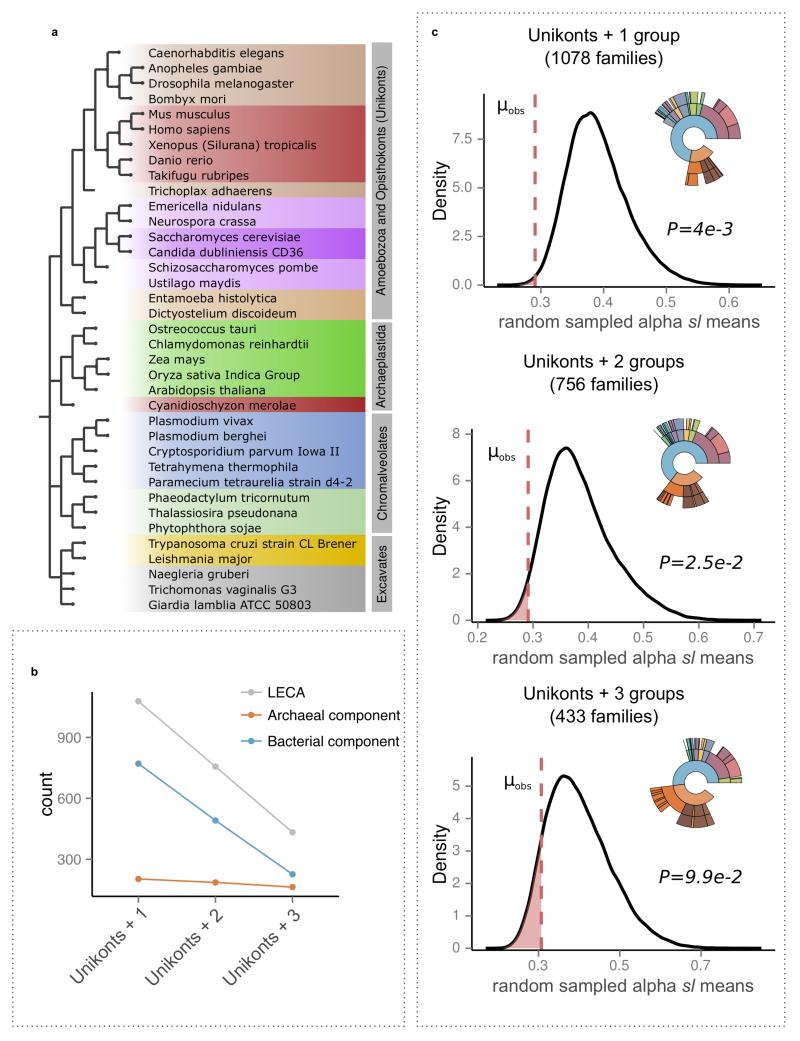
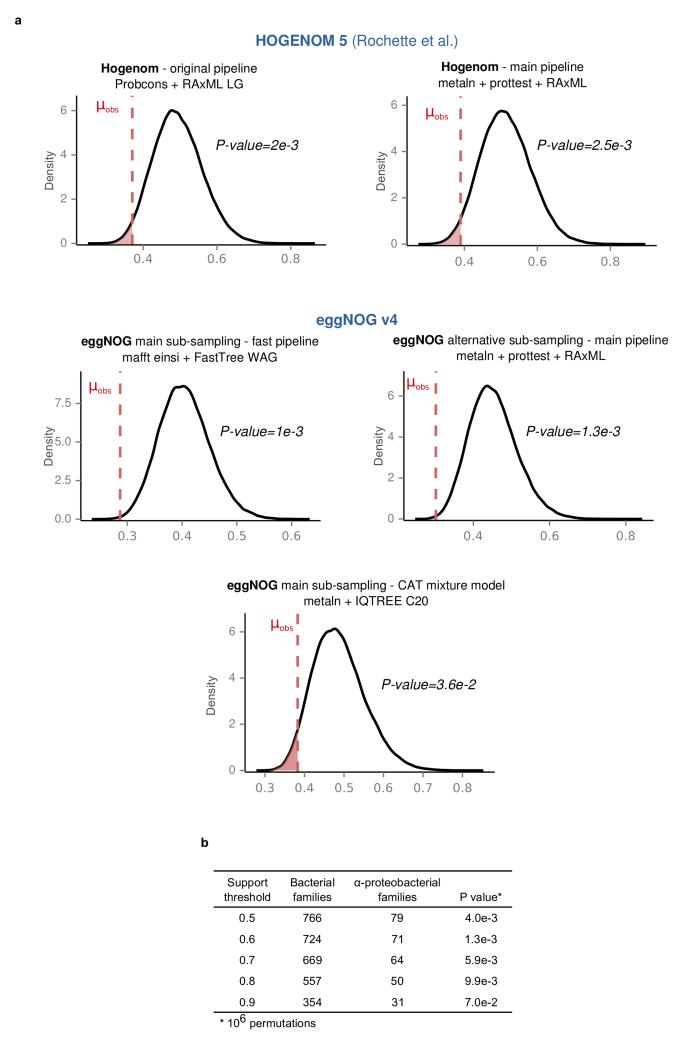
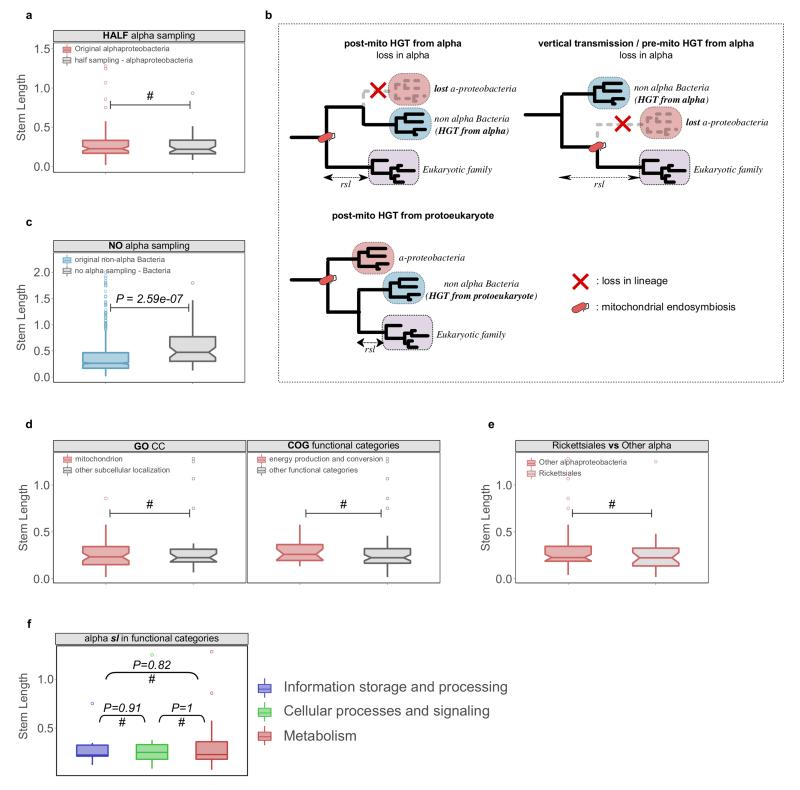
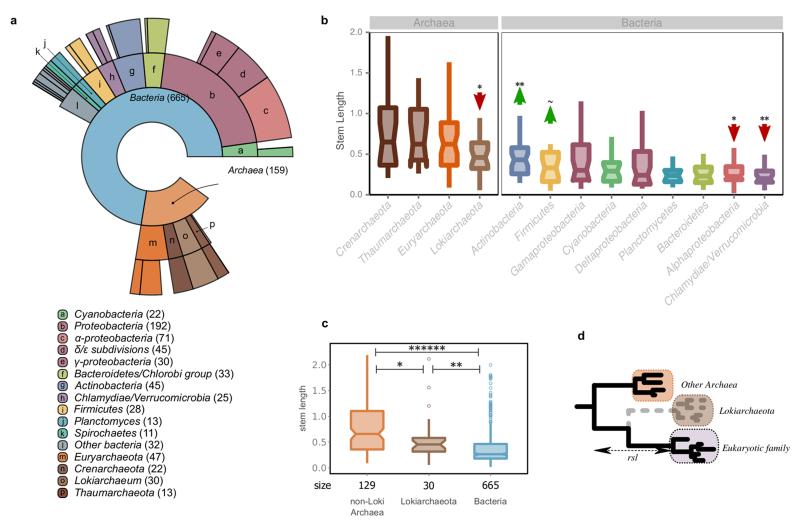
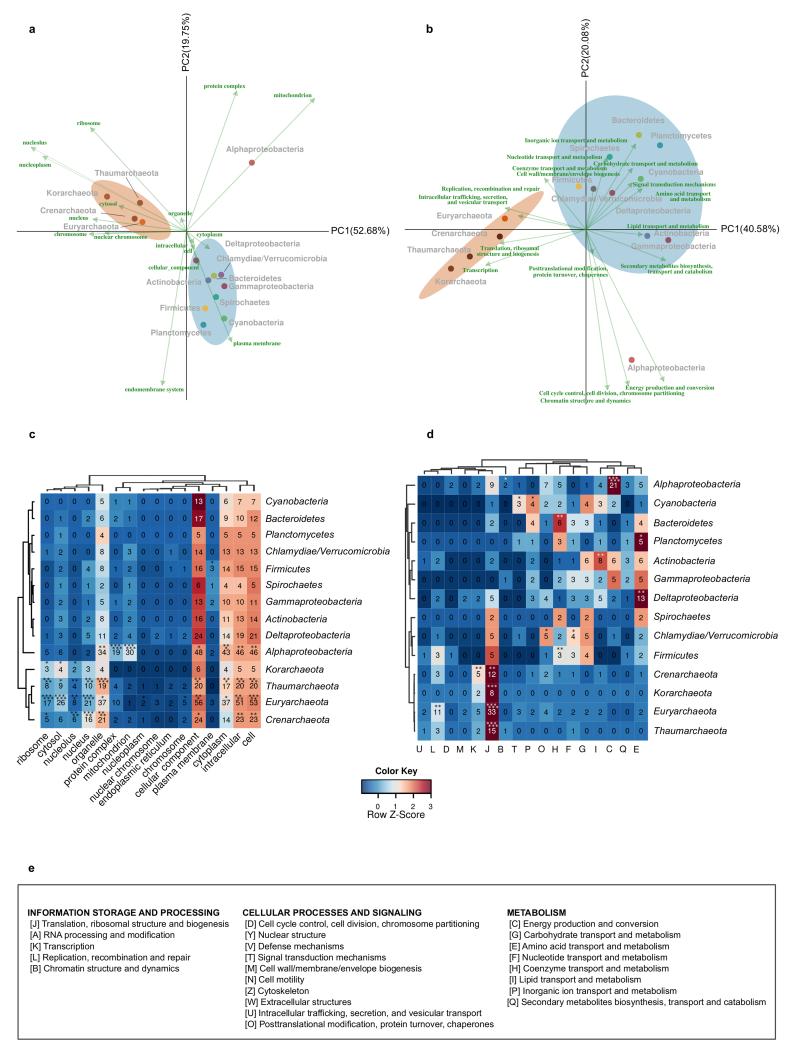
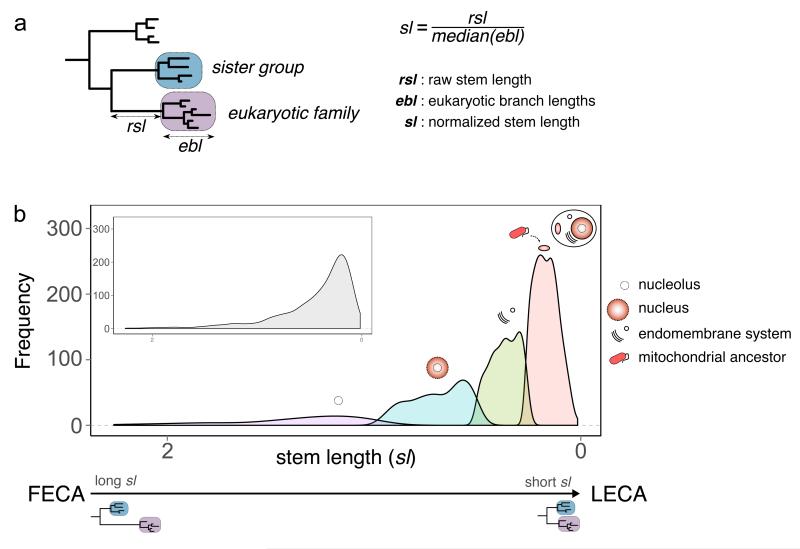
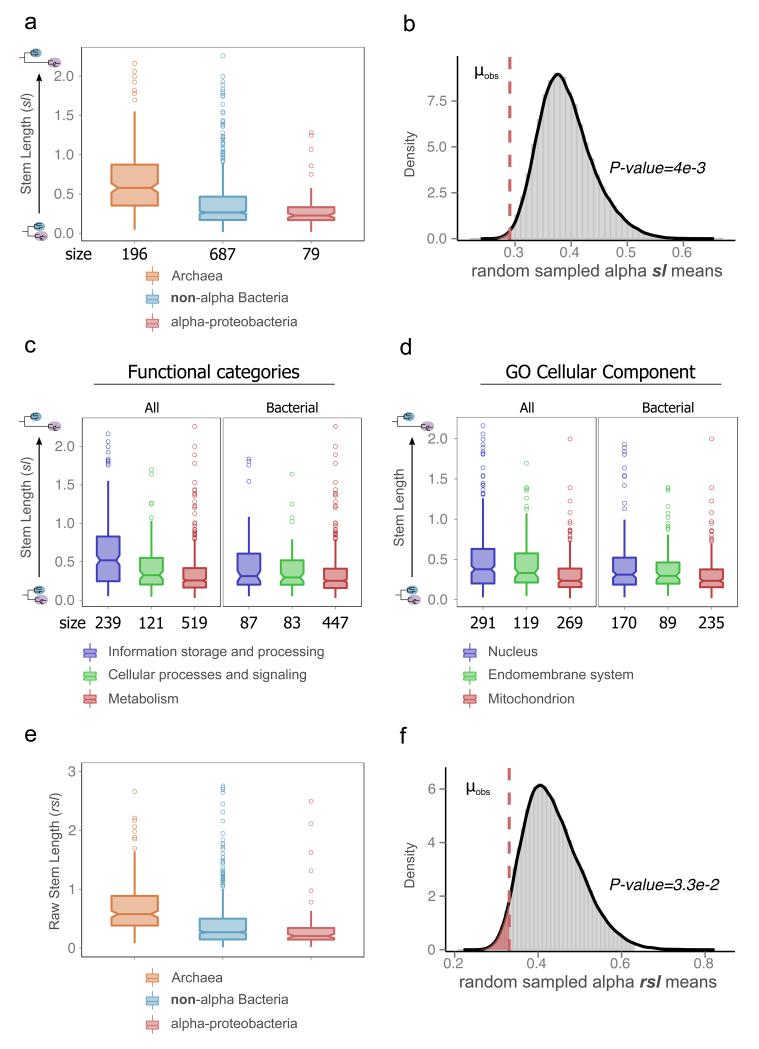
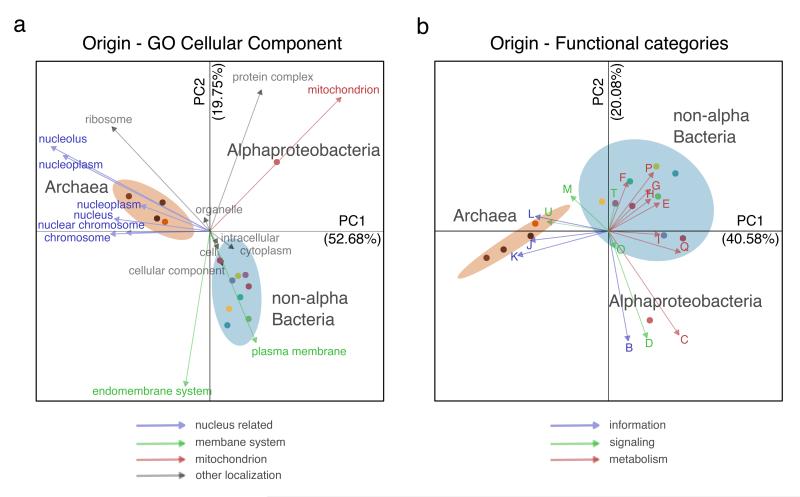
The origin of eukaryotes stands as a major conundrum in biology. Current evidence indicates that the last eukaryotic common ancestor already possessed many eukaryotic hallmarks, including a complex subcellular organization. In addition, the lack of evolutionary intermediates challenges the elucidation of the relative order of emergence of eukaryotic traits. Mitochondria are ubiquitous organelles derived from an alphaproteobacterial endosymbiont. Different hypotheses disagree on whether mitochondria were acquired early or late during eukaryogenesis. Similarly, the nature and complexity of the receiving host are debated, with models ranging from a simple prokaryotic host to an already complex proto-eukaryote. Most competing scenarios can be roughly grouped into either mito-early, which consider the driving force of eukaryogenesis to be mitochondrial endosymbiosis into a simple host, or mito-late, which postulate that a significant complexity predated mitochondrial endosymbiosis. Here we provide evidence for late mitochondrial endosymbiosis. We use phylogenomics to directly test whether proto-mitochondrial proteins were acquired earlier or later than other proteins of the last eukaryotic common ancestor. We find that last eukaryotic common ancestor protein families of alphaproteobacterial ancestry and of mitochondrial localization show the shortest phylogenetic distances to their closest prokaryotic relatives, compared with proteins of different prokaryotic origin or cellular localization. Altogether, our results shed new light on a long-standing question and provide compelling support for the late acquisition of mitochondria into a host that already had a proteome of chimaeric phylogenetic origin. We argue that mitochondrial endosymbiosis was one of the ultimate steps in eukaryogenesis and that it provided the definitive selective advantage to mitochondria-bearing eukaryotes over less complex forms.


Figures

Extended Data Figure 1
Extended Data Figure 1. Sister group distribution (a) and extended phylogenetic distance profiles of different prokaryotic sources (b), cellular functions (c) and cellular components (d)
a, Ring plot showing the distribution of inferred prokaryotic origins. Inner layers represent hierarchically lower (broader) taxonomic levels. The number of LECA families assigned to each group is indicated in parentheses next to the corresponding level in the ring plot or in the boxes below. b, Box plot showing the distributions of branch lengths in the different bacterial components. Measured stem lengths (sl), raw stem lengths (rsl), and the medians of the lengths from LECA to branch tips inside the eukaryotic families (ebl), as defined in Fig. 1a, are shown. Permutation tests were performed to evaluate the statistical significance of the differences between the distributions. A total of 106 permutations were performed, with the values being randomly shuffled in each permutation (see also Methods). The arrows and symbols above the boxes refer to the statistical significance of the differences observed when compared to randomly shuffled distributions (lower values, downward red arrow; higher values upward green arrow). The correspondence between the symbols and the P values is as follows: “~” for P<=1e-1, “*” for P<=5e-2, “**” for P<=1e-2, “***” for P<=1e-3, “****” for P<=1e-4, “*****” for P<=1e-5 and “******” for P<1e-6. c-d, The stem length profiles of the various functional categories (c) and GO slim cellular components (d) are shown. As in Fig. 2c, the stem lengths are also evaluated by looking at only the bacterial component in order to exclude the possibility that the observed differences are due solely to archaeal-bacterial differences. The significance was assessed with permutation tests (106 permutations) and is indicated with arrows as in (b).
Extended Data Figure 2
Extended Data Figure 2. Families of archaeal origin have significantly longer stems than families of bacterial origin across different functional categories (a), similar selective pressures (b) and connectivities/expression levels (c)
a, The stem lengths, raw stem lengths and eukaryotic branch lengths, between families of archaeal and bacterial inferred origin, are compared across the three major functional categories. While the eukaryotic branch lengths among the groups do not show significant differences, differences are detected in their respective stems (raw stem lengths and stem lengths). b, Archaeal and bacterial LECA families of similar selective pressures (as measured by dN/dS values across family members) differ significantly in terms of their raw stem lengths. Sets of families from both groups were matched with respect to their dN/dS values in the indicated reference species. dN/dS data were downloaded from Ensembl for family members corresponding to Homo sapiens (Metazoa), Aspergillus nidulans (fungi) and Zea mays (plants) (see Supplementary Information section 1). The comparison of the raw stem lengths of the two sets shows that archaeal families generally have significantly longer stems (upper plots), and functions within the “information storage and processing” category (lower plots), irrespective of their selective pressures. c, Archaeal and bacterial LECA families of similar connectivity/expression levels show significantly different raw stem lengths (rsl) (see Supplementary Information section 1). In both (a), (b) and (c), differences between the archaeal and bacterial component were evaluated with a two-tail Mann-Whitney U test and the P value is indicated in each case (“*” for P<=5e-2, “~” for P<= 1e-1, “#” for P>1).
Extended Data Figure 3
Extended Data Figure 3. Analysis of the cyanobacterial signal in primary plastid-bearing eukaryotes
a, Ring plot showing the distribution of inferred prokaryotic origins in widespread plant protein families, as in Extended Data Fig. 1a. The profile of inferred origins of eukaryotes that acquired a plastid through primary endosymbiosis carry a strong signal from the cyanobacterial endosymbiont. b, Families of inferred cyanobacterial origin have significantly shorter stem lengths and raw stem lengths than alpha-proteobacterial families and c, than the random distribution of stem lengths from the bacteria inferred component, pointing to a more recent acquisition of plastids (post-LECA). d, Overall, as with mitochondrial localized proteins, those proteins localized to plastids have shorter stems than the nuclear and endomembrane system proteins. e, Schematic representation of the expected difference in stems, given that cyanobacterial endosymbiosis occurred after the diversification of the major eukaryotic lineages. As confirmed, the raw stem lengths measured from plant protein families to their common ancestor with cyanobacteria are shorter than those whose origin can be traced back to alpha-proteobacteria or other bacterial groups. Two-tail Mann-Whitney U test P value symbols in (b) and (d) are as in Extended Data Fig. 1.
Extended Data Figure 4
Extended Data Figure 4. Effect of alternative LECA definitions
a, The four eukaryotic groups including all 37 selected eukaryotic species used in the analysis are shown next to the NCBI taxonomic structure, with the higher groupings modified according to the Tree of Life Project (http://tolweb.org/Eukaryotes/3). b, Stricter LECA definitions have a much larger effect on the bacterial component as compared to the archaeal component, which is more widespread among eukaryotic groups. c, The effect of different LECA definitions in terms of taxonomic assignments and differences in stem lengths between proteins of alpha-proteobacterial origins and those derived from other bacteria. Numbers in parenthesis indicate the total number of LECA families that passed the threshold. The kernel density plots, as in Fig. 2b, show the observed stem length means for alpha-proteobacteria as compared to 106 random samplings among values in protein families of bacterial origin. The observed means (μobs) are shown with a dashed red line, reflecting the P value of each test, and indicated next to the plot. See also Supplementary Information section 3.1.
Extended Data Figure 5
Extended Data Figure 5. Alpha-proteobacterial derived proteins have consistently shorter branches irrespective of the methods, datasets and support thresholds
Kernel density plots of the random mean distributions of the stem lengths are shown for the different methods, datasets and support thresholds used (see also Supplementary Information sections 3.2-3.3). The observed alpha-proteobacterial means (μobs) are as in Fig. 2b. a. Results after using either, the phylogenetic trees provided by the authors in Rochette et. al. (upper left), our standard phylogenetic pipeline applied to their sampling of sequences (upper right), or alternative phylogenetic pipelines or samplings from EggNOG (lower). b, The main result is robust against progressively stricter support thresholds up until the sample size becomes too small (support threshold >0.9). Numbers in parenthesis indicate the number of bacteria inferred LECA families for each threshold.
Extended Data Figure 6
Extended Data Figure 6. Evaluation of alternative HGT scenarios and other potential biases
a, The sampling effect was simulated by artificially removing part or all of the alpha-proteobacterial sequences in the final datasets. To simulate the potential bias caused by an enriched sampling of alpha-proteobacteria an artificial reduction of alpha-proteobacterial sequences to 50% was applied to the dataset (HALF alpha sampling). The reduction of alpha-proteobacterial sequences by 50% does not significantly change the inferred stem length within families of alpha-proteobacterial origin. b, Different scenarios of HGT to the proto-mitochondrion are unable to explain the observed signal in families mapped to non-alpha Bacteria. The transfer of a gene from alpha-proteobacteria to another bacterial lineage after mitochondrial endosymbiosis and its parallel loss from the lineage of the mitochondrial ancestor (“post-mito HGT from alpha”) would result in unchanged stem lengths. Loss of a gene from the alpha-proteobacterial sister clade would result in an increase of the inferred stem lengths (“vertical transmission / pre-mito HGT from alpha”). The transfer of a gene from the protoeukaryotic lineage to other bacterial clades would result in shorter stem lengths compared to the alpha-proteobacterial mappings (“post-mito HGT from protoeukaryote”). c, Upon total exclusion of alpha-proteobacterial sequences (NO alpha sampling), eukaryotic families map to other bacterial groups but with stem length higher than those observed typically. The same is observed when comparing the stem lengths of the families mapping to proteobacterial groups in the absence of alpha-proteobacteria, to those typically mapping to proteobacterial groups other than alpha-proteobacteria. d, Boxplots showing that there are no significant differences in the stem lengths between alpha-proteobacterial families with mitochondrial localization when compared to those with other subcellular localizations (left), or between families involved in energy related functions compared to those involved in other functional categories (right). e, Boxplot showing no significant difference between the distribution of stem lengths of families of Rickettsiales inferred origin and other alpha-proteobacteria. f, Alpha-proteobacterial families in different functional categories show no difference in stem lengths. In all the cases the distributions were compared using a two-sided Mann-Whitney U test. See also Supplementary Information sections 4-5.
Extended Data Figure 7
Extended Data Figure 7. LECA inference and Lokiarchaeota
Results after the inclusion of Lokiarchaeota in our analysis. a, The distribution of the sister group inference among prokaryotic taxonomy is shown in a ring plot together with the number of families in each group in parentheses (as in Extended Data Fig. 1). b, Boxplot showing the stem length profiles of the various prokaryotic groups. Lokiarchaeota show the lowest values among all archaeal groups but higher values than any bacterial group. The symbols correspond to the same P values explained in Extended Data Fig. 1 after applying a permutation test (106 permutations) for the archaeal and bacterial components, independently. c, Boxplot with the comparison between the non-Loki archaeal, the Lokiarchaeota and the bacterial stem length profiles. The P value symbols are as before (two-sided Mann-Whitney U test, frd correction). d, Schematic representation of the effect of the absence of Lokiarchaeum sequences on the stem lengths. The inferred origin of 30 eukaryotic families that were previously mapped to other, mainly archaeal, groups within the eggNOG v4 DB, is Lokiarchaeota, when homologous sequences from this metagenome are included. A reduction in the observed stem lengths of the families of Lokiarchaeota inferred origin is expected in the scenario of Lokiarchaeota being the closest known archaeal relative of Eukaryotes. See also Supplementary Information section 6.
Extended Data Figure 8
Extended Data Figure 8. Different LECA components have different GO cellular components (a,c) and functional (b,d) profiles
Genes of different origin tend to have different functions and sub-cellular localizations. a-b, The same CA symmetric biplots as in Fig. 3 in higher resolution, with the names of the taxonomic group, the function and the GO slim terms, indicated next to the coordinates. The percentage of variance explained by each principal component is indicated next to each axis in parenthesis. c-d, The contingency tables also used in CA are shown in the form of a heatmap. The asterisks in the different cells reflect the significance of the association between a given origin and a localization (c) or function (b), as computed using permutation tests (106 permutations), where the annotations among each eukaryotic family were reshuffled (see Methods). The correspondence between the symbols and the P values is as in Extended Data Fig. 1. e, The COG functional categories, as organized in the three major groups “Information storage and processing”, “cellular processes and signaling” and “metabolism”.
Figure 1
Figure 1. Stem length analysis
a. Schematic representation of the inference of the phylogenetic origin of LECA groups and the measured phylogenetic distances. First monophyletic groups of eukaryotic proteins that passed the required thresholds were considered as protein families present in LECA (purple box). The taxonomic range of the proteins present in the closest neighbouring tree partition (sister group, blue box) was used to define the putative phylogenetic origin of the LECA family. Distance to the common ancestor with the closest prokaryotic neighbouring group was measured (rsl) and normalized (sl) by dividing it by the median of the distances from the eukaryotic terminal nodes to the last common ancestor of all eukaryotic sequences (ebl). b. Subpopulation distributions within the overall stem length distribution (inset) as defined by a mixture model and the expectation-maximization (EM) algorithm. The four subpopulations/components are over-represented in different prokaryotic phylogenetic groups of origin, GO and COG functional category annotations (see text, Table 1, and Supplementary Tables 1 and 2). On top of these components, we represent the cellular localizations for which each family class is enriched. FECA indicates First Eukaryotic Common Ancestor.
Figure 2
Figure 2. Phylogenetic distance profiles of different prokaryotic sources (a-b), cellular functions (c) and cellular components (d)
a. Boxplot comparing stem length distributions in LECA families with archaeal, non-alpha Bacterial and alpha-proteobacterial sister-groups. Numbers on the X-axis indicate the number of families included in each class. Symbols indicate the P values obtained from a two-sided Mann-Whitney U test for the indicated comparisons as follows: “~” for P<=1e-1, “*” for P<=5e-2, “**” for P<=1e-2, “***” for P<=1e-3, “****” for P<=1e-4, “*****” for P<=1e-5 and “******” for P<1e-6. b. The observed mean (μobs) stem length of alpha-proteobacterial values as compared to the random sampling distribution of means, under the null hypothesis that families of different bacterial origins do not show differences in stem lengths. The P value is the probability that the mean would be at least as extreme as the observed, if the null hypothesis were true. The dashed line, and the shaded area under the density plot correspond to the one-sided P value of the test (indicated next to the figure). c-d. Boxplots of stem length distributions in LECA families of different COG functional categories (c) and GO localizations (d), when considering all LECA families (All), or only those of bacterial descent (Bacterial). Other symbols as in a. e-f. The results obtained in (a) and (b) are consistent when using raw stem lengths, indicating that the relative differences in stem lengths are not driven by differences in the rates of evolution within extant eukaryotes (ebl).
Figure 3
Figure 3. The correspondence of different LECA components with different cellular localizations (a) and functions (b)
Correspondence analysis (CA) symmetric biplot showing differences between the localizations (a) and functions (b) of the families of various phylogenetic origins. In both cases, the first principal components, accounting for the largest percentage of variance explained, clearly separate the bacterial and archaeal (brown ellipse) eukaryotic origins, while the second components separate the alpha-proteobacterial (red dot) from the other bacterial origins (cyan ellipse). The numbers next to the principal axes (PC1-2) show the percentage of the total variance explained by each component. Both columns (functions or localizations) and rows (phylogenetic origins) are in principal coordinates. The colours of the arrows, cellular localizations (left), and functional categories (right), correspond to the categories and localizations of Fig. 2d and c, accordingly (see methods for more details). If a term cannot be categorized as above, the colour is grey. Dots are coloured according to the phylogenetic origin of the group as in Extended Data Fig. 1a (see also extended version of this figure in Extended Data Fig. 8).

Comment in

  • Evolution: Mitochondria in the second act.
    Ettema TJ. Ettema TJ. Nature. 2016 Mar 3;531(7592):39-40. doi: 10.1038/nature16876. Epub 2016 Feb 3. Nature. 2016. PMID: 26840482 No abstract available.
  • Late Mitochondrial Origin Is an Artifact.
    Martin WF, Roettger M, Ku C, Garg SG, Nelson-Sathi S, Landan G. Martin WF, et al. Genome Biol Evol. 2017 Feb 1;9(2):373-379. doi: 10.1093/gbe/evx027. Genome Biol Evol. 2017. PMID: 28199635 Free PMC article.

References

    1. Koonin EV. The origin and early evolution of eukaryotes in the light of phylogenomics. Genome Biol. 2010;11:209. - PMC - PubMed
    1. Embley TM, Martin WF. Eukaryotic evolution, changes and challenges. Nature. 2006;440:623–30. - PubMed
    1. Koumandou VL, et al. Molecular paleontology and complexity in the last eukaryotic common ancestor. Crit. Rev. Biochem. Mol. Biol. 2013;48:373–96. - PMC - PubMed
    1. Gray MW, Burger G, Lang BF. Mitochondrial evolution. Science. 1999;283:1476–1481. - PubMed
    1. Poole AM, Gribaldo S. Eukaryotic Origins: How and When Was the Mitochondrion Acquired? Cold Spring Harb. Perspect. Biol. 2014 doi: 10.1101/cshperspect.a015990. - DOI - PMC - PubMed

Publication types

Substances