Comparative Study
. 2016 Apr;279(1):239-45.
doi: 10.1148/radiol.2016152601. Epub 2016 Feb 3.

Abdominal Imaging with Contrast-enhanced Photon-counting CT: First Human Experience

Affiliations
Comparative Study

Abdominal Imaging with Contrast-enhanced Photon-counting CT: First Human Experience

Amir Pourmorteza et al. Radiology. 2016 Apr.

Abstract

Purpose: To evaluate the performance of a prototype photon-counting detector (PCD) computed tomography (CT) system for abdominal CT in humans and to compare the results with a conventional energy-integrating detector (EID).

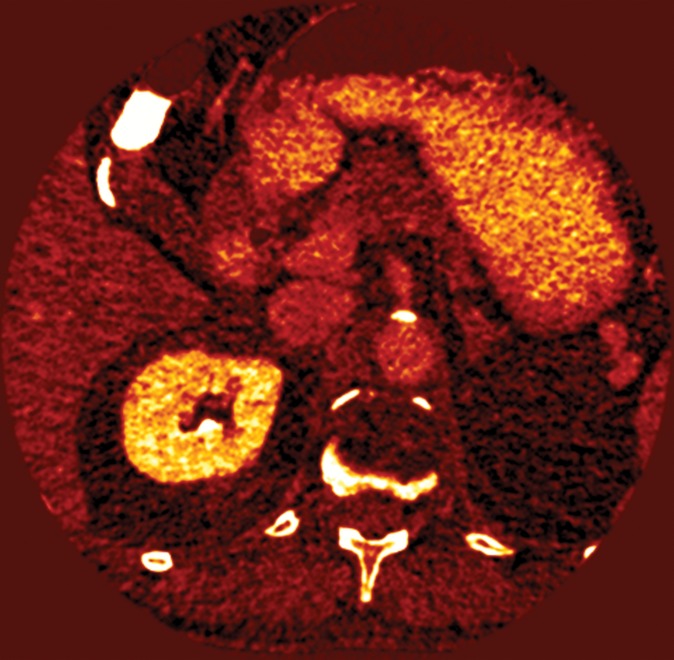
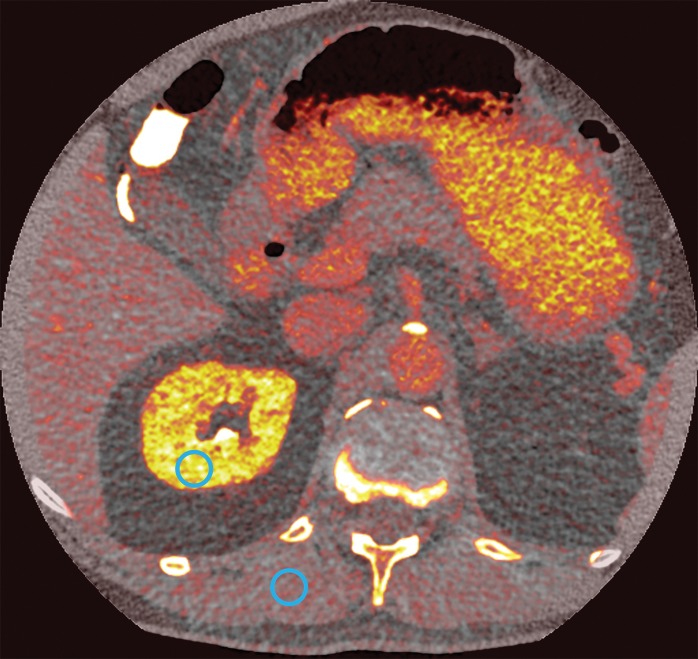
Materials and methods: The study was HIPAA-compliant and institutional review board-approved with informed consent. Fifteen asymptomatic volunteers (seven men; mean age, 58.2 years ± 9.8 [standard deviation]) were prospectively enrolled between September 2 and November 13, 2015. Radiation dose-matched delayed contrast agent-enhanced spiral and axial abdominal EID and PCD scans were acquired. Spiral images were scored for image quality (Wilcoxon signed-rank test) in five regions of interest by three radiologists blinded to the detector system, and the axial scans were used to assess Hounsfield unit accuracy in seven regions of interest (paired t test). Intraclass correlation coefficient (ICC) was used to assess reproducibility. PCD images were also used to calculate iodine concentration maps. Spatial resolution, noise-power spectrum, and Hounsfield unit accuracy of the systems were estimated by using a CT phantom.

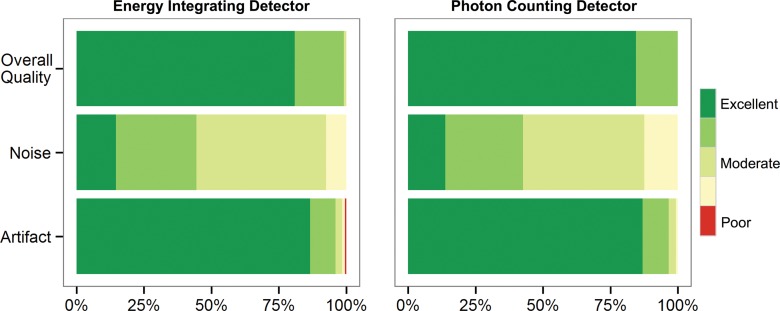
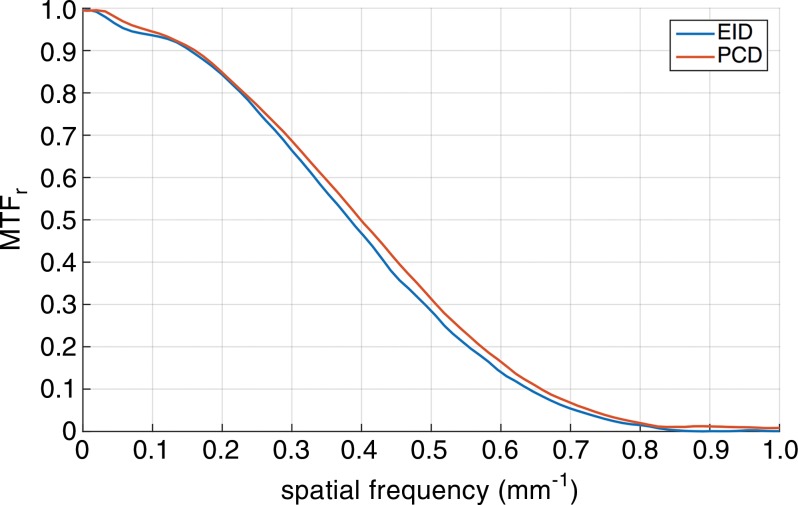
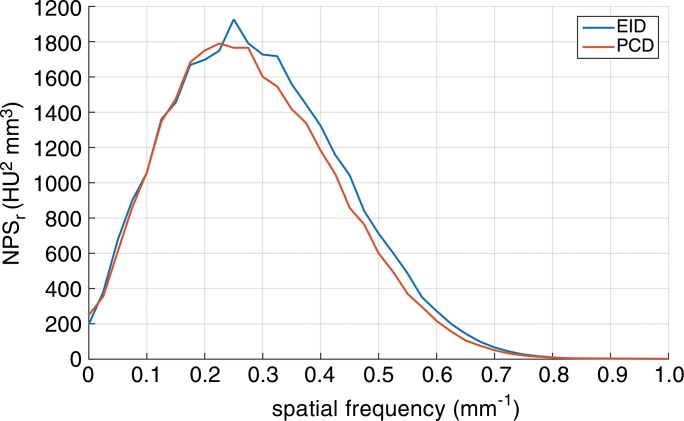
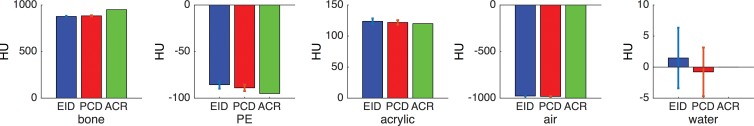
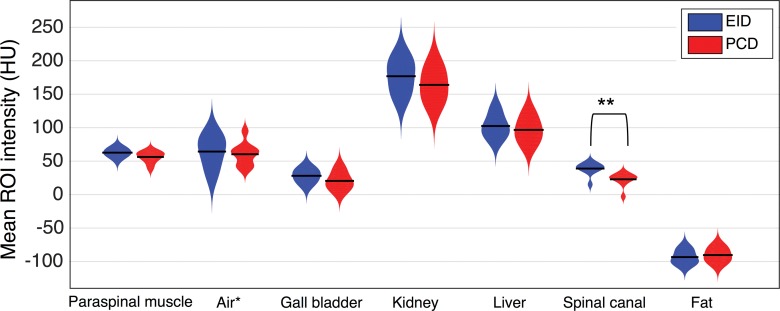
Results: In both systems, scores were similar for image quality (median score, 4; P = .19), noise (median score, 3; P = .30), and artifact (median score, 1; P = .17), with good interrater agreement (image quality, noise, and artifact ICC: 0.84, 0.88, and 0.74, respectively). Hounsfield unit values, spatial resolution, and noise-power spectrum were also similar with the exception of mean Hounsfield unit value in the spinal canal, which was lower in the PCD than the EID images because of beam hardening (20 HU vs 36.5 HU; P < .001). Contrast-to-noise ratio of enhanced kidney tissue was improved with PCD iodine mapping compared with EID (5.2 ± 1.3 vs 4.0 ± 1.3; P < .001).

Conclusion: The performance of PCD showed no statistically significant difference compared with EID when the abdomen was evaluated in a conventional scan mode. PCD provides spectral information, which may be used for material decomposition.


Figures

Figure 1:
Figure 1:
Qualitative analysis scores. Near equivalence was noted for the EID and PCD systems for three readers who each evaluated 150 series of images for image quality (P = .19), noise (P = .30), and artifact (P = .17) by using Wilcoxon signed-rank test. Red = artifacts that affect the interpretation of a lesion or an organ of interest, yellow = pronounced artifacts that interfere with diagnosis (but a diagnosis can be made), light green = moderate artifacts that slightly interfere with diagnostic decision making, green = mild artifacts that do not interfere with diagnostic decision making, and dark green = no artifacts.
Figure 2a:
Figure 2a:
Quantitative assessment of the EID and PCD systems with an American College of Radiology (ACR) CT phantom. (a) Graph shows the radial modulation transfer function (MTF) at 10 cm off the isocenter. (b) Graph shows the noise-power spectrum (NPS). (c) Bar graphs show CT number (Hounsfield unit) accuracy in five different calibrated regions of the American College of Radiology CT phantom: bone, polyethylene (PE), acrylic, air, and water.
Figure 2b:
Figure 2b:
Quantitative assessment of the EID and PCD systems with an American College of Radiology (ACR) CT phantom. (a) Graph shows the radial modulation transfer function (MTF) at 10 cm off the isocenter. (b) Graph shows the noise-power spectrum (NPS). (c) Bar graphs show CT number (Hounsfield unit) accuracy in five different calibrated regions of the American College of Radiology CT phantom: bone, polyethylene (PE), acrylic, air, and water.
Figure 2c:
Figure 2c:
Quantitative assessment of the EID and PCD systems with an American College of Radiology (ACR) CT phantom. (a) Graph shows the radial modulation transfer function (MTF) at 10 cm off the isocenter. (b) Graph shows the noise-power spectrum (NPS). (c) Bar graphs show CT number (Hounsfield unit) accuracy in five different calibrated regions of the American College of Radiology CT phantom: bone, polyethylene (PE), acrylic, air, and water.
Figure 3:
Figure 3:
Distribution plots of the mean Hounsfield unit value of the 1-cm2 circular ROIs selected from the 2-minute delayed contrast-enhanced axial EID and PCD images of 10 patients. Seven paired ROIs were selected in each patient: paraspinal muscle, air in bowel lumen, gallbladder, kidney, liver, spinal canal, and subcutaneous fat. * The air Hounsfield unit values are subtracted from −1000 HU for easier visualization. ** P < .001.
Figure 4a:
Figure 4a:
Axial images in a 51-year-old woman. Images acquired with (a) EID and (b) PCD show no significant difference in qualitative image analysis. Multienergy analysis of contrast-enhanced PCD CT images: (c) a virtual noncontrast image, (d) an iodine concentration map, and (e) an iodine map superimposed on the virtual noncontrast image; the blue circles represent the ROI used for contrast-to-noise ratio calculation.
Figure 4b:
Figure 4b:
Axial images in a 51-year-old woman. Images acquired with (a) EID and (b) PCD show no significant difference in qualitative image analysis. Multienergy analysis of contrast-enhanced PCD CT images: (c) a virtual noncontrast image, (d) an iodine concentration map, and (e) an iodine map superimposed on the virtual noncontrast image; the blue circles represent the ROI used for contrast-to-noise ratio calculation.
Figure 4c:
Figure 4c:
Axial images in a 51-year-old woman. Images acquired with (a) EID and (b) PCD show no significant difference in qualitative image analysis. Multienergy analysis of contrast-enhanced PCD CT images: (c) a virtual noncontrast image, (d) an iodine concentration map, and (e) an iodine map superimposed on the virtual noncontrast image; the blue circles represent the ROI used for contrast-to-noise ratio calculation.
Figure 4d:
Figure 4d:
Axial images in a 51-year-old woman. Images acquired with (a) EID and (b) PCD show no significant difference in qualitative image analysis. Multienergy analysis of contrast-enhanced PCD CT images: (c) a virtual noncontrast image, (d) an iodine concentration map, and (e) an iodine map superimposed on the virtual noncontrast image; the blue circles represent the ROI used for contrast-to-noise ratio calculation.
Figure 4e:
Figure 4e:
Axial images in a 51-year-old woman. Images acquired with (a) EID and (b) PCD show no significant difference in qualitative image analysis. Multienergy analysis of contrast-enhanced PCD CT images: (c) a virtual noncontrast image, (d) an iodine concentration map, and (e) an iodine map superimposed on the virtual noncontrast image; the blue circles represent the ROI used for contrast-to-noise ratio calculation.

References

    1. Taguchi K, Iwanczyk JS. Vision 20/20: Single photon counting x-ray detectors in medical imaging. Med Phys 2013;40(10):100901. - PMC - PubMed
    1. Ding H, Klopfer MJ, Ducote JL, Masaki F, Molloi S. Breast tissue characterization with photon-counting spectral CT imaging: a postmortem breast study. Radiology 2014;272(3):731–738. - PMC - PubMed
    1. Iwanczyk JS, Nygård E, Meirav O, et al. . Photon counting energy dispersive detector arrays for x-ray imaging. IEEE Trans Nucl Sci 2009;56(3):535–542. - PMC - PubMed
    1. Feuerlein S, Roessl E, Proksa R, et al. . Multienergy photon-counting K-edge imaging: potential for improved luminal depiction in vascular imaging. Radiology 2008;249(3):1010–1016. - PubMed
    1. Kappler S, Henning A, Kreisler B, Schoeck F, Stierstorfer K, Flohr T. Photon counting CT at elevated X-ray tube currents: contrast stability, image noise and multi-energy performance. In: Whiting BR, Hoeschen C, eds. Proceedings of SPIE: medical imaging 2014—physics of medical imaging. Vol 9033. Bellingham, Wash: International Society for Optics and Photonics, 2014; 90331C.

Publication types