

Phase Analysis of Metabolic Oscillations and Membrane Potential in Pancreatic Islet β-Cells
- PMID: 26840733
- PMCID: PMC4744170
- DOI: 10.1016/j.bpj.2015.12.029
Phase Analysis of Metabolic Oscillations and Membrane Potential in Pancreatic Islet β-Cells
Abstract
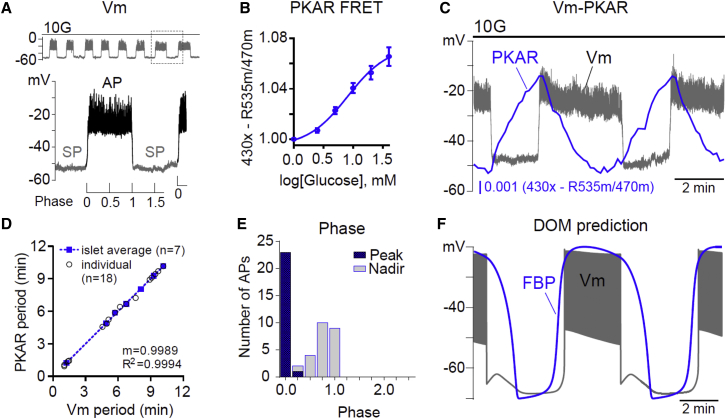
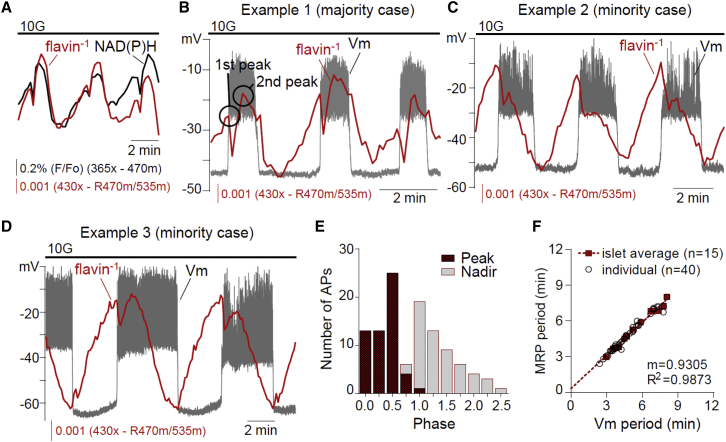
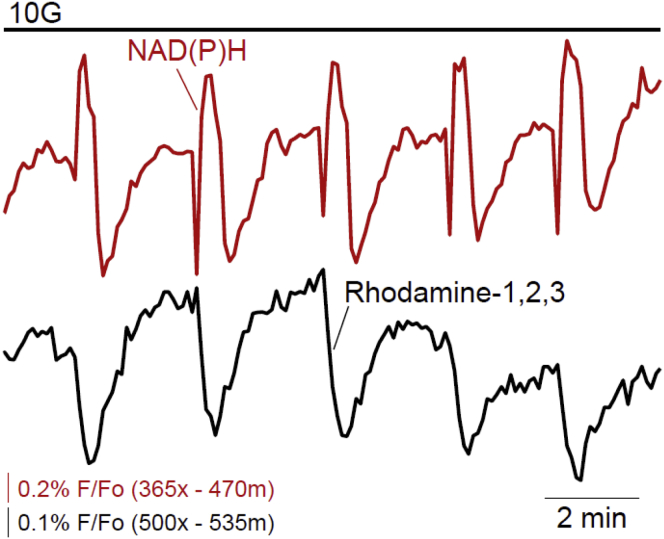
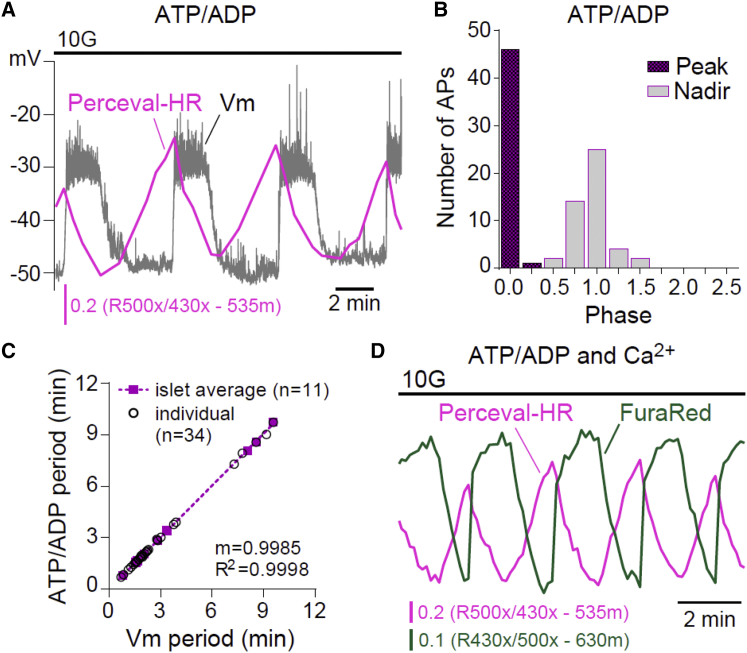
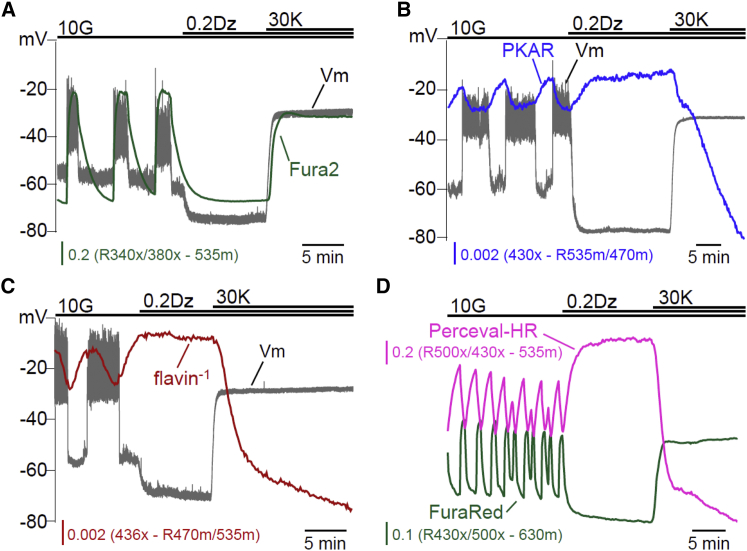
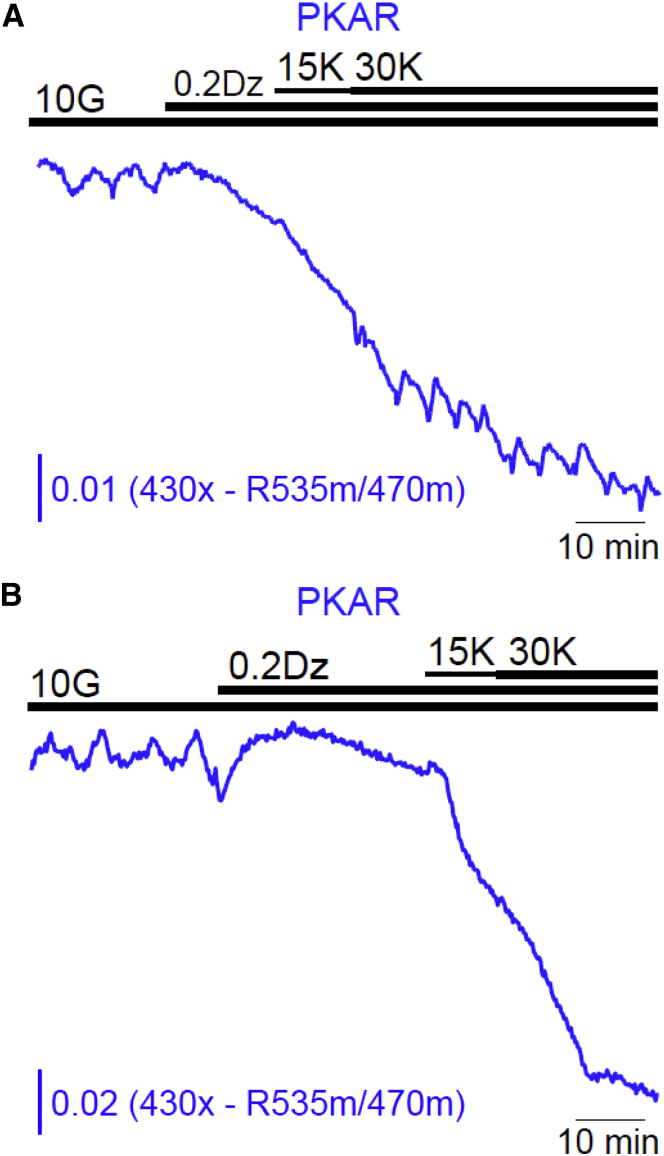
Metabolism in islet β-cells displays oscillations that can trigger pulses of electrical activity and insulin secretion. There has been a decades-long debate among islet biologists about whether metabolic oscillations are intrinsic or occur in response to oscillations in intracellular Ca(2+) that result from bursting electrical activity. In this article, the dynamics of oscillatory metabolism were investigated using five different optical reporters. Reporter activity was measured simultaneously with membrane potential bursting to determine the phase relationships between the metabolic oscillations and electrical activity. Our experimental findings suggest that Ca(2+) entry into β-cells stimulates the rate of mitochondrial metabolism, accounting for the depletion of glycolytic intermediates during each oscillatory burst. We also performed Ca(2+) clamp tests in which we clamped membrane potential with the KATP channel-opener diazoxide and KCl to fix Ca(2+) at an elevated level. These tests confirm that metabolic oscillations do not require Ca(2+) oscillations, but show that Ca(2+) plays a larger role in shaping metabolic oscillations than previously suspected. A dynamical picture of the mechanisms of oscillations emerged that requires the restructuring of contemporary mathematical β-cell models, including our own dual oscillator model. In the companion article, we modified our model to account for these new data.
Copyright © 2016 Biophysical Society. Published by Elsevier Inc. All rights reserved.
Figures
Similar articles
-
Slow oscillations of KATP conductance in mouse pancreatic islets provide support for electrical bursting driven by metabolic oscillations.Am J Physiol Endocrinol Metab. 2013 Oct 1;305(7):E805-17. doi: 10.1152/ajpendo.00046.2013. Epub 2013 Aug 6. Am J Physiol Endocrinol Metab. 2013. PMID: 23921138 Free PMC article.
-
Ca2+ Effects on ATP Production and Consumption Have Regulatory Roles on Oscillatory Islet Activity.Biophys J. 2016 Feb 2;110(3):733-742. doi: 10.1016/j.bpj.2015.11.3526. Biophys J. 2016. PMID: 26840737 Free PMC article.
-
Transitions between bursting modes in the integrated oscillator model for pancreatic β-cells.J Theor Biol. 2018 Oct 7;454:310-319. doi: 10.1016/j.jtbi.2018.06.017. Epub 2018 Jun 20. J Theor Biol. 2018. PMID: 29935201
-
Metabolic and electrical oscillations: partners in controlling pulsatile insulin secretion.Am J Physiol Endocrinol Metab. 2007 Oct;293(4):E890-900. doi: 10.1152/ajpendo.00359.2007. Epub 2007 Jul 31. Am J Physiol Endocrinol Metab. 2007. PMID: 17666486 Review.
-
Bursting and calcium oscillations in pancreatic beta-cells: specific pacemakers for specific mechanisms.Am J Physiol Endocrinol Metab. 2010 Oct;299(4):E517-32. doi: 10.1152/ajpendo.00177.2010. Epub 2010 Jul 13. Am J Physiol Endocrinol Metab. 2010. PMID: 20628025 Free PMC article. Review.
Cited by
-
The role of GABA in islet function.Front Endocrinol (Lausanne). 2022 Sep 29;13:972115. doi: 10.3389/fendo.2022.972115. eCollection 2022. Front Endocrinol (Lausanne). 2022. PMID: 36246925 Free PMC article. Review.
-
Synchronization of pancreatic islets by periodic or non-periodic muscarinic agonist pulse trains.PLoS One. 2019 Feb 6;14(2):e0211832. doi: 10.1371/journal.pone.0211832. eCollection 2019. PLoS One. 2019. PMID: 30726280 Free PMC article.
-
Amino acid sensing by the α-cell mitochondrial phosphoenolpyruvate cycle regulates intracellular Ca2+ levels without impacting glucagon secretion.bioRxiv [Preprint]. 2025 May 28:2025.05.26.656009. doi: 10.1101/2025.05.26.656009. bioRxiv. 2025. PMID: 40501998 Free PMC article. Preprint.
-
KATP channel activity and slow oscillations in pancreatic beta cells are regulated by mitochondrial ATP production.J Physiol. 2023 Dec;601(24):5655-5667. doi: 10.1113/JP284982. Epub 2023 Nov 20. J Physiol. 2023. PMID: 37983196 Free PMC article.
-
Pulsatile Basal Insulin Secretion Is Driven by Glycolytic Oscillations.Physiology (Bethesda). 2022 Jul 1;37(4):0. doi: 10.1152/physiol.00044.2021. Epub 2022 Apr 4. Physiology (Bethesda). 2022. PMID: 35378996 Free PMC article. Review.
References
-
- Lang D.A., Matthews D.R., Turner R.C. Cyclic oscillations of basal plasma glucose and insulin concentrations in human beings. N. Engl. J. Med. 1979;301:1023–1027. - PubMed
-
- Pørksen N. The in vivo regulation of pulsatile insulin secretion. Diabetologia. 2002;45:3–20. - PubMed
-
- Meier J.J., Veldhuis J.D., Butler P.C. Pulsatile insulin secretion dictates systemic insulin delivery by regulating hepatic insulin extraction in humans. Diabetes. 2005;54:1649–1656. - PubMed
Publication types
MeSH terms
Substances
Grants and funding
LinkOut - more resources
Full Text Sources
Other Literature Sources
Research Materials
Miscellaneous
