

Cell Fate Specification Based on Tristability in the Inner Cell Mass of Mouse Blastocysts
- PMID: 26840735
- PMCID: PMC4744165
- DOI: 10.1016/j.bpj.2015.12.020
Cell Fate Specification Based on Tristability in the Inner Cell Mass of Mouse Blastocysts
Abstract
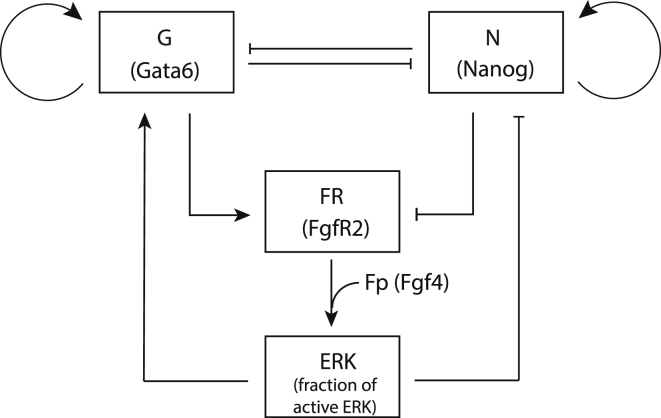
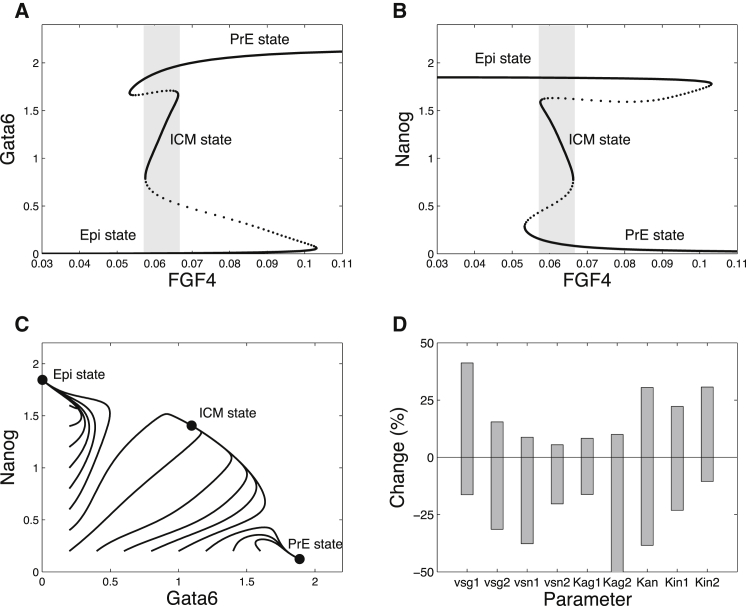
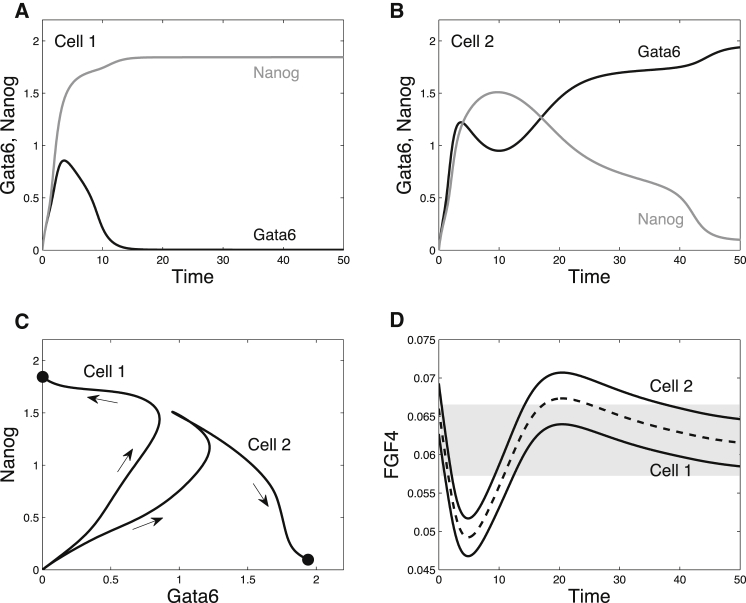
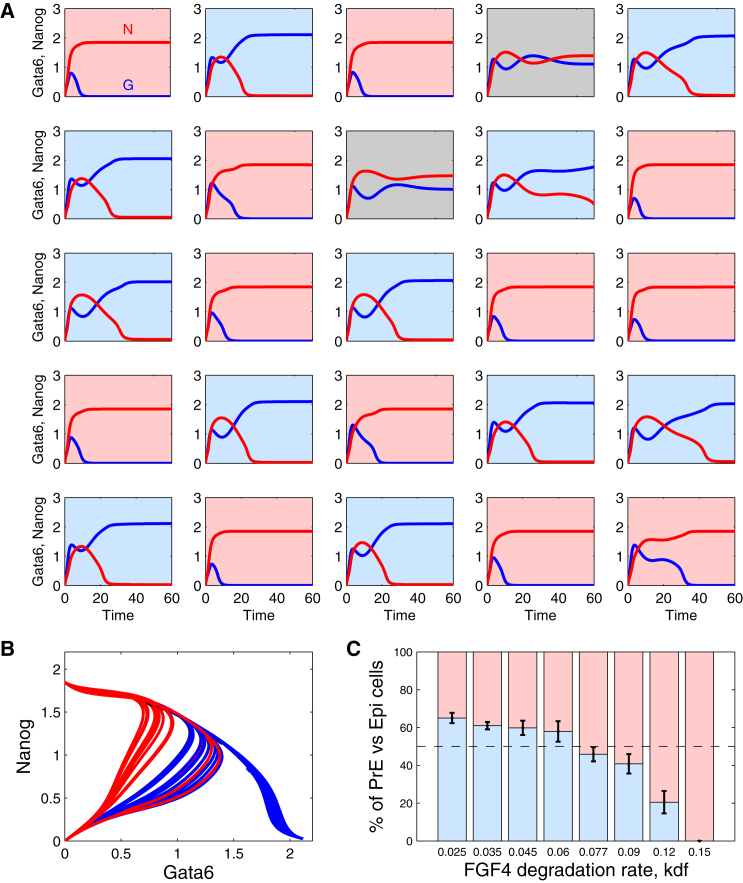
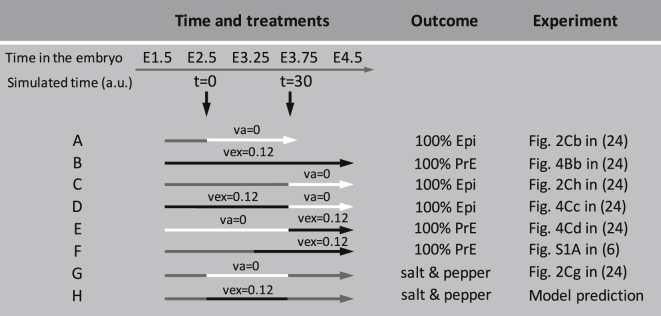
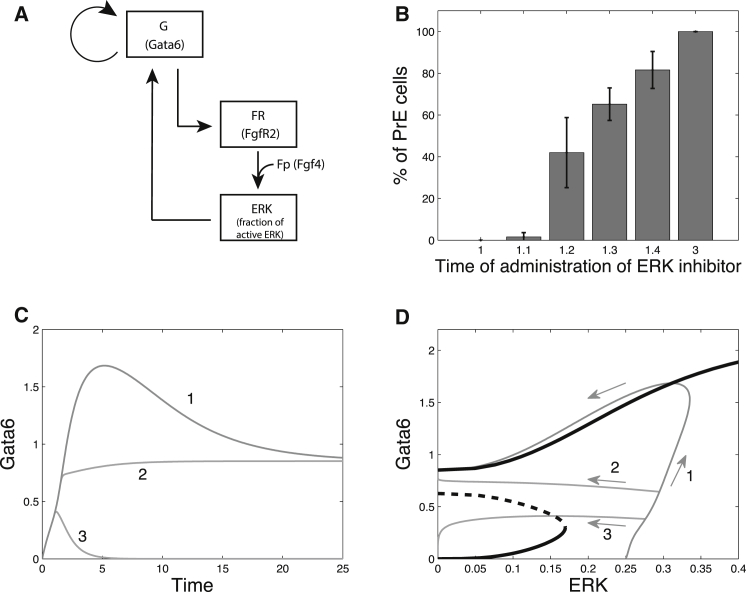
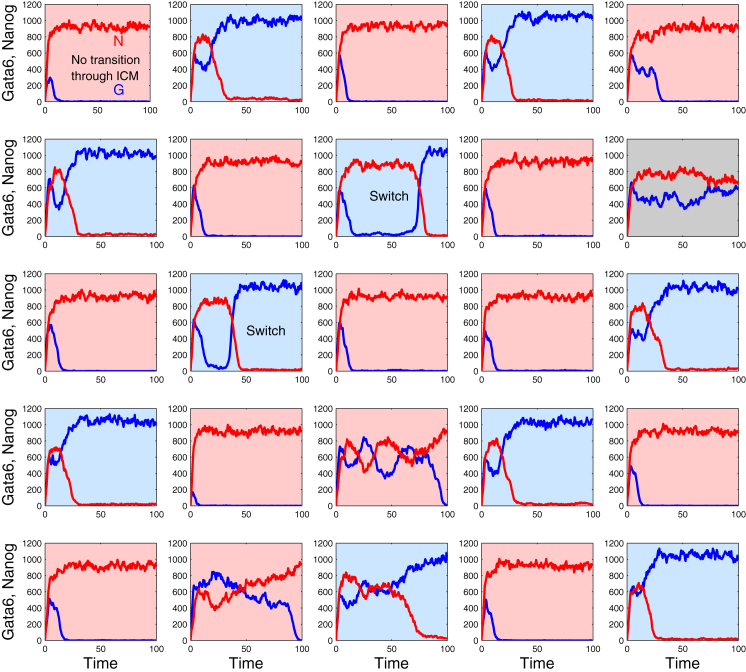
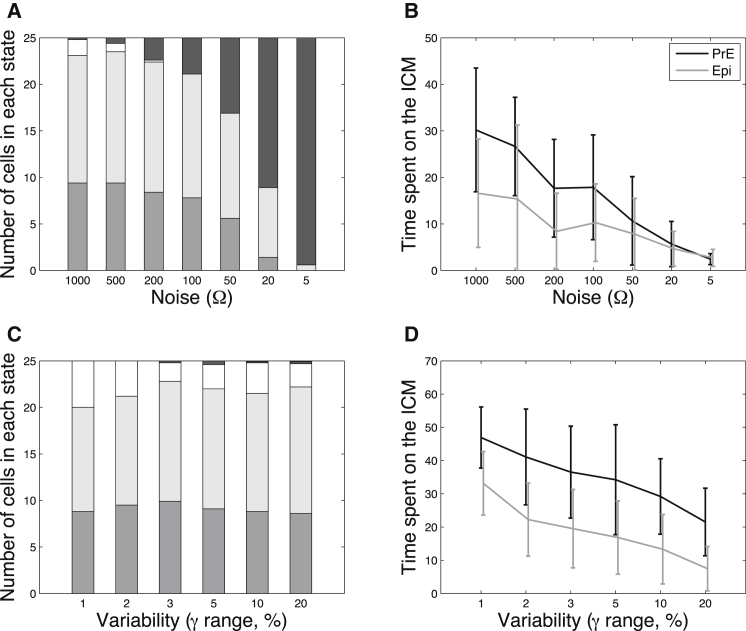
During development, interactions between transcription factors control the specification of different cell fates. The regulatory networks of genetic interactions often exhibit multiple stable steady states; such multistability provides a common dynamical basis for differentiation. During early murine embryogenesis, cells from the inner cell mass (ICM) can be specified in epiblast (Epi) or primitive endoderm (PrE). Besides the intracellular gene regulatory network, specification is also controlled by intercellular interactions involving Erk signaling through extracellular Fgf4. We previously proposed a model that describes the gene regulatory network and its interaction with Erk signaling in ICM cells. The model displays tristability in a range of Fgf4 concentrations and accounts for the self-organized specification process observed in vivo. Here, we further investigate the origin of tristability in the model and analyze in more detail the specification process by resorting to a simplified two-cell model. We also carry out simulations of a population of 25 cells under various experimental conditions to compare their outcome with that of mutant embryos or of embryos submitted to exogenous treatments that interfere with Fgf signaling. The results are analyzed by means of bifurcation diagrams. Finally, the model predicts that heterogeneities in extracellular Fgf4 concentration play a primary role in the spatial arrangement of the Epi/PrE cells in a salt-and-pepper pattern. If, instead of heterogeneities in extracellular Fgf4 concentration, internal fluctuations in the levels of expression of the transcription factors are considered as a source of randomness, simulations predict the occurrence of unrealistic switches between the Epi and the PrE cell fates, as well as the evolution of some cells toward one of these states without passing through the previous ICM state, in contrast to what is observed in vivo.
Copyright © 2016 Biophysical Society. Published by Elsevier Inc. All rights reserved.
Figures
Similar articles
-
Gata6, Nanog and Erk signaling control cell fate in the inner cell mass through a tristable regulatory network.Development. 2014 Oct;141(19):3637-48. doi: 10.1242/dev.109678. Epub 2014 Sep 10. Development. 2014. PMID: 25209243
-
FGF4 is required for lineage restriction and salt-and-pepper distribution of primitive endoderm factors but not their initial expression in the mouse.Development. 2013 Jan 15;140(2):267-79. doi: 10.1242/dev.084996. Epub 2012 Nov 28. Development. 2013. PMID: 23193166 Free PMC article.
-
FGF4 is a limiting factor controlling the proportions of primitive endoderm and epiblast in the ICM of the mouse blastocyst.Dev Biol. 2013 Dec 1;384(1):65-71. doi: 10.1016/j.ydbio.2013.09.023. Epub 2013 Sep 21. Dev Biol. 2013. PMID: 24063807
-
[Epiblast and primitive endoderm cell specification during mouse preimplantation development: a combination between biology and mathematical modeling].Med Sci (Paris). 2016 Feb;32(2):192-7. doi: 10.1051/medsci/20163202013. Epub 2016 Mar 2. Med Sci (Paris). 2016. PMID: 26936177 Review. French.
-
Primitive Endoderm Differentiation: From Specification to Epithelialization.Curr Top Dev Biol. 2018;128:81-104. doi: 10.1016/bs.ctdb.2017.12.001. Epub 2018 Feb 2. Curr Top Dev Biol. 2018. PMID: 29477172 Review.
Cited by
-
Geometry of gene regulatory dynamics.Proc Natl Acad Sci U S A. 2021 Sep 21;118(38):e2109729118. doi: 10.1073/pnas.2109729118. Proc Natl Acad Sci U S A. 2021. PMID: 34518231 Free PMC article.
-
NANOG initiates epiblast fate through the coordination of pluripotency genes expression.Nat Commun. 2022 Jun 21;13(1):3550. doi: 10.1038/s41467-022-30858-8. Nat Commun. 2022. PMID: 35729116 Free PMC article.
-
A dynamical model of growth and maturation in Drosophila.Proc Natl Acad Sci U S A. 2023 Dec 5;120(49):e2313224120. doi: 10.1073/pnas.2313224120. Epub 2023 Nov 28. Proc Natl Acad Sci U S A. 2023. PMID: 38015844 Free PMC article.
-
Cell-cell communication through FGF4 generates and maintains robust proportions of differentiated cell types in embryonic stem cells.Development. 2021 Nov 1;148(21):dev199926. doi: 10.1242/dev.199926. Epub 2021 Nov 5. Development. 2021. PMID: 34651174 Free PMC article.
-
Making lineage decisions with biological noise: Lessons from the early mouse embryo.Wiley Interdiscip Rev Dev Biol. 2018 Jul;7(4):e319. doi: 10.1002/wdev.319. Epub 2018 Apr 30. Wiley Interdiscip Rev Dev Biol. 2018. PMID: 29709110 Free PMC article. Review.
References
-
- Mitsui K., Tokuzawa Y., Yamanaka S. The homeoprotein Nanog is required for maintenance of pluripotency in mouse epiblast and ES cells. Cell. 2003;113:631–642. - PubMed
-
- Messerschmidt D.M., Kemler R. Nanog is required for primitive endoderm formation through a non-cell autonomous mechanism. Dev. Biol. 2010;344:129–137. - PubMed
-
- Frankenberg S., Gerbe F., Chazaud C. Primitive endoderm differentiates via a three-step mechanism involving Nanog and RTK signaling. Dev. Cell. 2011;21:1005–1013. - PubMed
Publication types
MeSH terms
Substances
LinkOut - more resources
Full Text Sources
Other Literature Sources
Miscellaneous
