. 2016 Feb 26;79(2):376-86.
doi: 10.1021/acs.jnatprod.5b01014. Epub 2016 Feb 3.

Biochemometrics for Natural Products Research: Comparison of Data Analysis Approaches and Application to Identification of Bioactive Compounds

Affiliations

Biochemometrics for Natural Products Research: Comparison of Data Analysis Approaches and Application to Identification of Bioactive Compounds

Joshua J Kellogg et al. J Nat Prod. .

Abstract

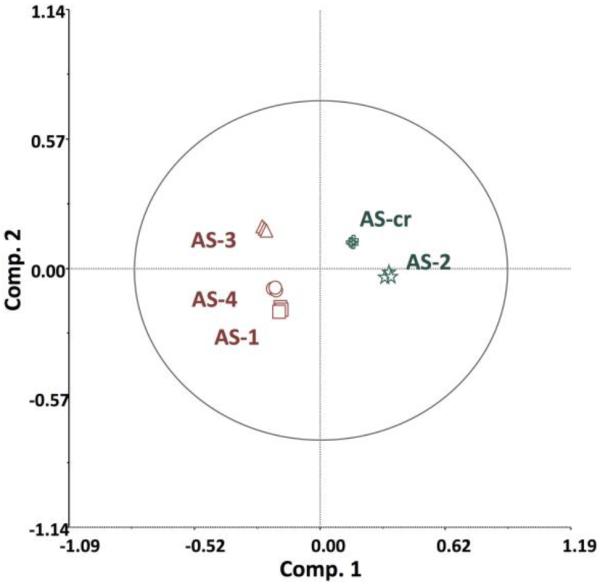
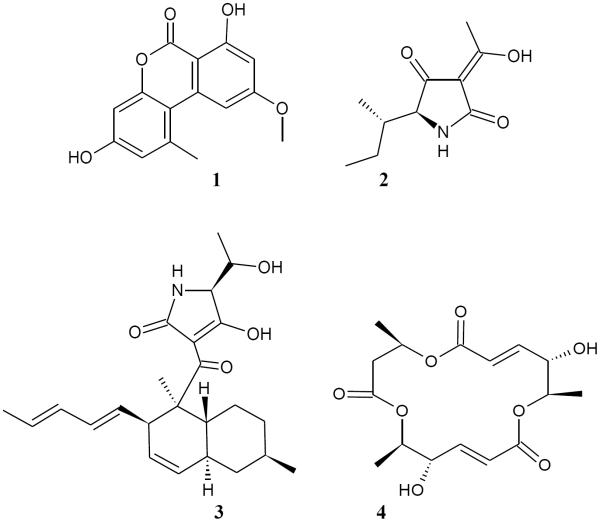
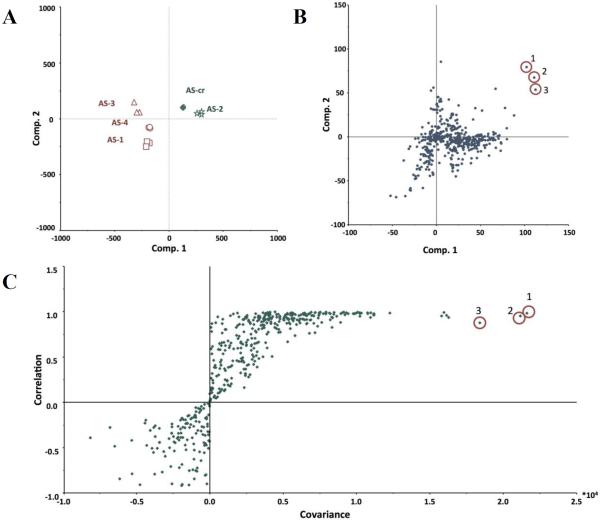
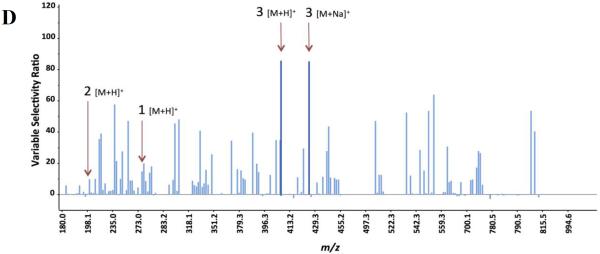
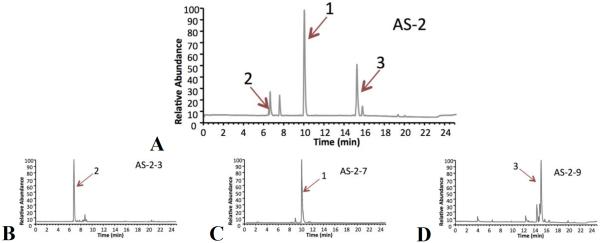
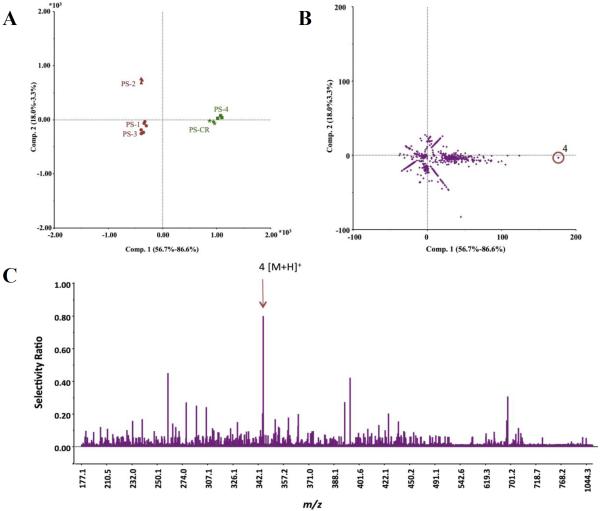
A central challenge of natural products research is assigning bioactive compounds from complex mixtures. The gold standard approach to address this challenge, bioassay-guided fractionation, is often biased toward abundant, rather than bioactive, mixture components. This study evaluated the combination of bioassay-guided fractionation with untargeted metabolite profiling to improve active component identification early in the fractionation process. Key to this methodology was statistical modeling of the integrated biological and chemical data sets (biochemometric analysis). Three data analysis approaches for biochemometric analysis were compared, namely, partial least-squares loading vectors, S-plots, and the selectivity ratio. Extracts from the endophytic fungi Alternaria sp. and Pyrenochaeta sp. with antimicrobial activity against Staphylococcus aureus served as test cases. Biochemometric analysis incorporating the selectivity ratio performed best in identifying bioactive ions from these extracts early in the fractionation process, yielding altersetin (3, MIC 0.23 μg/mL) and macrosphelide A (4, MIC 75 μg/mL) as antibacterial constituents from Alternaria sp. and Pyrenochaeta sp., respectively. This study demonstrates the potential of biochemometrics coupled with bioassay-guided fractionation to identify bioactive mixture components. A benefit of this approach is the ability to integrate multiple stages of fractionation and bioassay data into a single analysis.


Figures

Figure 1
Figure 1
Principal Component Analysis (PCA) scores plot of Alternaria sp. crude extract (AS-CR) and fractions AS1 – AS4, drawn with Hotelling's 95% confidence ellipse. All fractions were run in triplicate, and the resulting 472 marker ions were used to compute differences in mycochemical composition.
Figure 2
Figure 2
Marker ion selection from a biochemometric dataset. The biochemometric dataset was obtained from the mass spectral data coupled with bacterial growth inhibition data (against S. aureus SA1199) at a concentration of 100 μg/mL (Table 2). (A) Partial least squares (PLS) scores plot, showing the grouping of bioactive and non-bioactive fractions from Alternaria sp. (AS-CR and AS-1 – AS-4). Each fraction was analyzed in triplicate via UPLC-MS and was subjected to triplicate biological assays. Thus, the replicate datapoints represent both biological and technical variability. (B) Loadings plot from the PLS analysis of biochemometric data. Variables located in the same region in the loadings plot (B) as the bioactive groups AS-CR and AS-2 in the scores plot (A) have the highest positive correlation with the dependent variable (bioactivity). Thus, three ions corresponding to alternariol monomethyl ether (1), tenuazonic acid (2), and altersetin (3) were identified from visual analysis of the loadings plot as potentially most bioactive. (C) S-plot from PLS model of antibacterial activity of Alternaria sp. extract and fractions. The upper right quadrant are the peaks with highest correlation to bioactivity, and ions 1, 2, and 3 were also identified from the S-plot. (D) The selectivity ratio analysis of the PLS model data. The ratio relates the explained variance of the variable to the residual variance. Higher values (taller lines) represent a more significant contribution to the observed bioactivity. The selectivity ratio indicates compound 3 to have the highest activity, and does not find strong correlation for compounds 1 and 2.
Figure 2
Figure 2
Marker ion selection from a biochemometric dataset. The biochemometric dataset was obtained from the mass spectral data coupled with bacterial growth inhibition data (against S. aureus SA1199) at a concentration of 100 μg/mL (Table 2). (A) Partial least squares (PLS) scores plot, showing the grouping of bioactive and non-bioactive fractions from Alternaria sp. (AS-CR and AS-1 – AS-4). Each fraction was analyzed in triplicate via UPLC-MS and was subjected to triplicate biological assays. Thus, the replicate datapoints represent both biological and technical variability. (B) Loadings plot from the PLS analysis of biochemometric data. Variables located in the same region in the loadings plot (B) as the bioactive groups AS-CR and AS-2 in the scores plot (A) have the highest positive correlation with the dependent variable (bioactivity). Thus, three ions corresponding to alternariol monomethyl ether (1), tenuazonic acid (2), and altersetin (3) were identified from visual analysis of the loadings plot as potentially most bioactive. (C) S-plot from PLS model of antibacterial activity of Alternaria sp. extract and fractions. The upper right quadrant are the peaks with highest correlation to bioactivity, and ions 1, 2, and 3 were also identified from the S-plot. (D) The selectivity ratio analysis of the PLS model data. The ratio relates the explained variance of the variable to the residual variance. Higher values (taller lines) represent a more significant contribution to the observed bioactivity. The selectivity ratio indicates compound 3 to have the highest activity, and does not find strong correlation for compounds 1 and 2.
Figure 3
Figure 3
UPLS-HRMS chromatograms of fraction AS-2 (A), along with selected subfractions AS-2-3 (B), AS-2-7 (C), and AS-2-9 (D) representing the semi-pure fractions of tenuazonic acid (2), alternariol monomethyl ether (1), and altersetin (3), respectively.
Figure 4
Figure 4
Marker ion selection from the post-fractionation biochemometric dataset of Alternaria sp. The biochemometric dataset was obtained from the triplicate mass spectral data coupled with bacterial growth inhibition data (against S. aureus SA1199) at a concentration of 100 μg/mL. (A) Partial least squares (PLS) scores plot, showing the grouping of bioactive and inactive fractions from Alternaria sp. (AS-CR, AS-1 – AS-4, and AS-2-1 – AS-2-10). Each fraction was analyzed in triplicate, as shown in the scores plot. (B) Loadings plot from the PLS analysis of biochemometric data. Variable 3 was the most correlated to bioactivity, as implied by being shifted in the same direction as the bioactive samples in the scores plot. (C) S-plot from the larger PLS model of antibacterial activity of Alternaria sp. extract, fractions, and subfractions. The marker ion for 3 is distinctly separate from the others, indicating its greater contribution to the bioactivity (D) The selectivity ratio analysis of the more comprehensive PLS model data. Similar to the initial selectivity ratio analysis (Figure 2D), ion 3 displays the highest selectivity ratio.
Figure 5
Figure 5
Identification of the bioactive principle from Pyrenochaeta sp. from the biochemometric dataset. The biochemometric dataset was obtained from the triplicate mass spectral data coupled with growth inhibition data against S. aureus (SA1199) at a concentration of 100 μg/mL. (A) The partial least squares (PLS) scores plot shows the grouping of bioactive and inactive fractions from Pyrenochaeta sp. (PS-CR, PS-1 – PS-4). Each fraction was analyzed in triplicate, as shown in the scores plot. (B) Loadings plot from the PLS analysis of biochemometric data. The ion for macrosphelide A (4) was the most correlated with the bioactive samples in the scores plot. (C) The selectivity ratio analysis of the PLS model data.

References

    1. Kinghorn AD, Fong HHS, Farnsworth NR, Mehta RG, Moon RC, Moriarty RM, Pezzuto JM. Curr. Org. Chem. 1998;2:597–612.
    1. Wall ME, Wani MC. J. Ethnopharm. 1996;51:239–253. - PubMed
    1. Oberlies NH, Kroll DJ. J. Nat. Prod. 2004;67:129–135. - PubMed
    1. Tu Y. Nat. Med. 2011;17:1217–1220. - PubMed
    1. Noble RL. Biochem. Cell Biol. 1990;68:1344–1351. - PubMed

Publication types

MeSH terms