Implicit expectations influence target detection in children and adults
- PMID: 26841104
- PMCID: PMC10614135
- DOI: 10.1111/desc.12402
Implicit expectations influence target detection in children and adults
Abstract
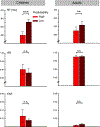
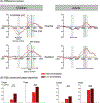
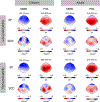
When a sound occurs at a predictable time, it gets processed more efficiently. Predictability of the temporal structure of acoustic inflow has been found to influence the P3b of event-related potentials in young adults, such that highly predictable compared to less predictable input leads to earlier P3b peak latencies. In our study, we wanted to investigate the influence of predictability on target processing indexed by the P3b in children (10-12 years old) and young adults. To do that, we used an oddball paradigm with two conditions of predictability (high and low). In the High-predictability condition, a high-pitched target tone occurred most of the time in the fifth position of a five-tone pattern (after four low-pitched non-target sounds), whereas in the Low-predictability condition, no such rule was implemented. The target tone occurred randomly following 2, 3, 4, 5, or 6 non-target tones. In both age groups, reaction time to predictable targets was faster than to non-predictable targets. Remarkably, this effect was largest in children. Consistent with the behavioral responses, the onset latency of the P3b response elicited by targets in both groups was earlier in the predictable than the unpredictable conditions. However, only the children had significantly earlier peak latency responses for predictable targets. Our results demonstrate that target stimulus predictability increases processing speed in children and adults even when predictability was only implicitly derived by the stimulus statistics. Children did have larger effects of predictability, seeming to benefit more from predictability for target detection.
© 2016 John Wiley & Sons Ltd.
Figures


Similar articles
-
Linguistic predictability influences auditory stimulus classification within two concurrent speech streams.Psychophysiology. 2020 May;57(5):e13547. doi: 10.1111/psyp.13547. Epub 2020 Feb 12. Psychophysiology. 2020. PMID: 32052468
-
P3b reflects periodicity in linguistic sequences.PLoS One. 2012;7(12):e51419. doi: 10.1371/journal.pone.0051419. Epub 2012 Dec 10. PLoS One. 2012. PMID: 23251527 Free PMC article.
-
Event-related potentials to acoustic startle probes during the anticipation of predictable and unpredictable threat.Psychophysiology. 2015 Jul;52(7):887-94. doi: 10.1111/psyp.12418. Epub 2015 Feb 22. Psychophysiology. 2015. PMID: 25703182
-
Implicit variations of temporal predictability: Shaping the neural oscillatory and behavioural response.Neuropsychologia. 2017 Jul 1;101:141-152. doi: 10.1016/j.neuropsychologia.2017.05.019. Epub 2017 May 17. Neuropsychologia. 2017. PMID: 28527912
-
The modulation of auditory novelty processing by working memory load in school age children and adults: a combined behavioral and event-related potential study.BMC Neurosci. 2010 Oct 7;11:126. doi: 10.1186/1471-2202-11-126. BMC Neurosci. 2010. PMID: 20929535 Free PMC article.
Cited by
-
Estimating the Timing of Cognitive Operations With MEG/EEG Latency Measures: A Primer, a Brief Tutorial, and an Implementation of Various Methods.Front Neurosci. 2018 Oct 25;12:765. doi: 10.3389/fnins.2018.00765. eCollection 2018. Front Neurosci. 2018. PMID: 30410431 Free PMC article.
-
A Model for Statistical Regularity Extraction from Dynamic Sounds.Acta Acust United Acust. 2019 Jan-Feb;105(1):1-4. doi: 10.3813/AAA.919279. Epub 2018 Dec 7. Acta Acust United Acust. 2019. PMID: 31929768 Free PMC article.
-
Differential Effects of Salient Visual Events on Memory-Guided Attention in Adults and Children.Child Dev. 2019 Jul;90(4):1369-1388. doi: 10.1111/cdev.13149. Epub 2018 Oct 8. Child Dev. 2019. PMID: 30295321 Free PMC article.
References
-
- Bakeman R (2005). Recommended effect size statistics for repeated measures designs. Behavior Research Methods, 37 (3), 379–384. - PubMed
-
- Benjamini Y, & Hochberg Y (1995). Controlling the false discovery rate: a practical and powerful approach to multiple testing. Journal of the Royal Statistical Society. Series B (Methodological), 57 (1), 289–300.
-
- Chatrian GE, Lettich E, & Nelson PL (1988). Modified nomenclature for the ‘10%’ electrode system. Journal of Clinical Neurophysiology, 5 (2), 183–186. - PubMed
-
- Courchesne E (1978). Neurophysiological correlates of cognitive development: changes in long-latency event-related potentials from childhood to adulthood. Electroencephalography and Clinical Neurophysiology, 45 (4), 468–482. - PubMed
Publication types
MeSH terms
Grants and funding
LinkOut - more resources
Full Text Sources
Other Literature Sources

