Expression Profile of Long Noncoding RNAs in Peripheral Blood Mononuclear Cells from Multiple Sclerosis Patients
- PMID: 26842313
- PMCID: PMC5067595
- DOI: 10.1111/cns.12498
Expression Profile of Long Noncoding RNAs in Peripheral Blood Mononuclear Cells from Multiple Sclerosis Patients
Abstract
Aims: Long noncoding RNAs (lncRNAs) play a key role in regulating immunological functions. Their impact on the chronic inflammatory disease multiple sclerosis (MS), however, remains unknown. We investigated the expression of lncRNAs in peripheral blood mononuclear cells (PBMCs) of patients with MS and attempt to explain their possible role in the process of MS.
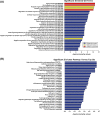
Methods: For this study, we recruited 26 patients with MS according to the revised McDonald criteria. Then, we randomly chose 6 patients for microarray analysis. Microarray assays identified outstanding differences in lncRNA expression, which were verified through real-time PCR. LncRNA functions were annotated for target genes using Gene Ontology (GO) and Kyoto Encyclopedia of Genes and Genomes (KEGG) analyses, and regulatory relationships between lncRNAs and target genes were analyzed using the "cis" and "trans" model.
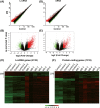
Results: There were 2353 upregulated lncRNAs, 389 downregulated lncRNAs, 1037 upregulated mRNAs, and 279 downregulated mRNAs in patients with MS compared to healthy control subjects (fold change >2.0). Real-time PCR results of six aberrant lncRNAs were consistent with the microarray data. The coexpression network comprised 864 lncRNAs and 628 mRNAs. Among differentially expressed lncRNAs, 10 lncRNAs were predicted to have 10 cis-regulated target genes, and 33 lncRNAs might regulate their trans target genes.
Conclusions: We identified a subset of dysregulated lncRNAs and mRNAs. The differentially expressed lncRNAs may be important in the process of MS. However, the specific molecular mechanisms and biological functions of these lncRNAs in the pathogenesis of MS need further study.
Keywords: Long noncoding RNAs; Microarray; Multiple sclerosis.
© 2016 The Authors. CNS Neuroscience & Therapeutics published by John Wiley & Sons Ltd.
Conflict of interest statement
The authors declare no conflict of interest.
Figures


Similar articles
-
Systems biology of myasthenia gravis, integration of aberrant lncRNA and mRNA expression changes.BMC Med Genomics. 2015 Mar 18;8:13. doi: 10.1186/s12920-015-0087-z. BMC Med Genomics. 2015. PMID: 25889429 Free PMC article.
-
Expression profile of long noncoding RNAs in cartilage from knee osteoarthritis patients.Osteoarthritis Cartilage. 2015 Mar;23(3):423-32. doi: 10.1016/j.joca.2014.12.001. Epub 2014 Dec 15. Osteoarthritis Cartilage. 2015. PMID: 25524778
-
Profile and validation of dysregulated long non‑coding RNAs and mRNAs in ovarian cancer.Oncol Rep. 2018 Nov;40(5):2964-2976. doi: 10.3892/or.2018.6654. Epub 2018 Aug 17. Oncol Rep. 2018. PMID: 30132558
-
Role of long non-coding RNAs (LncRNAs) in multiple sclerosis: a brief review.Neurol Sci. 2020 Sep;41(9):2443-2451. doi: 10.1007/s10072-020-04425-2. Epub 2020 Apr 30. Neurol Sci. 2020. PMID: 32350675 Review.
-
Linking Long Noncoding RNA Localization and Function.Trends Biochem Sci. 2016 Sep;41(9):761-772. doi: 10.1016/j.tibs.2016.07.003. Epub 2016 Aug 4. Trends Biochem Sci. 2016. PMID: 27499234 Review.
Cited by
-
Downregulation of lncRNA XR_429159.1 Linked to Brain Metastasis in Patients With Limited-Stage Small-Cell Lung Cancer.Front Oncol. 2021 May 17;11:603271. doi: 10.3389/fonc.2021.603271. eCollection 2021. Front Oncol. 2021. PMID: 34079751 Free PMC article.
-
Comprehensive analysis of long non‑coding RNA‑messenger RNA‑microRNA co‑expression network identifies cell cycle‑related lncRNA in hepatocellular carcinoma.Int J Mol Med. 2019 Nov;44(5):1844-1854. doi: 10.3892/ijmm.2019.4323. Epub 2019 Aug 23. Int J Mol Med. 2019. PMID: 31485608 Free PMC article.
-
Regulatory role of long non coding RNAs (lncRNAs) in neurological disorders: From novel biomarkers to promising therapeutic strategies.Asian J Pharm Sci. 2021 Sep;16(5):533-550. doi: 10.1016/j.ajps.2021.02.006. Epub 2021 Apr 2. Asian J Pharm Sci. 2021. PMID: 34849161 Free PMC article. Review.
-
Evaluation of The Expression Levels of Three Long Non-Coding RNAs in Multiple Sclerosis.Cell J. 2020 Jul;22(2):165-170. doi: 10.22074/cellj.2020.6555. Epub 2019 Oct 14. Cell J. 2020. PMID: 31721530 Free PMC article.
-
Biological functions and affected signaling pathways by Long Non-Coding RNAs in the immune system.Noncoding RNA Res. 2024 Sep 6;10:70-90. doi: 10.1016/j.ncrna.2024.09.001. eCollection 2025 Feb. Noncoding RNA Res. 2024. PMID: 39315339 Free PMC article. Review.
References
-
- McFarland HF, Martin R. Multiple sclerosis: A complicated picture of autoimmunity. Nat Immunol 2007;8:913–919. - PubMed
-
- Sawcer S, Franklin RJ, Ban M. Multiple sclerosis genetics. Lancet Neurol 2014;13:700–709. - PubMed
-
- Ascherio A, Munger KL. Environmental risk factors for multiple sclerosis. Part I: The role of infection. Ann Neurol 2007;61:288–299. - PubMed
-
- Ascherio A, Munger KL. Environmental risk factors for multiple sclerosis. Part II: noninfectious factors. Ann Neurol 2007;61:504–513. - PubMed
-
- Calabrese R, Valentini E, Ciccarone F, et al. TET2 gene expression and 5‐hydroxymethylcytosine level in multiple sclerosis peripheral blood cells. Biochim Biophys Acta 2014;1842:1130–1136. - PubMed
Publication types
MeSH terms
Substances
LinkOut - more resources
Full Text Sources
Other Literature Sources

