gD-Independent Superinfection Exclusion of Alphaherpesviruses
- PMID: 26842480
- PMCID: PMC4810564
- DOI: 10.1128/JVI.00089-16
gD-Independent Superinfection Exclusion of Alphaherpesviruses
Abstract
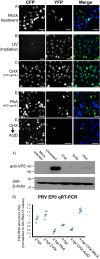
Many viruses have the capacity to prevent a cell from being infected by a second virus, often termed superinfection exclusion. Alphaherpesviruses, including the human pathogen herpes simplex virus 1 (HSV-1) and the animal herpesvirus pseudorabies virus (PRV), encode a membrane-bound glycoprotein, gD, that can interfere with subsequent virion entry. We sought to characterize the timing and mechanism of superinfection exclusion during HSV-1 and PRV infection. To this end, we utilized recombinant viruses expressing fluorescent protein (FP) markers of infection that allowed the visualization of viral infections by microscopy and flow cytometry as well as the differentiation of viral progeny. Our results demonstrated the majority of HSV-1- and PRV-infected cells establish superinfection exclusion by 2 h postinfection. The modification of viral infections by virion inactivation and phosphonoacetic acid, cycloheximide, and actinomycin D treatments indicated new protein synthesis is needed to establish superinfection exclusion. Primary infection with gene deletion PRV recombinants identified that new gD expression is not required to establish superinfection exclusion of a secondary viral inoculum. We also identified the timing of coinfection events during axon-to-cell spread, with most occurring within a 2-h window, suggesting a role for cellular superinfection exclusion during neuroinvasive spread of infection. In summary, we have characterized a gD-independent mechanism of superinfection exclusion established by two members of the alphaherpesvirus family and identified a potential role of exclusion during the pathogenic spread of infection.
Importance: Superinfection exclusion is a widely observed phenomenon initiated by a primary viral infection to prevent further viruses from infecting the same cell. The capacity for alphaherpesviruses to infect the same cell impacts rates of interviral recombination and disease. Interviral recombination allows genome diversification, facilitating the development of resistance to antiviral therapeutics and evasion of vaccine-mediated immune responses. Our results demonstrate superinfection exclusion occurs early, through a gD-independent process, and is important in the directed spread of infection. Identifying when and where in an infected host viral genomes are more likely to coinfect the same cell and generate viral recombinants will enhance the development of effective antiviral therapies and interventions.
Copyright © 2016 Criddle et al.
Figures


Similar articles
-
Superinfection Exclusion of Alphaherpesviruses Interferes with Virion Trafficking.Microbiol Spectr. 2022 Jun 29;10(3):e0068422. doi: 10.1128/spectrum.00684-22. Epub 2022 May 23. Microbiol Spectr. 2022. PMID: 35604159 Free PMC article.
-
Common characteristics and unique features: A comparison of the fusion machinery of the alphaherpesviruses Pseudorabies virus and Herpes simplex virus.Adv Virus Res. 2019;104:225-281. doi: 10.1016/bs.aivir.2019.05.007. Epub 2019 Jul 3. Adv Virus Res. 2019. PMID: 31439150
-
Functional Characterization of Glycoprotein H Chimeras Composed of Conserved Domains of the Pseudorabies Virus and Herpes Simplex Virus 1 Homologs.J Virol. 2015 Oct 21;90(1):421-32. doi: 10.1128/JVI.01985-15. Print 2016 Jan 1. J Virol. 2015. PMID: 26491153 Free PMC article.
-
Two Sides to Every Story: Herpes Simplex Type-1 Viral Glycoproteins gB, gD, gH/gL, gK, and Cellular Receptors Function as Key Players in Membrane Fusion.Viruses. 2021 Sep 16;13(9):1849. doi: 10.3390/v13091849. Viruses. 2021. PMID: 34578430 Free PMC article. Review.
-
Advances in the immunoescape mechanisms exploited by alphaherpesviruses.Front Microbiol. 2024 Jun 19;15:1392814. doi: 10.3389/fmicb.2024.1392814. eCollection 2024. Front Microbiol. 2024. PMID: 38962133 Free PMC article. Review.
Cited by
-
A Single Herpes Simplex Virus 1 Genome Reactivates from Individual Cells.Microbiol Spectr. 2022 Aug 31;10(4):e0114422. doi: 10.1128/spectrum.01144-22. Epub 2022 Jul 11. Microbiol Spectr. 2022. PMID: 35862979 Free PMC article.
-
Genomic recombination between infectious laryngotracheitis vaccine strains occurs under a broad range of infection conditions in vitro and in ovo.PLoS One. 2020 Mar 2;15(3):e0229082. doi: 10.1371/journal.pone.0229082. eCollection 2020. PLoS One. 2020. PMID: 32119681 Free PMC article.
-
Superinfection Exclusion in Mosquitoes and Its Potential as an Arbovirus Control Strategy.Viruses. 2020 Nov 5;12(11):1259. doi: 10.3390/v12111259. Viruses. 2020. PMID: 33167513 Free PMC article. Review.
-
Herpes Simplex Virus 1 Replication, Ocular Disease, and Reactivations from Latency Are Restricted Unilaterally after Inoculation of Virus into the Lip.J Virol. 2019 Nov 26;93(24):e01586-19. doi: 10.1128/JVI.01586-19. Print 2019 Dec 15. J Virol. 2019. PMID: 31554680 Free PMC article.
-
Dihydromyricetin Inhibits Pseudorabies Virus Multiplication In Vitro by Regulating NF-κB Signaling Pathway and Apoptosis.Vet Sci. 2023 Feb 2;10(2):111. doi: 10.3390/vetsci10020111. Vet Sci. 2023. PMID: 36851415 Free PMC article.
References
Publication types
MeSH terms
Substances
Grants and funding
LinkOut - more resources
Full Text Sources
Other Literature Sources

