. 2016 Apr;22(4):316-24.
doi: 10.1111/cns.12500. Epub 2016 Feb 4.

Vessel Dilation Attenuates Endothelial Dysfunction Following Middle Cerebral Artery Occlusion in Hyperglycemic Rats

Affiliations

Vessel Dilation Attenuates Endothelial Dysfunction Following Middle Cerebral Artery Occlusion in Hyperglycemic Rats

Zhi-Hao Mu et al. CNS Neurosci Ther. 2016 Apr.

Abstract

Objectives: Dynamically observe cerebral vascular changes in hyperglycemic rats in vivo and explore the effect of diabetes on endothelial function after ischemic stroke.

Background: Diabetes affects both large and small vessels in the brain, but the dynamic process and mechanism are unclear.

Methods: We investigated the structural and functional changes of brain vasculature in living hyperglycemic rats and their impact on stroke outcomes via a novel technique: synchrotron radiation angiography. We also examined the effect of prolonged fasudil treatment on arterial reactivity and hemorrhagic transformation. Adult Sprague Dawley rats were treated by streptozotocin to induce type 1 diabetes. These hyperglycemic rats received fasudil pretreatment and then underwent transient middle cerebral artery occlusion.

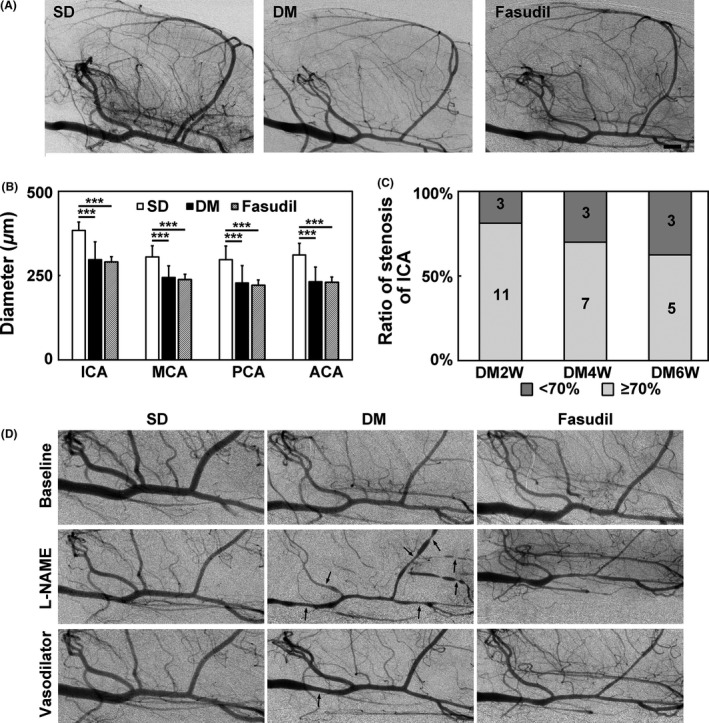
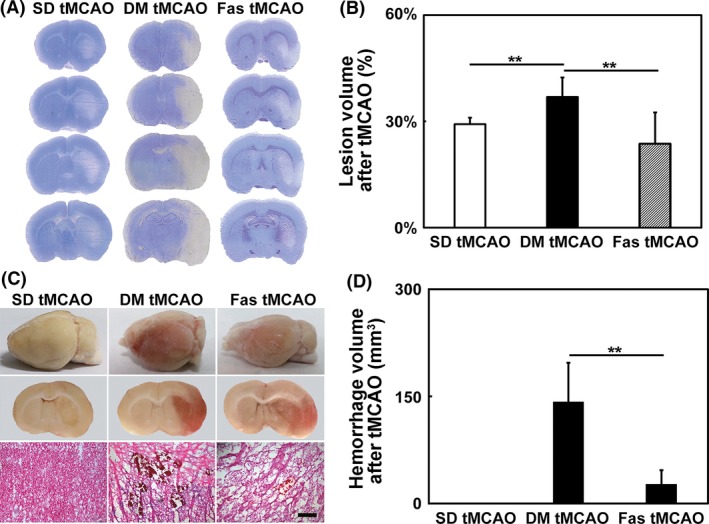
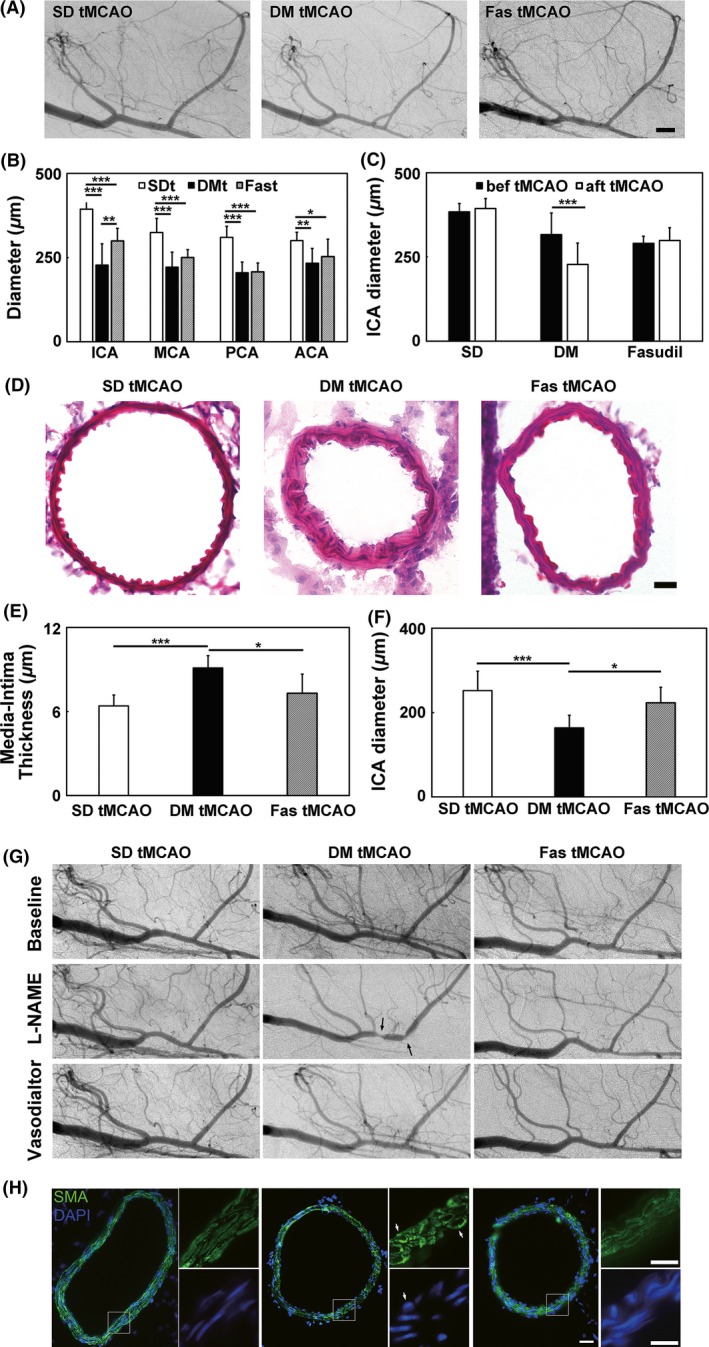
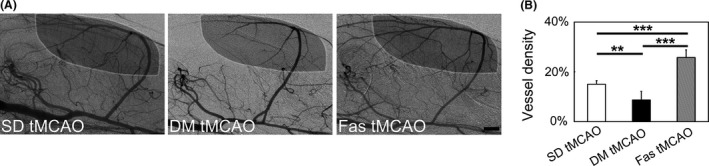
Results: We found that diabetes caused arteries narrowing in the circus Willis as early as 2 weeks after streptozotocin injection (P < 0.05). These vessels were further constricted after middle cerebral artery occlusion. L-NAME could induce regional constrictions and impaired relaxation in hyperglycemic animals. Furthermore, hemorrhagic transformation was also increased in the hyperglycemic rats compared to the control (P < 0.05). In fasudil-treated rats, the internal carotid artery narrowing was ameliorated and L-NAME-induced regional constriction was abolished. Importantly, stroke prognosis was improved in fasudil-treated rats compared to the control (P < 0.05).

Conclusions: Our dynamic angiographic data demonstrated that diabetes could impair the cerebral arterial reactivity. Prolonged fasudil treatment could attenuate arterial dysfunction and improve the prognosis of ischemic stroke by affecting both the large and small vasculature.

Keywords: Fasudil; Hyperglycemia; Ischemia; Synchrotron radiation; Vascular dysfunction.


Conflict of interest statement

The authors declare no conflict of interest.

Figures

Figure 1
Figure 1
Fasudil preserved endothelial function in hyperglycemic rats. (A) Synchrotron radiation angiogram (SRA) images of the SD, hyperglycemic and fasudil‐treated hyperglycemic rats. (B) Bar graph of arterial diameters of ICA, MCA, PCA, and ACA in SD, hyperglycemic, and fasudil‐treated hyperglycemic rats. n = 7–8 per group, values are mean ± SD, ***P < 0.001, compared with SD. (C) Percentage of arterial stenosis of ICA in DM2W, DM4W, and DM6W rats, which represent for 2, 4, 6 weeks after hyperglycemia induction. (D) SRA images of the SD, hyperglycemic and fasudil‐treated hyperglycemic rats before intervention, after L‐NAME and vasodilator fasudil injection. Black arrow points to focal constrictions. Bar = 1 mm.
Figure 2
Figure 2
Fasudil treatment improved stroke prognosis in hyperglycemic rats. (A) Cresyl violet stained coronary sections of rat brain at 1 day after transient middle cerebral artery occlusion (tMCAO) in the SD, hyperglycemic and fasudil‐treated hyperglycemic rats. (B) Bar graph of the infarct volumes in SD, hyperglycemic and fasudil‐treated hyperglycemic rats. The three groups were abbreviated as SD tMCAO, DM tMCAO, and Fas tMCAO. n = 6–9 per group, values are mean ± SD, **P < 0.01, SD tMCAO versus DM tMCAO, DM tMCAO versus Fas tMCAO. (C) Pictures of whole brain, coronary sections of brain and H&E staining showed hemorrhage. (D) Bar graph of the hemorrhage volume in the SD rats, hyperglycemic and fasudil‐treated hyperglycemic rats. n = 6–9 per group, values are mean ± SD, **P < 0.01, DM tMCAO versus Fas tMCAO. Bar = 200 μm.
Figure 3
Figure 3
Fasudil treatment partly prevented ischemia‐induced arterial constrictions in hyperglycemic rats. (A) Synchrotron radiation angiogram (SRA) images of SD, hyperglycemic and fasudil‐treated hyperglycemic rats at 1 day after transient middle cerebral artery occlusion (tMCAO). Bar = 1000 μm. (B). Bar graph of arterial diameters of ICA, MCA, PCA, and ACA in SD, hyperglycemic and fasudil‐treated hyperglycemic rats at 1 day after tMCAO. The three groups were abbreviated as SDt, DMt, and Fast. n = 6–12 per group, values are mean ± SD, *P < 0.05, SDt ACA versus Fast ACA; **P < 0.01, DMt ICA versus Fast ICA; ***P < 0.001, SDt ICA versus DMt ICA, SDt ICA versus Fast ICA, SDt MCA versus DMt MCA, SDt MCA versus Fast MCA, SDt PCA versus DMt PCA, SDt PCA versus Fast PCA. (C) Bar graph of arterial diameters of ICA before and after tMCAO. n = 6–12 per group, values are mean ± SD, ***P < 0.001, DM bef tMCAO versus DM aft tMCAO. (D) HE staining of ICA. Bar = 10 μm. (E) Media–intima thickness of ICA. n = 4–5 per group, values are mean ± SD, *P < 0.05, DM tMCAO versus Fas tMCAO; ***P < 0.001, SD tMCAO versus DM tMCAO. (F) Internal diameter of ICA. n = 4–5 per group, values are mean ± SD, *P < 0.05, DM tMCAO versus Fas tMCAO; ***P < 0.001, SD tMCAO versus DM tMCAO. (G) SRA images of the SD rats, hyperglycemic and fasudil‐treated hyperglycemic rats 1 day after tMCAO at the time before intervention, after L‐NAME and vasodilator injection. Black arrow points to focal constrictions. (H) SMA immunohistostaining of ICA. White arrow points to the transformed smooth muscle cells. Bar = 20 μm.
Figure 4
Figure 4
Fasudil treatment ameliorated ischemia‐induced arterial constrictions in hyperglycemic rats. (A) Representative SRA images indicating vessel density calculation. White circle showed the area for measurement. (B) Bar graph of vessel density in cerebral cortex in SD, hyperglycemic and fasudil‐treated hyperglycemic rats one day after tMCAO. n = 4–8 per group, values are mean ± SD, **P < 0.01, SD tMCAO versus DM tMCAO; ***P < 0.001, DM tMCAO versus Fas tMCAO, SD tMCAO versus Fas tMCAO. Bar = 1 mm.

References

    1. Grundy SM, Benjamin IJ, Burke GL, et al. Diabetes and cardiovascular disease: A statement for healthcare professionals from the American Heart Association. Circulation 1999;100:1134–1146. - PubMed
    1. Alvarez‐Sabin J, Molina CA, Montaner J, et al. Effects of admission hyperglycemia on stroke outcome in reperfused tissue plasminogen activator–treated patients. Stroke 2003;34:1235–1241. - PubMed
    1. Ergul A, Kelly‐Cobbs A, Abdalla M, Fagan SC. Cerebrovascular complications of diabetes: Focus on stroke. Endocr Metab Immune Disord Drug Targets 2012;12:148–158. - PMC - PubMed
    1. Yan T, Chopp M, Ning R, Zacharek A, Roberts C, Chen J. Intracranial aneurysm formation in type‐one diabetes rats. PLoS ONE 2013;8:e67949. - PMC - PubMed
    1. Cosentino F, Rubattu S, Savoia C, Venturelli V, Pagannonne E, Volpe M. Endothelial dysfunction and stroke. J Cardiovasc Pharmacol 2001;38(Suppl 2):S75–S78. - PubMed

Publication types

MeSH terms