. 2016 Feb 3:48:10.
doi: 10.1186/s12711-016-0187-z.

Differential contribution of genomic regions to marked genetic variation and prediction of quantitative traits in broiler chickens

Affiliations

Differential contribution of genomic regions to marked genetic variation and prediction of quantitative traits in broiler chickens

Rostam Abdollahi-Arpanahi et al. Genet Sel Evol. .

Abstract

Background: Genome-wide association studies in humans have found enrichment of trait-associated single nucleotide polymorphisms (SNPs) in coding regions of the genome and depletion of these in intergenic regions. However, a recent release of the ENCyclopedia of DNA elements showed that ~80 % of the human genome has a biochemical function. Similar studies on the chicken genome are lacking, thus assessing the relative contribution of its genic and non-genic regions to variation is relevant for biological studies and genetic improvement of chicken populations.

Methods: A dataset including 1351 birds that were genotyped with the 600K Affymetrix platform was used. We partitioned SNPs according to genome annotation data into six classes to characterize the relative contribution of genic and non-genic regions to genetic variation as well as their predictive power using all available quality-filtered SNPs. Target traits were body weight, ultrasound measurement of breast muscle and hen house egg production in broiler chickens. Six genomic regions were considered: intergenic regions, introns, missense, synonymous, 5' and 3' untranslated regions, and regions that are located 5 kb upstream and downstream of coding genes. Genomic relationship matrices were constructed for each genomic region and fitted in the models, separately or simultaneously. Kernel-based ridge regression was used to estimate variance components and assess predictive ability. Contribution of each class of genomic regions to dominance variance was also considered.

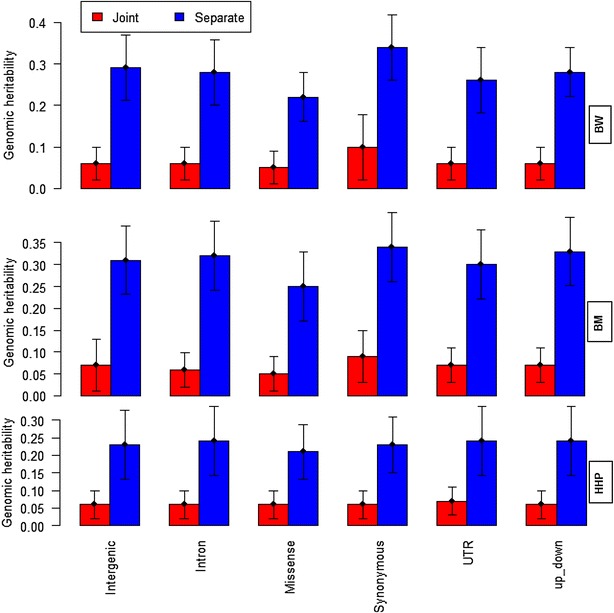
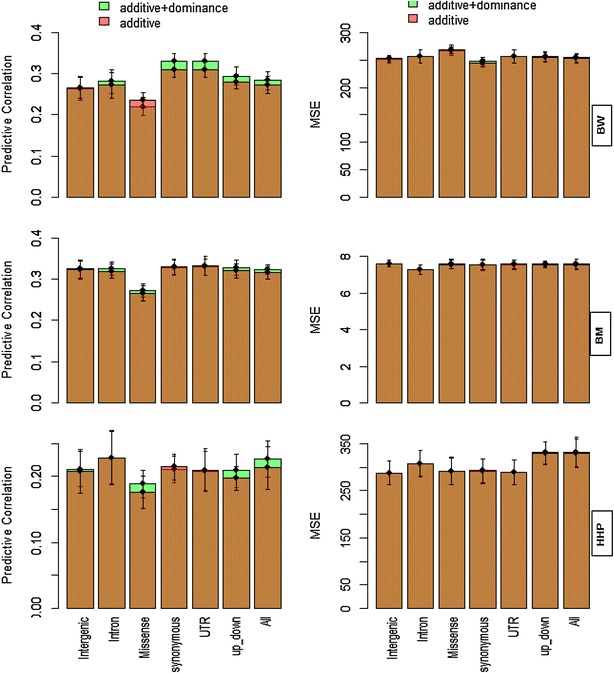
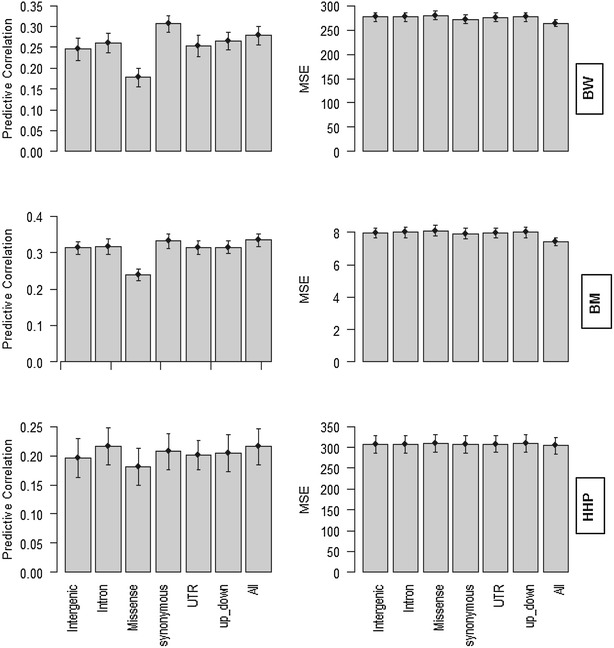
Results: Variance component estimates indicated that all genomic regions contributed to marked additive genetic variation and that the class of synonymous regions tended to have the greatest contribution. The marked dominance genetic variation explained by each class of genomic regions was similar and negligible (~0.05). In terms of prediction mean-square error, the whole-genome approach showed the best predictive ability.

Conclusions: All genic and non-genic regions contributed to phenotypic variation for the three traits studied. Overall, the contribution of additive genetic variance to the total genetic variance was much greater than that of dominance variance. Our results show that all genomic regions are important for the prediction of the targeted traits, and the whole-genome approach was reaffirmed as the best tool for genome-enabled prediction of quantitative traits.


Figures

Fig. 1
Fig. 1
Marked genomic heritability estimates with SNPs partitioned into six classes of genomic regions for body weight (BW), ultra-sound of breast muscle (BM) and hen house egg production (HHP). Red bars and blue bars show joint and separate analyses, respectively. “up-down” indicates regions that are located 5 kb upstream and downstream of the gene. The whiskers represent 95 % confidence interval
Fig. 2
Fig. 2
Heat map visualizing the degree of similarity between additive and dominance genomic relationship matrices for each genomic region. Very similar matrices are indicated in red and very dissimilar matrices are in white. Variable names that begin with an “A_” denote additive relationships and those with a “D_” denote dominance relationships. “up-down” indicates regions that are located 5 kb upstream and downstream of the gene
Fig. 3
Fig. 3
Predictive correlations and prediction mean-squared errors (MSE) resulting from different classes of genomic regions for body weight (BW), ultra-sound of breast muscle (BM) and hen house egg production (HHP) from the separate analysis of additive (G) and additive + dominance (G + D) kernels for each genomic region. The results were based on a fourfold cross-validation with 15 replications. “up-down” indicates regions that are located 5 kb upstream and downstream of the gene. “All” means that all SNPs were used to construct G. The whiskers represent 95 % confidence intervals and overlapping bars are in bronze color
Fig. 4
Fig. 4
Predictive correlations and prediction mean-squared error (MSE) for the six classes of genomic regions for body weight (BW), ultra-sound of breast muscle (BM) and hen house egg production (HHP) from the joint analysis of all additive kernels (G1+G2++G6). The results were based on a fourfold cross-validation with 15 replications. “up-down” indicates regions that are located 5 kb upstream and downstream of the gene. “All” means that all SNPs were used to construct G. The whiskers represent 95 % confidence intervals

References

    1. The ENCODE Project Consortium An integrated encyclopedia of DNA elements in the human genome. Nature. 2012;489:57–74. doi: 10.1038/nature11247. - DOI - PMC - PubMed
    1. van Bakel H, Nislow C, Blencowe BJ, Hughes TR. Most “dark matter” transcripts are associated with known genes. PLoS Biol. 2010;8:e1000371. doi: 10.1371/journal.pbio.1000371. - DOI - PMC - PubMed
    1. Hindorff LA, Sethupathy P, Junkins HA, Ramos EM, Mehta JP, Collins FS, et al. Potential etiologic and functional implications of genome-wide association loci for human diseases and traits. Proc Natl Acad Sci USA. 2009;106:9362–9367. doi: 10.1073/pnas.0903103106. - DOI - PMC - PubMed
    1. Kindt AS, Navarro P, Semple CA, Haley CS. The genomic signature of trait-associated variants. BMC Genomics. 2013;14:108. doi: 10.1186/1471-2164-14-108. - DOI - PMC - PubMed
    1. Manolio TA, Collins FS, Cox NJ, Goldstein DB, Hindorff LA, Hunter DJ, et al. Finding the missing heritability of complex diseases. Nature. 2009;461:747–753. doi: 10.1038/nature08494. - DOI - PMC - PubMed

Publication types

LinkOut - more resources