. 2016 Feb 4:7:10615.
doi: 10.1038/ncomms10615.

Cancer-associated SF3B1 mutations affect alternative splicing by promoting alternative branchpoint usage

Affiliations

Cancer-associated SF3B1 mutations affect alternative splicing by promoting alternative branchpoint usage

Samar Alsafadi et al. Nat Commun. .

Abstract

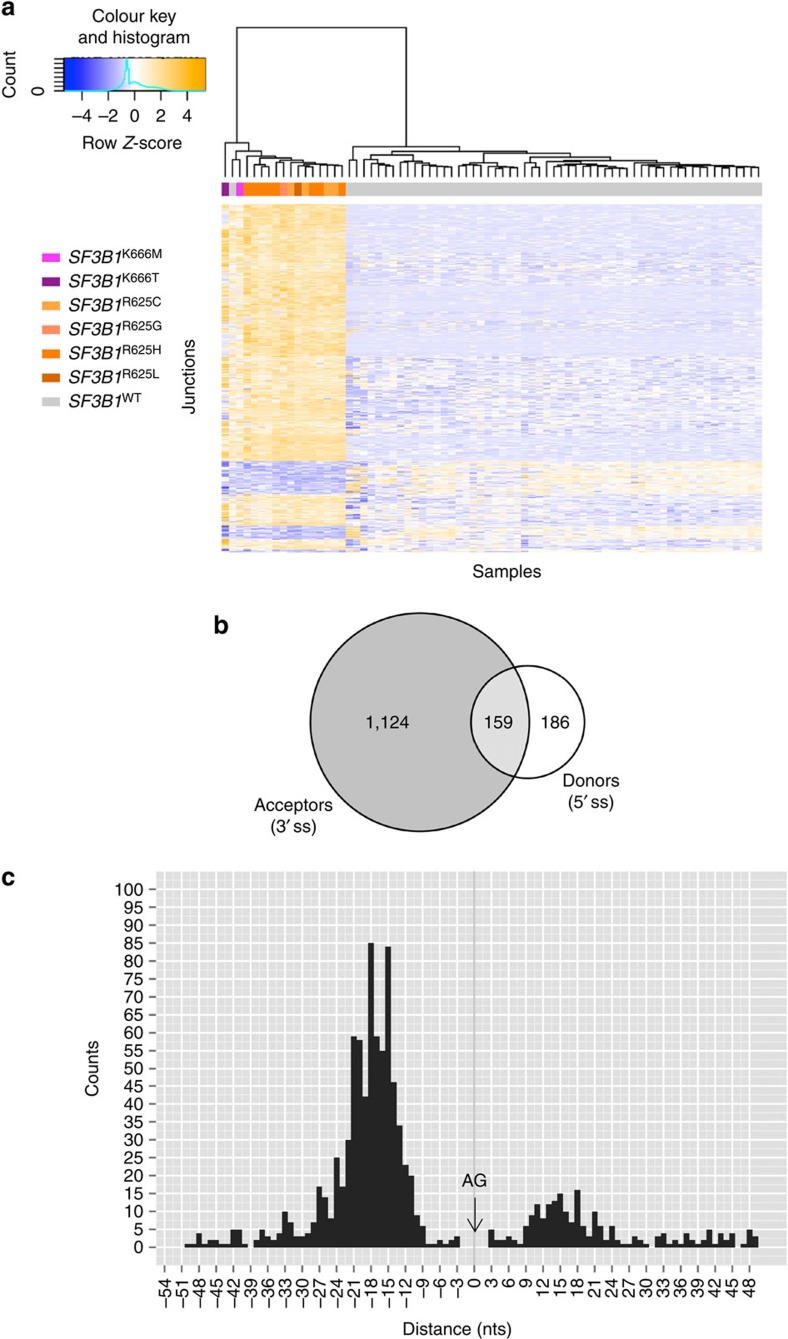
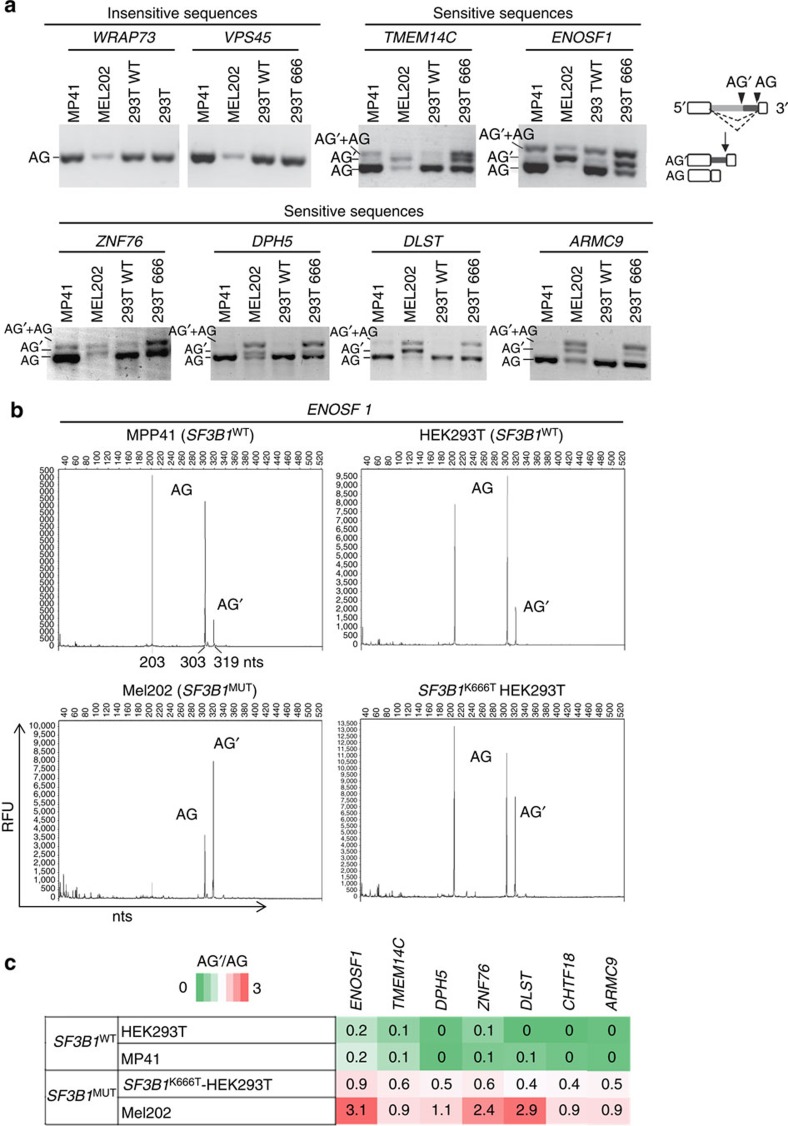
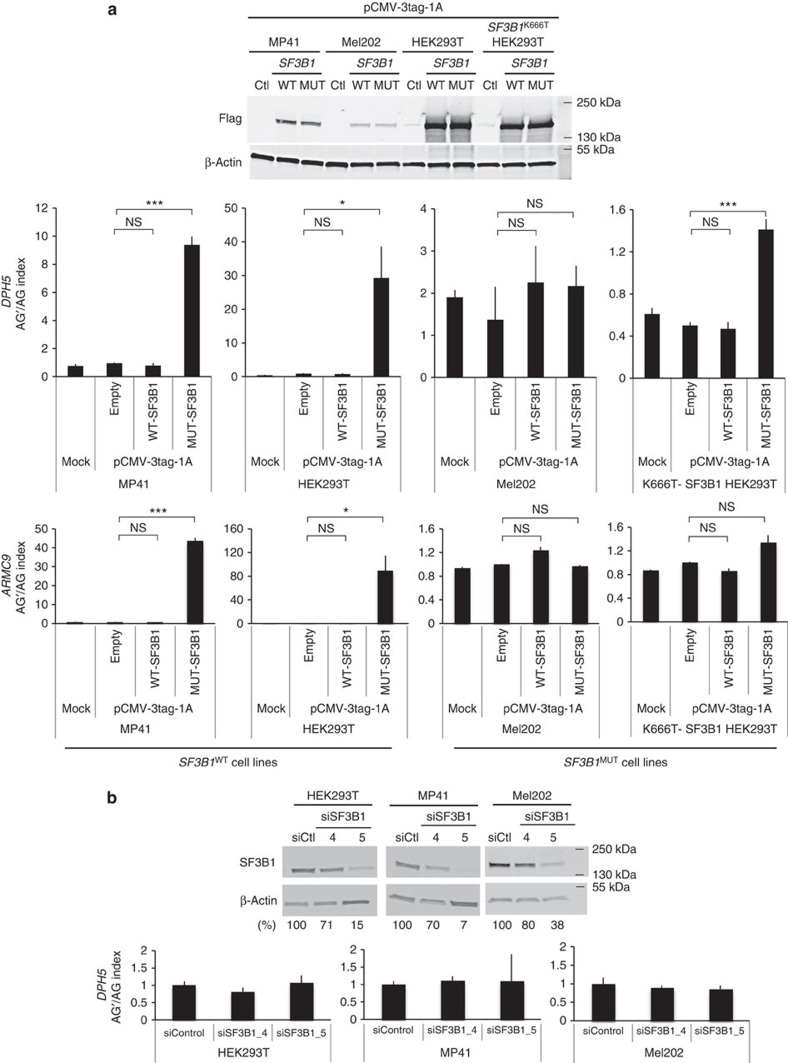
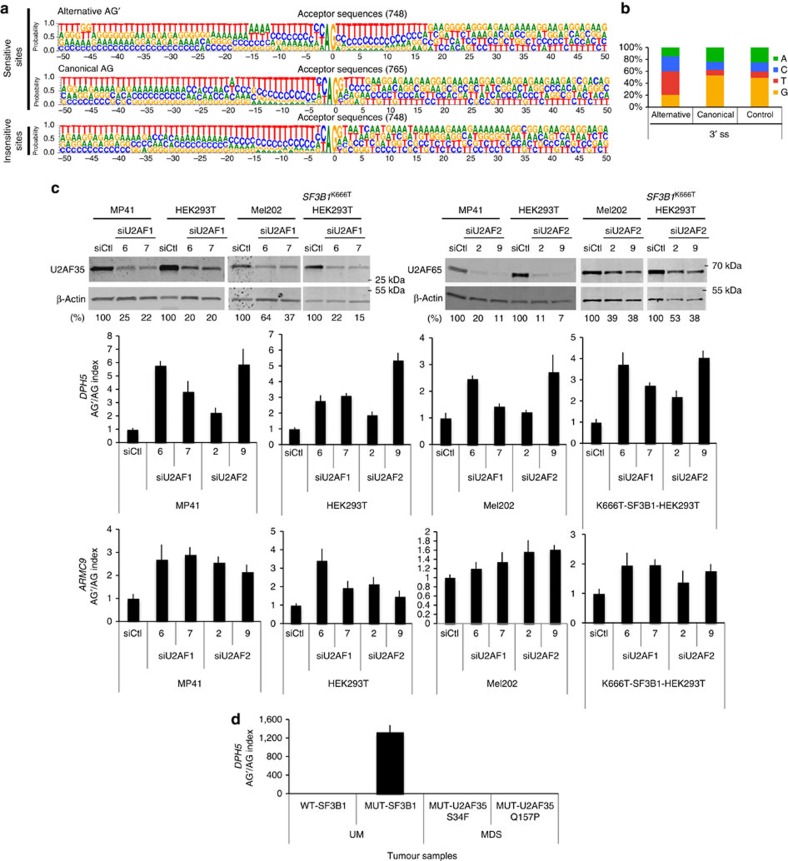
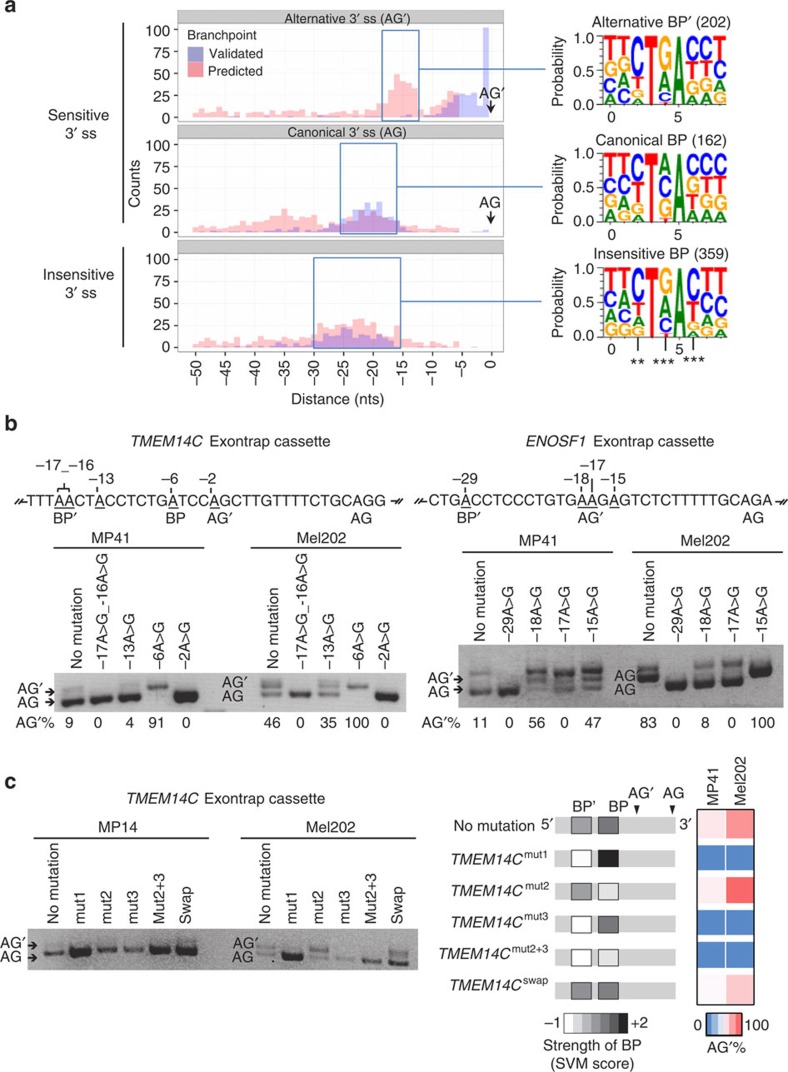
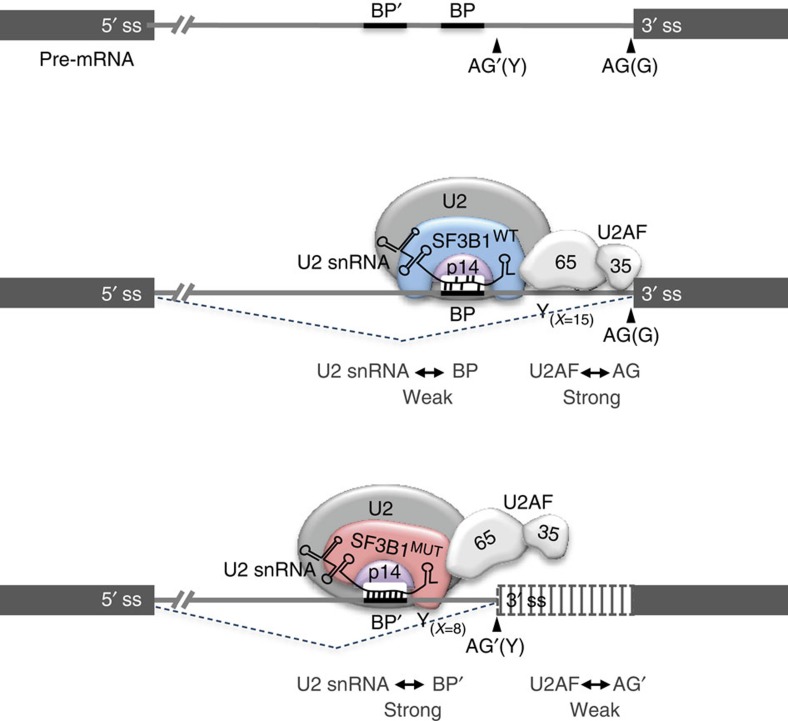
Hotspot mutations in the spliceosome gene SF3B1 are reported in ∼20% of uveal melanomas. SF3B1 is involved in 3'-splice site (3'ss) recognition during RNA splicing; however, the molecular mechanisms of its mutation have remained unclear. Here we show, using RNA-Seq analyses of uveal melanoma, that the SF3B1(R625/K666) mutation results in deregulated splicing at a subset of junctions, mostly by the use of alternative 3'ss. Modelling the differential junctions in SF3B1(WT) and SF3B1(R625/K666) cell lines demonstrates that the deregulated splice pattern strictly depends on SF3B1 status and on the 3'ss-sequence context. SF3B1(WT) knockdown or overexpression do not reproduce the SF3B1(R625/K666) splice pattern, qualifying SF3B1(R625/K666) as change-of-function mutants. Mutagenesis of predicted branchpoints reveals that the SF3B1(R625/K666)-promoted splice pattern is a direct result of alternative branchpoint usage. Altogether, this study provides a better understanding of the mechanisms underlying splicing alterations induced by mutant SF3B1 in cancer, and reveals a role for alternative branchpoints in disease.


Conflict of interest statement

The authors declare no competing financial interests.

Figures

Figure 1
Figure 1. Differential splice junctions in SF3B1MUT tumours.
(a) Hierarchical clustering and heat-map analysis of differential splice junctions in tumour samples. The colours of squares below the tree denote the subtype of each sample. Below the array tree and the subtype identification row, the heat map of the 1,469 splice junctions is shown. The complete list of up- and downregulated splice junctions can be found in Supplementary Data 1. (b) Venn diagram of differential splice junctions in SF3B1MUT compared with SF3B1WT tumours. Numbers show the count of alterations within only 5′ss (186 events) or only 3′ss (1,124 events). The overlapping area represents junctions that are either ambiguously attributed to an alternative donor or acceptor site, or attributed to both alternative 3′ and 5′ splice sites (159 events). (c) Distances between the alternative and canonical SF3B1MUT-sensitive 3′ss. For alternative 3′ss within the 50 nts preceding the canonical 3′ss (765), the distance between the alternative (AG’) and corresponding canonical (AG) 3′ss was plotted as a histogram. Negative distances mean the alternative AG’ upstream of the canonical AG, whereas positive distances mean the AG’ downstream. The 0 point demarks the position of the canonical AG.
Figure 2
Figure 2. In cellulo validation of differential splice junctions.
(a) Minigene splice assay of two SF3B1MUT-insensitive 3′ss (WRAP73 and VPS45) and 6 SF3B1MUT-sensitive 3′ss (TMEM14C, ENOSF1, ZNF76, DPH5, DLST, ARMC9). Gel electrophoresis shows the different splicing processes for minigene ExonTrap constructions in SF3B1WT cell lines (MP41 and HEK293T) and SF3B1MUT cell lines (Mel202 and K666T-SF3B1 HEK293T). The lower band corresponds to the variant generated by the usage of the canonical 3′ss (AG). The intermediate band corresponds to a splice generated by the usage of the alternative 3′ss (AG’). The upper band is the heteroduplex formation from two bands (AG and AG’). (b) Analysis of alternative AG’ and canonical AG usage of the ExonTrap construct (ENOSF1) in cell lines by capillary electrophoresis of RT–PCR products. Representative GeneMarker electrophoregrams for fragment analysis of ENOSF1 minigene cDNA expression are shown. The x axis represents molecular size (in nucleotides (nts)) of PCR products, and the y axis indicates relative fluorescent units (RFUs). The peak of 203 nts refers to the internal splicing of the pET01 ExonTrap vector using its 3′ss and 5′ss. The peak of 303 nts corresponds to the usage of the canonical AG, whereas the peak of 319 nts corresponds to the usage of alternative AG’ WT. (c) Heat-map analysis using the AG’/AG ratio of the top differential splice junctions in cell lines as determined by capillary electrophoresis of RT–PCR products.
Figure 3
Figure 3. Overexpression and underexpression of wild-type SF3B1 do not reproduce the splice pattern of SF3B1 hotspot mutations.
(a) Effect of overexpression of wild-type and mutated SF3B1 on the AG’/AG ratio of DPH5 and ARMC9 in SF3B1WT and SF3B1MUT cell lines. MP41, Mel202, HEK293T and SF3B1K666T-HEK293T cell lines were transiently transfected with expression vectors for SF3B1WT and SF3B1K700E. The protein overexpression was confirmed by immunoblotting with anti-Flag using β-actin as a loading control (upper panel). Ratios of expression levels of alternative AG’ and canonical AG forms (AG’/AG) of DPH5 and ARMC9 were determined by quantitative RT–PCR (lower panel). The results are average of three replicates and are represented as mean±s.d. Paired t-test was used to generate the P-values comparing each condition to the empty vector transfection: NS, non-significant; *P>0.05; ***P<0.001. (b) Effect of siRNA-mediated knockdown of SF3B1 on the AG’/AG ratio in cell lines. HEK293T, MP41 and Mel202 cells were transiently transfected with non-target control siRNA or two different siSF3B1: ‘4’and ‘5’. Proteins and RNA were extracted at 48 h after transfection. siRNA-mediated knockdown was confirmed by immunoblotting with anti-SF3B1, using anti-β-actin as a loading control. Numbers represent the protein band intensity normalized to β-actin and expressed as a percentage of control samples (upper panel). Ratios of expression levels of alternative AG’ form to the expression level of canonical AG form (AG’/AG) of DPH5 were determined by quantitative RT–PCR (lower panel). The results are average of three replicates and are represented as mean±s.d.
Figure 4
Figure 4. Characterization of alternative 3′ss (AG’) sequences.
(a) Comparison of sequence logos of 3′ss sensitive to SF3B1 status with canonical (AG) and alternative (AG’) sequences and 3′ss insensitive to SF3B1 status. One-hundred-nucleotide-long sequences surrounding the 3′ss were used to generate sequence logos with WebLogo. The height of each letter indicates the preference strength for that nucleotide at each position. (b) The proportion of the nucleotides immediately following the alternative (AG’), the canonical (AG) and insensitive 3′ss. (c) Effect of U2AF35 and U2AF65 siRNA-mediated knockdown on the AG’/AG ratio in cell lines. MP41 and HEK293T (SF3B1WT) and Mel202 and SF3B1K666T-HEK293T (SF3B1MUT) cells were transiently transfected with non-target control siRNA, siU2AF35 or siU2AF65. Proteins and RNA were extracted at 48 h after transfection. siRNA-mediated knockdown was confirmed by immunoblotting with anti-U2AF35 and anti-U2AF65, using anti-β-actin as a loading control. Numbers represent the protein band intensity normalized to β-actin and expressed as percentage of control samples (upper panel). Ratio of expression levels of alternative AG’ form to the expression level of canonical AG form (AG’/AG) of DPH5 and ARMC9 was determined by quantitative RT–PCR (lower panel). The results are average of three replicates and are represented as mean±s.d. (d) Effect of U2AF35 hotspot mutations on the AG’/AG ratio of DPH5 in MDS tumours. Ratio of expression levels of alternative AG’ form to the expression level of canonical AG form (AG′/AG) of DPH5 was determined by quantitative RT–PCR in two MDS samples, each harbouring one of the two U2AF35 hotspot mutations, S34F and Q157P and compared with mutated and wild-type SF3B1 uveal melanoma (UM) samples.
Figure 5
Figure 5. Identification of alternative branchpoint usage in an SF3B1MUT context.
(a) Analysis of distances between the branchpoints and the associated alternative (AG’), canonical (AG) or insensitive 3′ss. Left panel: Zero represents the position of the AG’, AG or insensitive 3′ss. Red bars represent the clusters of branchpoints predicted by the tool of SVM, blue bars represent the experimentally determined BP data set reported by Mercer et al.. Right panel: the extracted branchpoint sequence logos generated by WebLogo. **Significantly different in the three branchpoint patterns (χ2 test, P<0.01), ***Significantly different in the three branchpoint patterns (χ2 test, P<0.001). (b) Point mutations of branchpoints in TMEM14C and ENOSF1 ExonTrap constructs. All adenosines within a region of 30 nts preceding the canonical AG were mutated into guanines. Mutant constructs were expressed in MP41 (SF3B1WT) and Mel202 (SF3B1MUT) cells followed by RT–qPCR. The lower band corresponds to the variant generated by the usage of the canonical 3′ss (AG). The intermediate band corresponds to the variant generated by the usage of the alternative 3′ss (AG’). The upper band is the heteroduplex formation from two bands (AG and AG′). The numbers represent the ratio of AG’ usage as determined by capillary electrophoresis. (c) Base-pairing potential mutants of TMEM14C. Mutant constructs (sequences shown in Supplementary Fig. 5) were expressed in MP41 (SF3B1WT) and Mel202 (SF3B1MUT) cells followed by RT–qPCR. The lower band corresponds to the variant generated by the usage of the canonical 3′ss (AG). The upper band corresponds to the variant generated by the usage of the alternative 3′ss (AG’). A schematic presentation of the strength of the resulting branchpoints as estimated by their SVM score is shown on the right panel. The ratio of AG’ usage as determined by capillary electrophoresis in MP41 and Mel202 cells is shown as a heat map.
Figure 6
Figure 6. A model for alternative splicing dysregulation induced by SF3B1 hotspot mutations.
The 3′ss contains a segment, which is rich in pyrimidines (Y), a well-conserved AG dinucleotide and a branchpoint (BP) sequence recognized by the U2 snRNP. The U2 snRNP complex binds to the intron through base-pairing interactions between the BP sequence and the U2 snRNA, and through interactions between intron sequences, SF3B1 and p14. The HEAT repeats of SF3B1 form helical structures that occlude the surface of RNA recognition motif of p14. U2 snRNP containing SF3B1WT recognizes the canonical U2AF-dependant BP. The hotspot mutations of SF3B1 targeting the HEAT repeats occur on the inner surface of the structure and might induce a conformational change in the U2 snRNP complex altering its selectivity for BPs. U2 snRNP containing SF3B1MUT has more stringent requirement for BP sequences and less for U2AF-dependent sequences, leading to the binding of alternative branchpoints (BP’) with high potential of base-pairing with U2 snRNP. AG, canonical 3′ss; AG’, alternative 3′ss; x, average number of pyrimidines; Y, pyrimidine.

References

    1. Quesada V. et al.. Exome sequencing identifies recurrent mutations of the splicing factor SF3B1 gene in chronic lymphocytic leukemia. Nature Genet. 44, 47–52 (2012). - PubMed
    1. Yoshida K. et al.. Frequent pathway mutations of splicing machinery in myelodysplasia. Nature 478, 64–69 (2011). - PubMed
    1. Wang L. et al.. SF3B1 and other novel cancer genes in chronic lymphocytic leukemia. N. Engl. J. Med. 365, 2497–2506 (2011). - PMC - PubMed
    1. Zhang J. & Manley J. L. Misregulation of pre-mRNA alternative splicing in cancer. Cancer Discov. 3, 1228–1237 (2013). - PMC - PubMed
    1. Furney S. J. et al.. SF3B1 mutations are associated with alternative splicing in uveal melanoma. Cancer Discov. 3, 1122–1129 (2013). - PMC - PubMed

Publication types