

Antimicrobial Activity of the Manganese Photoactivated Carbon Monoxide-Releasing Molecule [Mn(CO)3(tpa-κ(3)N)](+) Against a Pathogenic Escherichia coli that Causes Urinary Infections
- PMID: 26842766
- PMCID: PMC4876522
- DOI: 10.1089/ars.2015.6484
Antimicrobial Activity of the Manganese Photoactivated Carbon Monoxide-Releasing Molecule [Mn(CO)3(tpa-κ(3)N)](+) Against a Pathogenic Escherichia coli that Causes Urinary Infections
Abstract
Aims: We set out to investigate the antibacterial activity of a new Mn-based photoactivated carbon monoxide-releasing molecule (PhotoCORM, [Mn(CO)3(tpa-κ(3)N)](+)) against an antibiotic-resistant uropathogenic strain (EC958) of Escherichia coli.
Results: Activated PhotoCORM inhibits growth and decreases viability of E. coli EC958, but non-illuminated carbon monoxide-releasing molecule (CORM) is without effect. NADH-supported respiration rates are significantly decreased by activated PhotoCORM, mimicking the effect of dissolved CO gas. CO from the PhotoCORM binds to intracellular targets, namely respiratory oxidases in strain EC958 and a bacterial globin heterologously expressed in strain K-12. However, unlike previously characterized CORMs, the PhotoCORM is not significantly accumulated in cells, as deduced from the cellular manganese content. Activated PhotoCORM reacts avidly with hydrogen peroxide producing hydroxyl radicals; the observed peroxide-enhanced toxicity of the PhotoCORM is ameliorated by thiourea. The PhotoCORM also potentiates the effect of the antibiotic, doxycycline.
Innovation: The present work investigates for the first time the antimicrobial activity of a light-activated PhotoCORM against an antibiotic-resistant pathogen. A comprehensive study of the effects of the PhotoCORM and its derivative molecules upon illumination is performed and mechanisms of toxicity of the activated PhotoCORM are investigated.
Conclusion: The PhotoCORM allows a site-specific and time-controlled release of CO in bacterial cultures and has the potential to provide much needed information on the generality of CORM activities in biology. Understanding the mechanism(s) of activated PhotoCORM toxicity will be key in exploring the potential of this and similar compounds as antimicrobial agents, perhaps in combinatorial therapies with other agents. Antioxid. Redox Signal. 24, 765-780.
Figures


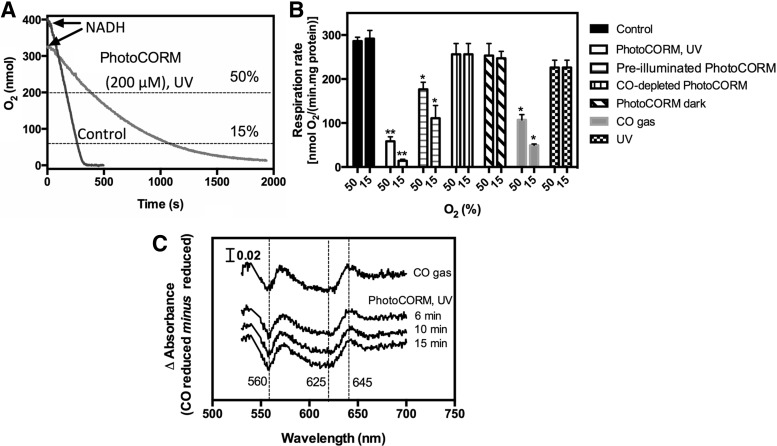

 ] μM) were added to cultures, followed by 6 min of exposure to UV light (365 nm). In (D), cultures were treated with PhotoCORMs as in (C), but kept in the dark. (A) and (B) are representative of three independent experiments. Compounds were added at time zero (arrows). Bars represent the standard error of three independent experiments. CFU, colony-forming unit.

 ) mM H2O2. In (B), control (no additions) (●) and cultures treated with PhotoCORM (100 μM) plus 4 (■), 5 (▲), 6 (▼), 7 (♦), and 8 () mM H2O2 were exposed to UV for 6 min. Compounds were added at time zero (arrows). In (C), over the same time scale as in (A) and (B), cell viability is shown in cultures exposed to UV for 6 min in the absence (white bars) or presence of PhotoCORM (100 μM) (light gray bars), H2O2 (4 mM) (dark gray bars), or a combination of both compounds (black bars). Samples taken immediately before treatment were recorded as time zero. Bars represent the standard error of at least three independent experiments. Student's test was used to compare the viability of cultures treated with H2O2 and PhotoCORM at 14 h to each of the other conditions, *p < 0.05. H2O2, hydrogen peroxide.
 ) μM PhotoCORMs. In (B), PhotoCORM was added as in (A), followed by being exposed to UV light (365 nm) for 6 min. (C) is as (B), but thiourea (80 mM) was added to cultures before the treatment with PhotoCORM. In (D), 0 (●), 6 (■), 7 (▲), 8 (▼), 9 (♦), and 10 () mM H2O2 was added. In (E), cultures treated with PhotoCORM (100 μM) 4 (□), 5 (▲), 6 (▼), 7 (♦), and 8 () mM H2O2 were exposed to UV for 6 min and compared with an untreated control (●). (F) is as (E), but thiourea (80 mM) was added to all cultures before the addition of PhotoCORM and H2O2. (G) is as (A), but CO-depleted PhotoCORM was added instead. In (H), cultures treated with CO-depleted PhotoCORM (100 μM) were supplemented with 4 (■), 5 (▲), 6 (▼), 7 (♦), and 8 () mM H2O2 and compared with an untreated control (●). (I) is as (H), but thiourea (80 mM) was added to all cultures before the addition of CO-depleted PhotoCORM and H2O2. Compounds were added at time zero (arrows). Bars represent the standard error of at least three independent experiments.
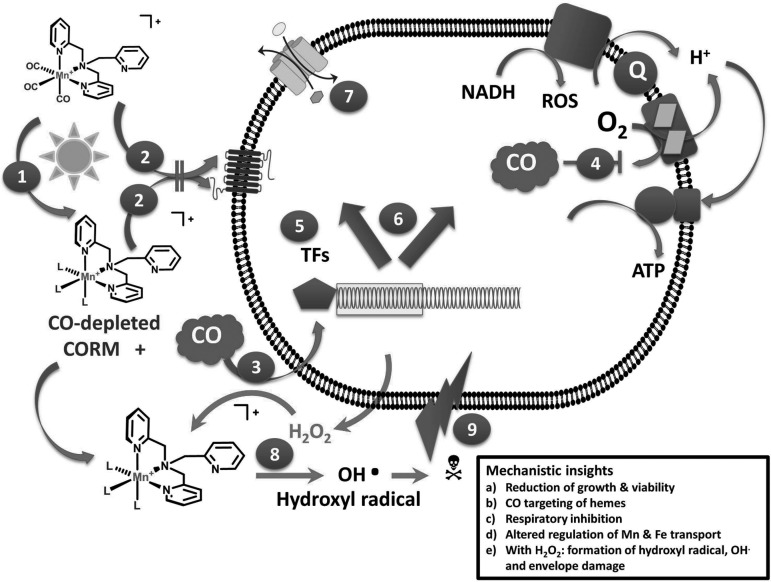
 leads to release of the CO ligands from the manganese coordination sphere. The resulting Mn complex is not transported inward
  , while CO enters the cell via passive diffusion
  , and inhibits NADH-supported respiration
  by competing with oxygen, thereby restricting ATP generation. ROS may be formed. CO binds to cytoplasmic heme proteins (not shown) and is sensed by TFs
  , resulting in transcriptional changes
  in, for example, genes involved in metal acquisition
  . Following the loss of CO, the compound reacts with hydrogen peroxide, exogenous, or metabolism derived
  , forming cytotoxic products such as hydroxyl radicals
  that perturb membrane integrity. The symbol L indicates the diverse solvent- or biomolecule-derived ligands that take the position of the released carbon monoxide. ROS, reactive oxygen species; TF, transcription factor.
References
-
- Berends H-M. and Kurz P. Investigation of light-triggered carbon monoxide release from two manganese photoCORMs by IR, UV–Vis and EPR spectroscopy. Inorg Chim Acta 380: 141–147, 2012
-
- Berne J-P, Lauzier B, Rochette L, and Vergely C. Carbon monoxide protects against ischemia-reperfusion injury in vitro via antioxidant properties. Cell Physiol Biochem 29:475–484, 2012 - PubMed
-
- Bjerrum J, Schwarzenbach G, and Sillen LG. Stability constants of metal-ion complexes, Part II. Inorg Ligand Chem Soc (Lond) Special Publ 7: 131, 1958
-
- Boczkowski J, Poderoso JJ, and Motterlini R. CO-metal interaction: vital signaling from a lethal gas. Trends Biochem Sci 31: 614–621, 2006 - PubMed
MeSH terms
Substances
Grants and funding
LinkOut - more resources
Full Text Sources
Other Literature Sources
Medical