

Activation of GPER suppresses epithelial mesenchymal transition of triple negative breast cancer cells via NF-κB signals
- PMID: 26842883
- PMCID: PMC5423167
- DOI: 10.1016/j.molonc.2016.01.002
Activation of GPER suppresses epithelial mesenchymal transition of triple negative breast cancer cells via NF-κB signals
Abstract
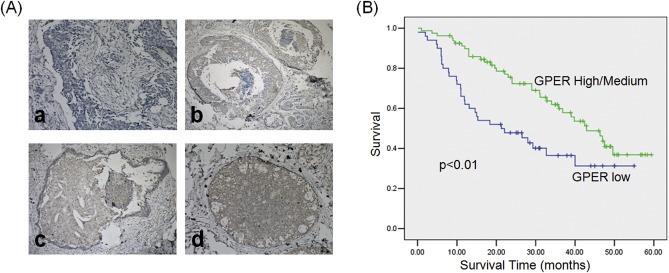
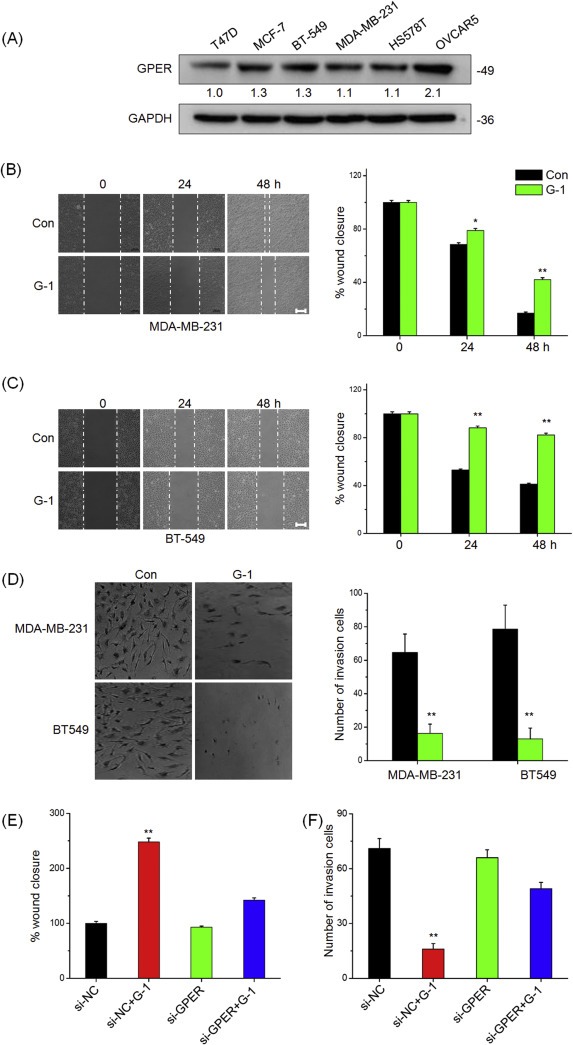
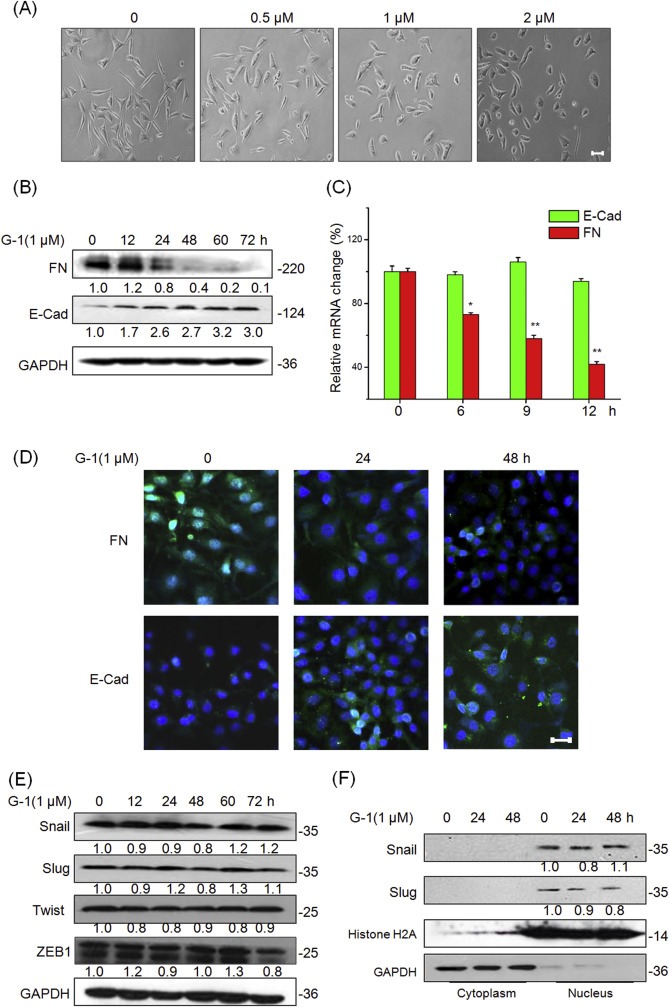
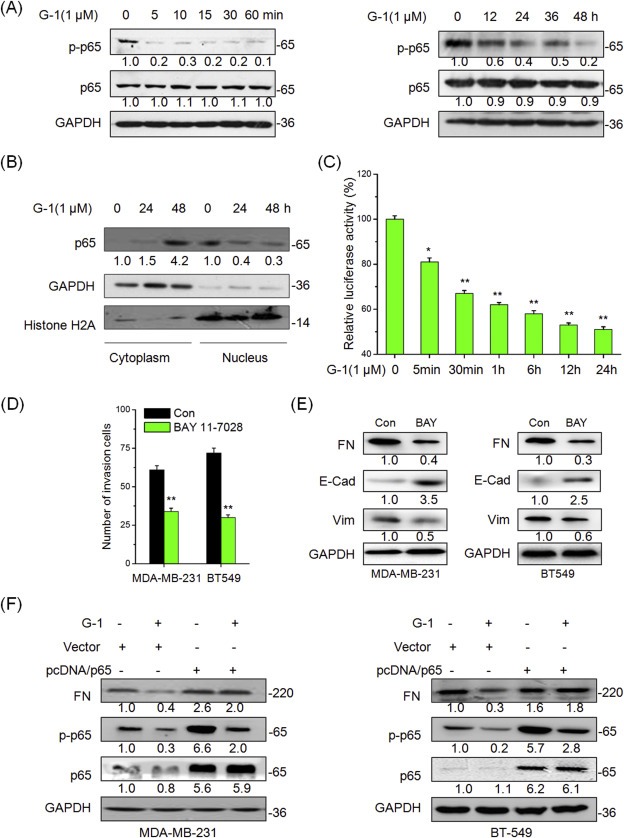
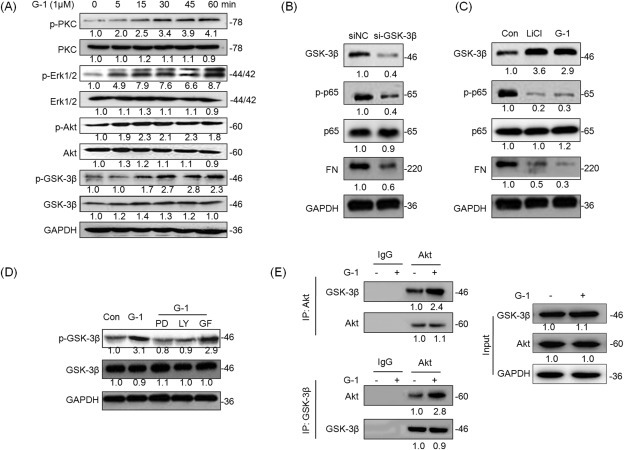
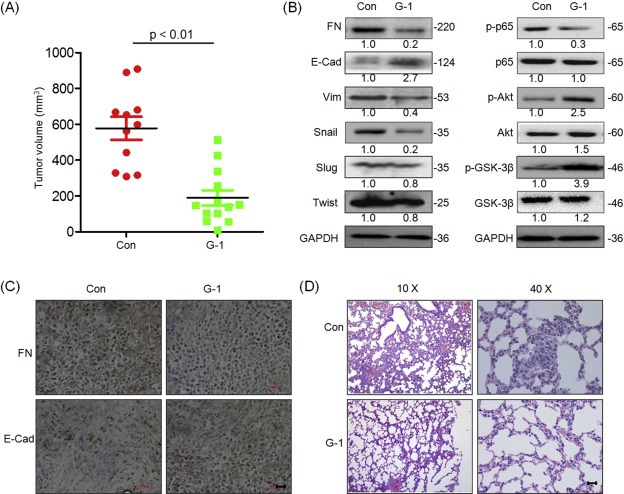
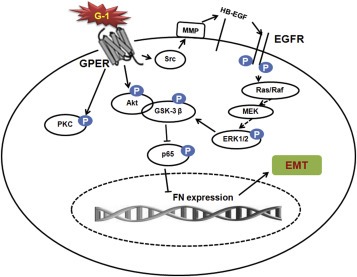
The targeted therapy for triple-negative breast cancer (TNBC) is a great challenge due to our poor understanding on its molecular etiology. In the present study, our clinical data showed that the expression of G-protein coupled estrogen receptor (GPER) is negatively associated with lymph node metastasis, high-grade tumor and fibronectin (FN) expression while positively associated with the favorable outcome in 135 TNBC patients. In our experimental studies, both the in vitro migration and invasion of TNBC cells were inhibited by GPER specific agonist G-1, through the suppression of the epithelial mesenchymal transition (EMT). The G-1 treatment also reduced the phosphorylation, nuclear localization, and transcriptional activities of NF-κB. While over expression of NF-κB attenuated the action of G-1 in suppressing EMT. Our data further illustrated that the phosphorylation of GSK-3β by PI3K/Akt and ERK1/2 mediated, at least partially, the inhibitory effect of G-1 on NF-κB activities. It was further confirmed in a study of MDA-MB-231 tumor xenografts in nude mice. The data showed that G-1 inhibited the in vivo growth and invasive potential of TNBC via suppression of EMT. Our present study demonstrated that an activation of GPER pathway elicits tumor suppressive actions on TNBC, and supports the use of G-1 therapeutics for TNBC metastasis.
Keywords: EMT; G-1; GPER; NF-κB; TNBC.
Copyright © 2016 Federation of European Biochemical Societies. Published by Elsevier B.V. All rights reserved.
Figures
Similar articles
-
Estrogen Actions in Triple-Negative Breast Cancer.Cells. 2020 Oct 26;9(11):2358. doi: 10.3390/cells9112358. Cells. 2020. PMID: 33114740 Free PMC article. Review.
-
Activation of GPER suppresses migration and angiogenesis of triple negative breast cancer via inhibition of NF-κB/IL-6 signals.Cancer Lett. 2017 Feb 1;386:12-23. doi: 10.1016/j.canlet.2016.11.003. Epub 2016 Nov 9. Cancer Lett. 2017. PMID: 27836733
-
Inhibition of ERRα suppresses epithelial mesenchymal transition of triple negative breast cancer cells by directly targeting fibronectin.Oncotarget. 2015 Sep 22;6(28):25588-601. doi: 10.18632/oncotarget.4436. Oncotarget. 2015. PMID: 26160845 Free PMC article.
-
GPER mediates enhanced cell viability and motility via non-genomic signaling induced by 17β-estradiol in triple-negative breast cancer cells.J Steroid Biochem Mol Biol. 2014 Sep;143:392-403. doi: 10.1016/j.jsbmb.2014.05.003. Epub 2014 May 27. J Steroid Biochem Mol Biol. 2014. PMID: 24874276
-
Myricetin-induced apoptosis in triple-negative breast cancer cells through inhibition of the PI3K/Akt/mTOR pathway.Med Oncol. 2022 Oct 8;39(12):248. doi: 10.1007/s12032-022-01856-z. Med Oncol. 2022. PMID: 36209343 Review.
Cited by
-
Upregulation of G Protein-Coupled Estrogen Receptor by Chrysin-Nanoparticles Inhibits Tumor Proliferation and Metastasis in Triple Negative Breast Cancer Xenograft Model.Front Endocrinol (Lausanne). 2020 Sep 15;11:560605. doi: 10.3389/fendo.2020.560605. eCollection 2020. Front Endocrinol (Lausanne). 2020. PMID: 33042020 Free PMC article.
-
Long non-coding RNA AFAP1-AS1 facilitates tumor growth and promotes metastasis in colorectal cancer.Biol Res. 2016 Aug 30;49(1):36. doi: 10.1186/s40659-016-0094-3. Biol Res. 2016. PMID: 27578191 Free PMC article.
-
RNA m6A methylation regulates the epithelial mesenchymal transition of cancer cells and translation of Snail.Nat Commun. 2019 May 6;10(1):2065. doi: 10.1038/s41467-019-09865-9. Nat Commun. 2019. Retraction in: Nat Commun. 2023 Nov 16;14(1):7424. doi: 10.1038/s41467-023-43307-x. PMID: 31061416 Free PMC article. Retracted.
-
Epigenetic down regulation of G protein-coupled estrogen receptor (GPER) functions as a tumor suppressor in colorectal cancer.Mol Cancer. 2017 May 5;16(1):87. doi: 10.1186/s12943-017-0654-3. Mol Cancer. 2017. PMID: 28476123 Free PMC article.
-
Estrogen Actions in Triple-Negative Breast Cancer.Cells. 2020 Oct 26;9(11):2358. doi: 10.3390/cells9112358. Cells. 2020. PMID: 33114740 Free PMC article. Review.
References
-
- Bartucci, M. , Morelli, C. , Mauro, L. , Ando, S. , Surmacz, E. , 2001. Differential insulin-like growth factor I receptor signaling and function in estrogen receptor (ER)-positive MCF-7 and ER-negative MDA-MB-231 breast cancer cells. Cancer Res. 61, 6747–6754. - PubMed
-
- Chen, Z.J. , Yang, X.L. , Liu, H. , Wei, W. , Zhang, K.S. , Huang, H.B. , 2015. Bisphenol A modulates colorectal cancer protein profile and promotes the metastasis via induction of epithelial to mesenchymal transitions. Arch. Toxicol. 89, 1371–1381. - PubMed
MeSH terms
Substances
LinkOut - more resources
Full Text Sources
Other Literature Sources
Miscellaneous
