. 2016 Apr 1;27(7):1154-69.
doi: 10.1091/mbc.E15-02-0099. Epub 2016 Feb 3.

RNase P protein subunit Rpp29 represses histone H3.3 nucleosome deposition

Affiliations

RNase P protein subunit Rpp29 represses histone H3.3 nucleosome deposition

Alyshia Newhart et al. Mol Biol Cell. .

Abstract

In mammals, histone H3.3 is a critical regulator of transcription state change and heritability at both euchromatin and heterochromatin. The H3.3-specific chaperone, DAXX, together with the chromatin-remodeling factor, ATRX, regulates H3.3 deposition and transcriptional silencing at repetitive DNA, including pericentromeres and telomeres. However, the events that precede H3.3 nucleosome incorporation have not been fully elucidated. We previously showed that the DAXX-ATRX-H3.3 pathway regulates a multi-copy array of an inducible transgene that can be visualized in single living cells. When this pathway is impaired, the array can be robustly activated. H3.3 is strongly recruited to the site during activation where it accumulates in a complex with transcribed sense and antisense RNA, which is distinct from the DNA/chromatin. This suggests that transcriptional events regulate H3.3 recruited to its incorporation sites. Here we report that the nucleolar RNA proteins Rpp29, fibrillarin, and RPL23a are also components of this H3.3/RNA complex. Rpp29 is a protein subunit of RNase P. Of the other subunits, POP1 and Rpp21 are similarly recruited suggesting that a variant of RNase P regulates H3.3 chromatin assembly. Rpp29 knockdown increases H3.3 chromatin incorporation, which suggests that Rpp29 represses H3.3 nucleosome deposition, a finding with implications for epigenetic regulation.


Figures

FIGURE 1:
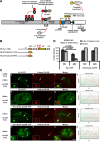
FIGURE 1:
Histone H3.3 is enriched in nucleoli before being incorporated into chromatin. (A) Diagram of the inducible transgene drawn to scale. Cherry-lac repressor allows the transgene integration site to be visualized. Transcription is induced from the minimal CMV promoter by the activators Cherry-tTA-ER (+)4-OHT and rtTA (+)Dox. The transcribed RNA encodes CFP fused to a peroxisomal targeting signal (SKL). The RNA is visualized by YFP-MS2, which binds to the stem-loops in the transcript. The 3′ end of the transcription unit is composed of the intron 2 splicing unit from the rabbit β-globin gene. The recruitment of YFP-tagged factors to the array can be monitored by coexpression with the DNA- and RNA-binding proteins. (B) Diagram of the H3.3 constructs expressed as YFP- or GST-fusion proteins in the recruitment and in vitro binding assays (Figure 3D). The amino acid differences between H3.3 and H3.2/H3.21 are shown in red. The red asterisks in the 4-PTM construct represent K37A, R42A, R49A, and R52A. (C) Localization of H3.3-YFP, expressed in U2OS 2-6-3 cells for 18 (a–d) and 48 h (e–h), in relation to the activated transgene array, marked by Cherry-tTA-ER. Localization of H3.3 N-tail-αN-YFP expressed for 18 (i–l) and 48 h (m–p). Arrows indicate the transgene array, and arrowheads indicate nucleoli. Yellow lines in enlarged merge insets (c, g, k, and o) show the path through which the red and green signals were measured in the intensity profiles (d, h, l, and p). Asterisks mark the start of the measured line. Scale bar, 5 μm, 1 μm (enlarged inset). (D) Percentage of transcriptionally activated cells with enrichment of H3.3-YFP and H3.3 N-tail-αN-YFP at the active transcription site and in nucleoli 18 and 48 h posttransfection. For each time point, 100 cells were counted from three independent transfections. SDs are shown in the form of error bars; p values were calculated using the unpaired t test.
FIGURE 2:
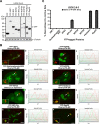
FIGURE 2:
Nucleolar proteins are recruited to the activated transgene array. (A) Western blot of the YFP-tagged nucleolar proteins screened for recruitment to the activated transgene array U2OS 2-6-3 cells detected with α-GFP antibody; γ-tubulin is used as a loading control. Owing to the weaker signals of YFP-NOP56 and YFP-NOP58, a longer exposure of the same gel is shown (outlined region). (B) Merged images of the YFP-tagged nucleolar proteins and Cherry-tTA-ER, which marks the activated transgene array (a, c, e, g, i, k, m, and o). Arrows indicate the location of the transgene array. Yellow lines in enlarged insets show the path through which the red and green intensities were measured in the intensity profiles (b, d, f, h, j, l, n, and p). Asterisks mark the start of the measured line. Scale bar, 5 μm, 1 μm (enlarged inset). (C) Percentage of cells with recruitment of the YFP-tagged nucleolar proteins to the activated transgene array. One hundred cells were counted from three independent transfections. SDs are shown in the form of error bars.
FIGURE 3:
FIGURE 3:
Histone H3.3 forms a complex with Rpp29, fibrillarin, and RPL23a. (A) Localization of YFP-Rpp29, YFP-fibrillarin, and YFP-RPL23a in relation to the inactive transgene array in U2OS 2-6-3 cells marked by Cherry-lac repressor (arrows). Scale bar, 5 μm, 1 μm (enlarged inset). (B) Localization of YFP-Rpp29 (a–d), YFP-Fibrillarin (e–h) and YFP-RPL23a (i–l) in relation to H3.3-CFP and the activator, Cherry-tTA-ER, which is shown in the top enlarged insets in c, g, and k. Yellow lines in enlarged merge insets (bottom inset, c, g, and k) show the path through which the red, green, and blue intensities were measured in the intensity profiles (d, h, and l). Asterisks mark the start of the measured line. (C) Pearson’s r analysis of the overlap between YFP-tagged proteins and Cherry-tTA-ER (white bars) and H3.3-CFP (gray bars) at the activated transgene array. The correlation between Cherry-tTA-ER and YFP-tTA-ER (n = 10) was analyzed as a positive control. Cherry-tTA-ER and H3.3-YFP (n = 11) were analyzed as a negative control. Rpp29 (n = 11), fibrillarin (n = 10), and RPL23a (n = 13) were compared with both Cherry-tTA-ER and H3.3-CFP. (D) Analyses of interactions between YFP-tagged proteins, detected with α-GFP antibody, and the bacterially expressed GST proteins, GST, GST-H3.3 (N-tail-αN) wild type (WT), and the 4-PTM construct (diagram in Figure 1B), detected by colloidal blue staining. Right, analysis of the effects of RNase A, RNase III, and DNase I treatments on binding.
FIGURE 4:
FIGURE 4:
The RNase P subunits POP1 and Rpp21 are recruited to the activated transgene array. (A) Western blot of the YFP-tagged RNase P and RNase MRP protein subunits, screened for recruitment to the activated transgene array in U2OS 2-6-3 cells, using α-GFP antibody; γ-tubulin is used as a loading control. Arrow indicates YFP-POP1. Owing to the weak signal of YFP-POP1 on the blot, a longer exposure of the same gel is shown in the outlined region. (B) Localization of YFP-POP1 (a–d) and YFP-Rpp21 (e–h) at the activated transgene array in relation to the activator, Cherry-tTA-ER. Arrows indicate the location of the transgene array. Yellow lines in enlarged merge insets show the path through which the red and green intensities were measured in the intensity profiles (d, h). Asterisks mark the start of the measured line. Scale bar, 5 μm, 1 μm (enlarged inset). (C) Percentage of cells in which the YFP-tagged RNase P/MRP subunits are recruited to the activated transgene array. One hundred cells were counted from three independent transfections. SDs are shown in the form of error bars. (D) Localization of YFP-POP1 and YFP-Rpp21 in relation to the inactive transgene array marked by Cherry-lac repressor.
FIGURE 5:
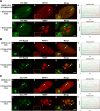
FIGURE 5:
The RNase P and RNase MRP catalytic RNAs are not recruited to the activated transgene array. (A) Strand-specific RNA FISH probes were used to visualize the RNase P (RPPH1; a–d) and RNase MRP (RMRP; e–h) catalytic RNAs at the activated transgene array in U2OS 2-6-3 stably expressing YFP-MS2 and rtTA. YFP-MS2 was used to mark the active site (arrows). Yellow lines in enlarged merge insets show the path through which the red and green intensities were measured in the intensity profiles (d, h). Asterisks mark the start of the measured line. Scale bar, 5 μm, 1 μm (enlarged inset). (B) Localization of the RNase P (RPPH1; a–d) and RNase MRP (RMRP; e–h) catalytic RNAs at the activated transgene array in U2OS 2-6-3 cells expressing YFP-Rpp29. Transcription was induced with the activator rtTA (+) Dox. (C) Localization of the RNase P (RPPH1; a–d) and RNase MRP (RMRP; e–h) catalytic RNAs at the activated transgene array in U2OS 2-6-3 cells expressing H3.3-YFP.
FIGURE 6:
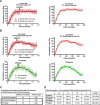
FIGURE 6:
Single-cell analysis of Rpp29 recruitment dynamics suggests that it suppresses transcription at the activated transgene array. (A) Quantification of the changes in the area of the transgene array in U2OS 2-6-3 cells, as detected by Cherry-tTA-ER (red) intensity, during transcriptional activation in YFP-expressing control cells. 4-OHT was added to the medium immediately after the second image in the time series was acquired. Images were collected every 7.5 min for 4 h. Measured areas were normalized to the high and low plateau values and fitted to a model (solid lines). Peak values are indicated in the graphs. Error bars represent SD. Data and fit are shown with 95% prediction bands for the fitted curve (dotted lines, right). (B) Quantification of the areas occupied by Cherry-tTA-ER (red) and YFP-Rpp29 (green) at the transgene array during the course of transcriptional activation. Cherry-tTA-ER values from individual control and YFP-Rpp29–expressing cells are depicted in Supplemental Figure S4. (C) Table of phase 1 and phase 2 peaks and phase 2 slope values. (D) Table of fitting parameters. No overlap is seen in the confidence intervals on the fits of the slopes after peak times.
FIGURE 7:
FIGURE 7:
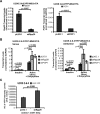
Rpp29 and POP1 repress transcription from the transgene array. (A) qRT-PCR analysis of Rpp29 and POP1 mRNA levels in U2OS 2-6-3 cells stably expressing YFP-MS2 and rtTA cells after shRNA knockdown. SDs are shown in the form of error bars; p values were calculated using an unpaired t test (n = 3). (B) Strand-specific qRT-PCR analysis of total RNA isolated 0 and 3 h after activation in U2OS 263 cells stably expressing YFP-MS2 and rtTA after shRNA knockdown. A primer pair in rabbit β-globin exon 3 was used for PCR. (C) Measurement of the intensity of H3.3-YFP recruited to the activated transgene array in U2OS 2-6-3 cells after control (pLKO.1; n = 30) and Rpp29 (n = 31) knockdown.
FIGURE 8:
FIGURE 8:
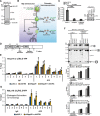
Rpp29 represses histone H3.3 chromatin assembly. (A) Western blot shows levels of endogenous H3.3 and H3.3-YFP in the HeLa HI 1-1/H3.3-YFP (lane 1) and HeLa HI 1-1 (lane 2) cell lines. (B) Diagram of the steps undertaken in the high-salt extraction and chromatin immunoprecipitation protocols. (C) qRT-PCR and Western blot analysis of Rpp29 mRNA and ATRX protein levels, respectively, in HeLa HI 1-1 cells after shRNA knockdown. For qRT-PCR, results are the average of three independent experiments. SDs are shown in the form of error bars; p values were calculated using unpaired t test. (D) The transgene diagram shows the location of the primer pairs used for qPCR analysis of the ChIP results in HeLa HI 1-1/H3.3-YFP cells. (E) ChIP analysis of H3.3-YFP incorporation into the transgene array after knockdowns in HeLa HI 1-1/H3.3-YFP cells. Results are the average of at least three independent experiments, and p values were calculated by comparing pLKO.1 (blue bar) to the shRNA data sets using unpaired t test: *p ≤ 0.05 and **p ≤ 0.01. (F) Representative Western blot of high-salt extraction assay showing H3.3-YFP and H3.3 levels detected using anti-GFP and anti-H3.3 antibodies. Graphs show measurements of (I) H3.3-YFP with anti-GFP antibody, (II) H3.3-YFP with anti-H3.3 antibody, and (III) H3.3 with anti-H3.3 antibody. Results are the average of at least three independent experiments, and p values were calculated using unpaired t test: *p ≤ 0.05, **p ≤ 0.01, and ***p ≤ 0.001. (G) ChIP analysis of H3.3-YFP incorporation into the transgene array in HeLa HI 1-1/H3.3-YFP cells after first detergent extracting and vortexing isolated nuclei.
FIGURE 9:
FIGURE 9:
Rpp29 is not required for maintenance of transcriptional silencing. (A) Strand-specific qRT-PCR analysis of sense and antisense transgene RNA levels in inactive and activated HeLa HI 1-1 and U2OS 2-6-3 cells after shRNA knockdown of Rpp29 and ATRX and ICP0 expression. The pLKO.1 vector was used as a control. A primer pair in rabbit β-globin exon 3 was used for PCR. Results are the average of at least three independent experiments. SDs are shown in the form of error bars; p values were calculated using unpaired t test. (B) Graphs of the average FRAP of H3.3-YFP in HeLa HI 1-1/H3.3-YFP cells over the course of 10 min of imaging. ShRNA constructs were expressed for 72 h before photobleaching: control pLKO.1 (n = 14) and Rpp29+ATRX double knockdown (n = 14). (C) Model of Rpp29 function in histone H3.3 chromatin assembly at a DAXX-ATRX–regulated site, showing two steps: 1) H3.3 recruitment through a transcriptional signal that Rpp29 functions to down-regulate, and 2) nucleosomal deposition of H3.3 by DAXX and ATRX.

Similar articles

Cited by

References

    1. Banaszynski LA, Wen D, Dewell S, Whitcomb SJ, Lin M, Diaz N, Elsasser SJ, Chapgier A, Goldberg AD, Canaani E, et al. Hira-dependent histone H3.3 deposition facilitates PRC2 recruitment at developmental loci in ES cells. Cell. 2013;155:107–120. - PMC - PubMed
    1. Bender S, Tang Y, Lindroth AM, Hovestadt V, Jones DT, Kool M, Zapatka M, Northcott PA, Sturm D, Wang W, et al. Reduced H3K27me3 and DNA hypomethylation are major drivers of gene expression in K27M mutant pediatric high-grade gliomas. Cancer Cell. 2013;24:660–672. - PubMed
    1. Bernstein BE, Mikkelsen TS, Xie X, Kamal M, Huebert DJ, Cuff J, Fry B, Meissner A, Wernig M, Plath K, et al. A bivalent chromatin structure marks key developmental genes in embryonic stem cells. Cell. 2006;125:315–326. - PubMed
    1. Beronja S, Janki P, Heller E, Lien WH, Keyes BE, Oshimori N, Fuchs E. RNAi screens in mice identify physiological regulators of oncogenic growth. Nature. 2013;501:185–190. - PMC - PubMed
    1. Bhavsar RB, Makley LN, Tsonis PA. The other lives of ribosomal proteins. Hum Genomics. 2010;4:327–344. - PMC - PubMed

Publication types

LinkOut - more resources