

Spinal inhibition and motor function in adults with spastic cerebral palsy
- PMID: 26842905
- PMCID: PMC4865571
- DOI: 10.1113/JP271886
Spinal inhibition and motor function in adults with spastic cerebral palsy
Erratum in
-
Article update.J Physiol. 2017 Jun 1;595(11):3679. doi: 10.1113/JP273893. Epub 2017 Mar 26. J Physiol. 2017. PMID: 28343374 Free PMC article. No abstract available.
Abstract
Key points: Abnormal activation of motoneurons in the spinal cord by sensory pathways is thought to contribute to impaired movement control and spasticity in individuals with cerebral palsy. Here we use single motor unit recordings to show how individual motoneurons in the spinal cord respond to sensory inputs in a group of participants with cerebral palsy having different degrees of motor dysfunction. In participants who had problems walking independently and required assistive devices such as wheelchairs, sensory pathways only excited motoneurons in the spinal cord. In contrast, in participants with cerebral palsy who walked independently for long distances, sensory inputs both inhibited and excited motoneurons in the spinal cord, similar to what we found in uninjured control participants. These findings demonstrate that in individuals with severe cerebral palsy, inhibitory control of motoneurons from sensory pathways is reduced and may contribute to motor dysfunction and spasticity.
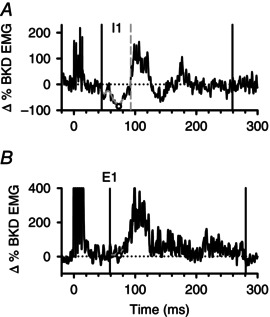
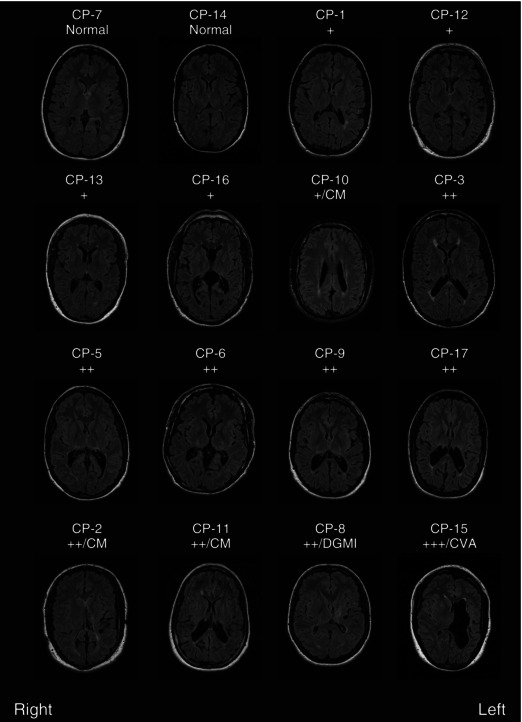
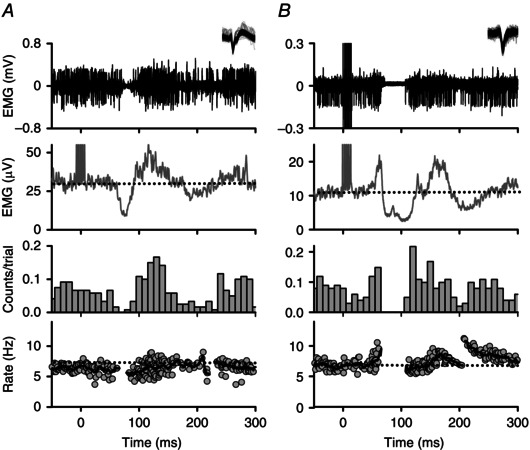
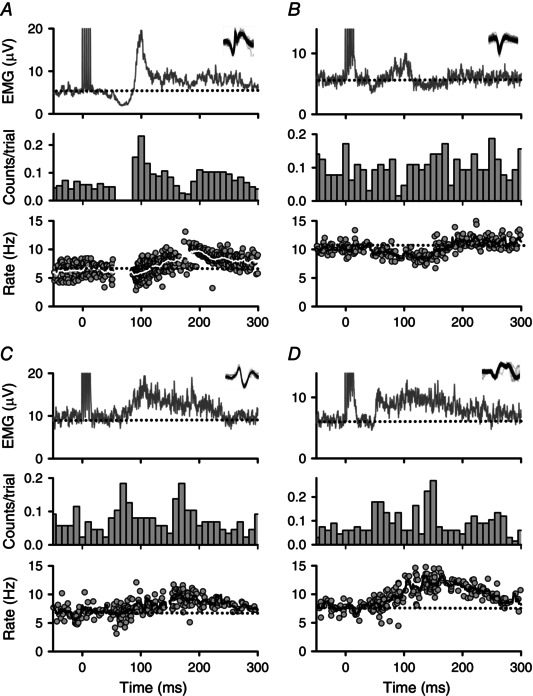
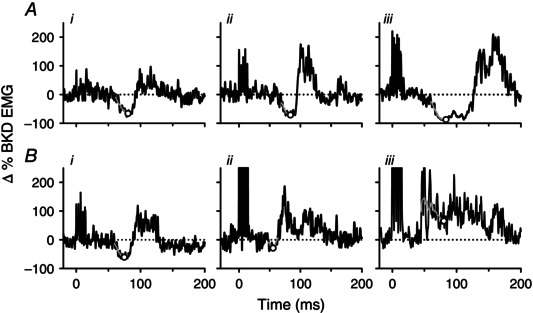
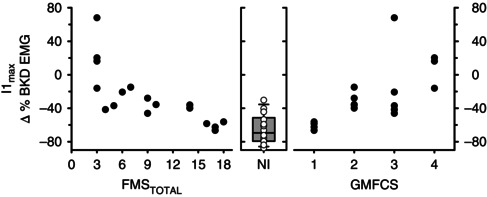
Abstract: Reduced inhibition of spinal motoneurons by sensory pathways may contribute to heightened reflex activity, spasticity and impaired motor function in individuals with cerebral palsy (CP). To measure if the activation of inhibitory post-synaptic potentials (IPSPs) by sensory inputs is reduced in CP, the tonic discharge rate of single motor units from the soleus muscle was plotted time-locked to the occurrence of a sensory stimulation to produce peri-stimulus frequencygrams (PSFs). Stimulation to the medial arch of the foot was used to activate cutaneomuscular afferents in 17 adults with bilateral spastic CP and 15 neurologically intact (NI) peers. Evidence of IPSP activation from the PSF profiles, namely a marked pause or reduction in motor unit firing rates at the onset of the cutaneomuscular reflex, was found in all NI participants but in only half of participants with CP. In the other half of the participants with CP, stimulation of cutaneomuscular afferents produced a PSF profile indicative of a pure excitatory post-synaptic potential, with firing rates increasing above the mean pre-stimulus rate for 300 ms or more. The amplitude of motoneuron inhibition during the period of IPSP activation, as measured from the surface EMG, was less in participants with poor motor function as evaluated with the Gross Motor Functional Classification System (r = 0.72, P < 0.001) and the Functional Mobility Scale (r = -0.82, P < 0.001). These findings demonstrate that in individuals with CP, reduced activation of motoneuron IPSPs by sensory inputs is associated with reduced motor function and may contribute to enhanced reflexes and spasticity in CP.
© 2016 The Authors. The Journal of Physiology © 2016 The Physiological Society.
Figures
Similar articles
-
Changes in sensory-evoked synaptic activation of motoneurons after spinal cord injury in man.Brain. 2008 Jun;131(Pt 6):1478-91. doi: 10.1093/brain/awn050. Epub 2008 Mar 15. Brain. 2008. PMID: 18344559 Free PMC article.
-
Effects of conditioning cutaneomuscular stimulation on the soleus H-reflex in normal and spastic paretic subjects during walking and standing.J Neurophysiol. 1994 Nov;72(5):2090-104. doi: 10.1152/jn.1994.72.5.2090. J Neurophysiol. 1994. PMID: 7884446
-
Full Activation Profiles and Integrity of Corticospinal Pathways in Adults With Bilateral Spastic Cerebral Palsy.Neurorehabil Neural Repair. 2019 Jan;33(1):59-69. doi: 10.1177/1545968318818898. Epub 2018 Dec 29. Neurorehabil Neural Repair. 2019. PMID: 30595088
-
[Electrophysiological assessment of reflex pathways involved in spasticity].Neurochirurgie. 2003 May;49(2-3 Pt 2):205-14. Neurochirurgie. 2003. PMID: 12746695 Review. French.
-
Some spinal mechanisms of negative motor phenomena in humans.Adv Neurol. 1995;67:305-20. Adv Neurol. 1995. PMID: 8848977 Review.
Cited by
-
Animal models of developmental motor disorders: parallels to human motor dysfunction in cerebral palsy.J Neurophysiol. 2019 Sep 1;122(3):1238-1253. doi: 10.1152/jn.00233.2019. Epub 2019 Aug 14. J Neurophysiol. 2019. PMID: 31411933 Free PMC article.
-
Unmasking the Enigma of Cerebral Palsy: A Traditional Review.Cureus. 2020 Oct 17;12(10):e11004. doi: 10.7759/cureus.11004. Cureus. 2020. PMID: 33209560 Free PMC article. Review.
-
Article update.J Physiol. 2017 Jun 1;595(11):3679. doi: 10.1113/JP273893. Epub 2017 Mar 26. J Physiol. 2017. PMID: 28343374 Free PMC article. No abstract available.
-
How Can Biomechanics Improve Physical Preparation and Performance in Paralympic Athletes? A Narrative Review.Sports (Basel). 2021 Jun 24;9(7):89. doi: 10.3390/sports9070089. Sports (Basel). 2021. PMID: 34202455 Free PMC article. Review.
-
Quadriceps muscle stimulation evokes heteronymous inhibition onto soleus with limited Ia activation compared to femoral nerve stimulation.Exp Brain Res. 2022 Sep;240(9):2375-2388. doi: 10.1007/s00221-022-06422-7. Epub 2022 Jul 26. Exp Brain Res. 2022. PMID: 35881156 Free PMC article.
References
-
- Achache V, Roche N, Lamy JC, Boakye M, Lackmy A, Gastal A, Quentin V & Katz R (2010). Transmission within several spinal pathways in adults with cerebral palsy. Brain 133, 1470–1483. - PubMed
-
- Adair B, Said CM, Rodda J & Morris ME (2012). Psychometric properties of functional mobility tools in hereditary spastic paraplegia and other childhood neurological conditions. Dev Med Child Neurol 54, 596–605. - PubMed
-
- Aniss AM, Gandevia SC & Burke D (1992). Reflex responses in active muscles elicited by stimulation of low‐threshold afferents from the human foot. J Neurophysiol 67, 1375–1384. - PubMed
-
- Binboga E, Prasartwuth O, Pehlivan M & Turker KS (2011). Responses of human soleus motor units to low‐threshold stimulation of the tibial nerve. Exp Brain Res 213, 73–86. - PubMed
-
- Bohannon RW & Smith MB (1987). Interrater reliability of a modified Ashworth scale of muscle spasticity. Phys Ther 67, 206–207. - PubMed
Publication types
MeSH terms
Grants and funding
LinkOut - more resources
Full Text Sources
Other Literature Sources
Medical
Miscellaneous