

Development of novel FP-based probes for live-cell imaging of nitric oxide dynamics
- PMID: 26842907
- PMCID: PMC4743004
- DOI: 10.1038/ncomms10623
Development of novel FP-based probes for live-cell imaging of nitric oxide dynamics
Abstract
Nitric oxide () is a free radical with a wide range of biological effects, but practically impossible to visualize in single cells. Here we report the development of novel multicoloured fluorescent quenching-based probes by fusing a bacteria-derived -binding domain close to distinct fluorescent protein variants. These genetically encoded probes, referred to as geNOps, provide a selective, specific and real-time read-out of cellular dynamics and, hence, open a new era of bioimaging. The combination of geNOps with a Ca(2+) sensor allowed us to visualize and Ca(2+) signals simultaneously in single endothelial cells. Moreover, targeting of the probes was used to detect signals within mitochondria. The geNOps are useful new tools to further investigate and understand the complex patterns of signalling on the single (sub)cellular level.
Conflict of interest statement
E.E., M.W.-W., R.M. and W.F.G. have filed a UK patent application (patent application number 1419073.0) that describe parts of the research in this manuscript. This does not alter the authors' adherence to all of the policies on sharing data and materials presented in this manuscript. The remaining authors declare no competing financial interests.
Figures
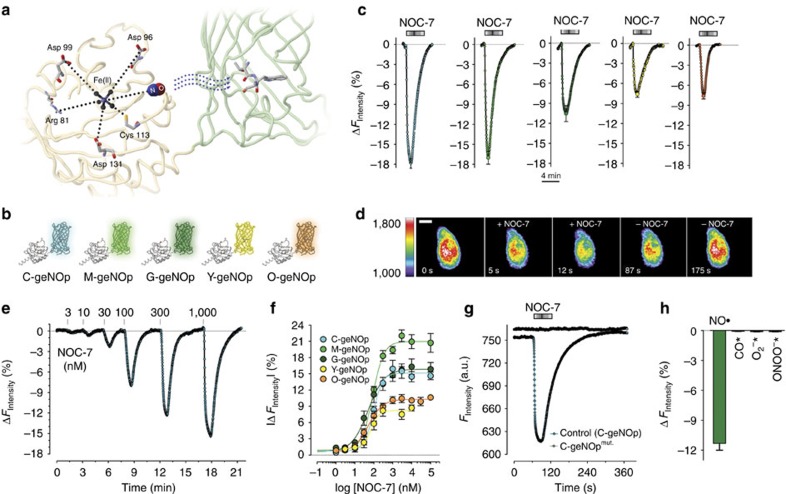
 , green column, n=26), 100 μM of the CO-releasing compound CORM-3 (CO, n=16), 100 μM KO2 (O2, n=12) or 100 μM peroxynitrite (ONOO−, n=7). *P<0.05 versus control using the unpaired t-test.
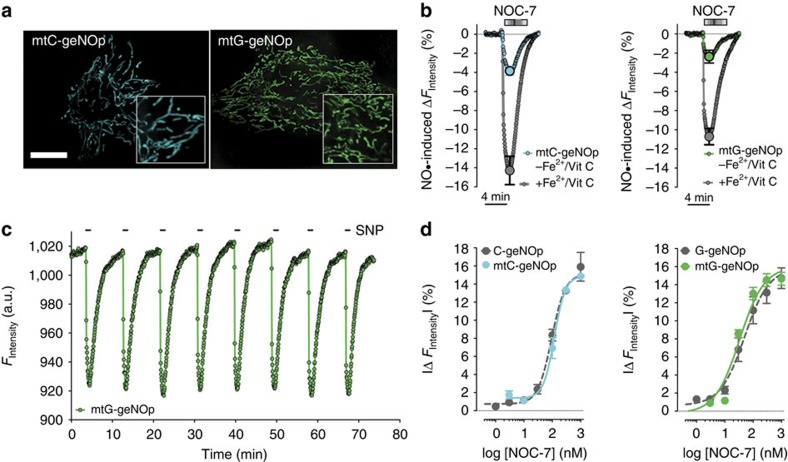
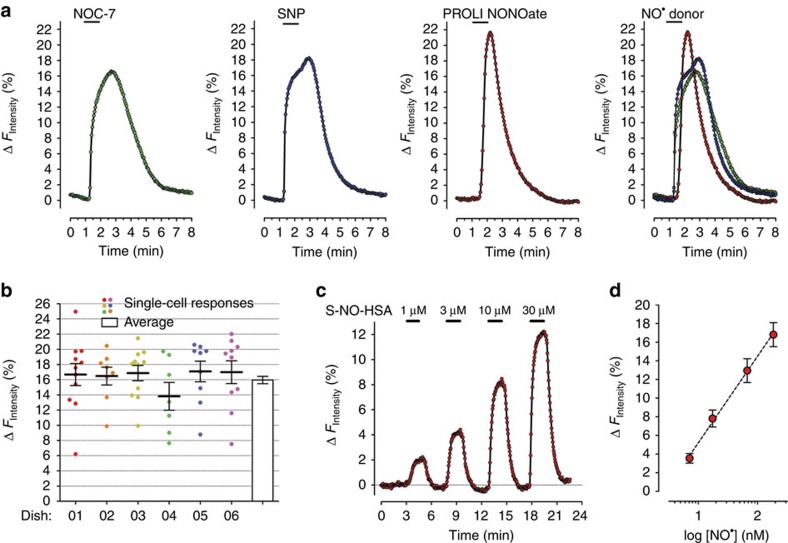 dynamics in response to 1 μM NOC-7, 1 mM SNP or 1 μM PROLI NONOate. Cells expressing C-geNOp were imaged. Inverted curves (1−F/F0 in %) are shown. Average curves with s.e.m. are shown in Supplementary Fig. 15. (b) Scatter dot plot showing maximal single-cell C-geNOp signals in response to 10 μM NOC-7 on different dishes. White column represents the normalized average±s.e.m. C-geNOp signal of all single HeLa cells (n=67). (c) Intracellular dynamics of a single HeLa cell expressing C-geNOp in response to different concentrations of S-NO-HSA (curve is inverted). (d) Respective ΔFIntensity mean values±s.e.m. are blotted against concentrations that are released by 1, 3, 10 and 30 μM S-NO-HSA (n=6). released by S-NO-HSA was quantified using a porphyrinic nanosensor (for details see Supplementary Fig. 16 and methods).
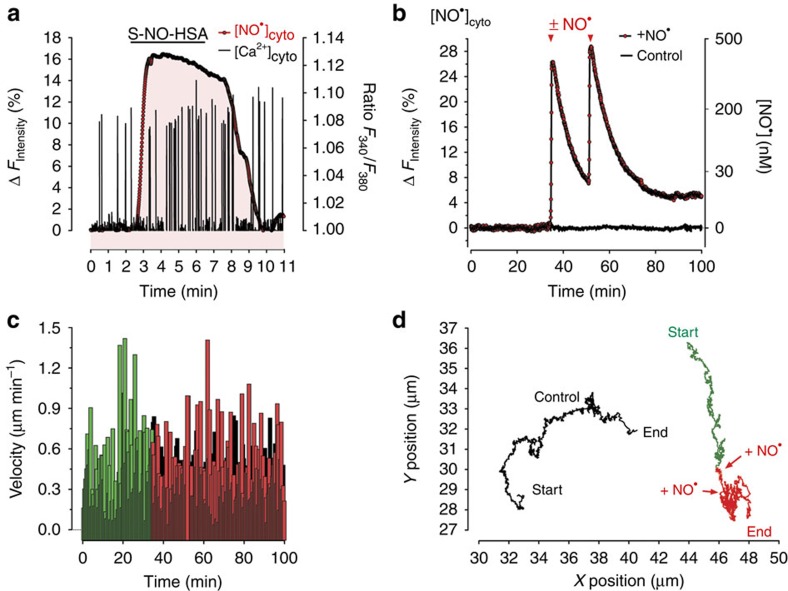 (red inverted curve) signals over time of a single fura-2/am-loaded embryonic ventricular cardiomyocyte expressing G-geNOp. The cell was treated with 30 μM S-NO-HSA in the presence of extracellular Ca2+ using a perfusion system (n=4). (b) Representative recordings of cellular dynamics (red inverted curve, n=4) of human glioblastoma cells (U87-MG cells) expressing C-geNOp. Cells were either treated with a mixture of 10 μM PROLI NONOate and 10 μM NOC-7 (red curve) or remained untreated (control cell, black curve). (c) Cell velocity of glioblastoma cells in μm min−1 extracted from the X/Y positions over time of a control cell (black columns) and a cell treated with donors as indicated in b and d. (d) Graphs represent X/Y positions of glioblastoma cells over time as indicated in b and c.
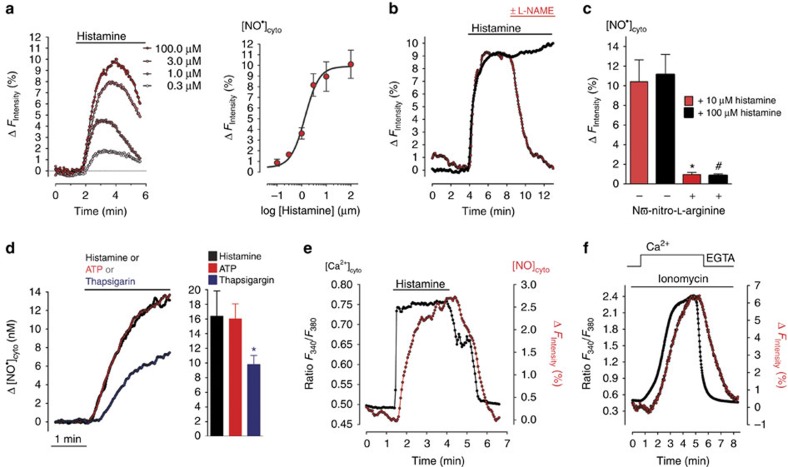 responses upon cell treatment with different concentrations of histamine (right panel, 0.3 μM; 1.0 μM; 3.0 μM; 100 μM histamine, inverted curves are shown) in the absence of extracellular Ca2+. For the concentration response curve (right panel), cells expressing C-geNOp were stimulated with 0.1 μM (n=6), 0.3 μM (n=6), 1.0 μM (n=7), 3.0 μM (n=7), 10.0 μM (n=7) or 100.0 μM (n=12) histamine, yielding an effector concentration for half-maximum response of 1.4 (0.8–2.5) μM. Red points represent average values±s.e.m. (b) Cellular dynamics of EA.hy926 cells expressing C-geNOp. Cells were stimulated with 100 μM histamine in Ca2+ containing buffer for 9 min under control conditions (black inverted curve, n=4) or during stimulation, 1 mM L-NAME was added (red inverted curve, n=9). (c) Columns represent maximal G-geNOps signals±s.e.m. in response to either 10 (red columns) or 100 μM (black columns) histamine under control conditions (n=5 for both histamine concentrations) and in the presence of the NOS inhibitor (1 mM; n=10 for both histamine concentrations). *P<0.05 versus control (10 μM histamine); #P<0.05 versus control (100 μM histamine). P values were calculated using unpaired t-test. (d) Average curves over time (right panel) and statistics of the maximal cytosolic increase (columns representing average values±s.e.m. in the left panel) in EA.hy926 cells in response to 30 μM histamine (black curve, black column, n=16), 30 μM ATP (red curve and red column, n=20) or 1 μM thapsigargin (blue curve, blue column, n=15). Endothelial cells expressing C-geNOps were used *P<0.05 versus histamine/ATP using unpaired t-test. (e) Curves represent simultaneous recordings of cellular Ca2+ (black ratio curve) and (red inverted curve) signals over time of a single fura-2/am-loaded endothelial cell expressing O-geNOp as shown in Supplementary Fig. 21. The cell was stimulated with 100 μM histamine in the presence of extracellular Ca2+. (f) Simultaneous recordings of cellular Ca2+ (black ratio curve) and (red inverted curve) signals over time of a single fura-2/am-loaded endothelial cell expressing G-geNOp. During imaging, the cell was treated with 1 μM ionomycin in the absence (1 mM EGTA) and presence of 2 mM Ca2+.
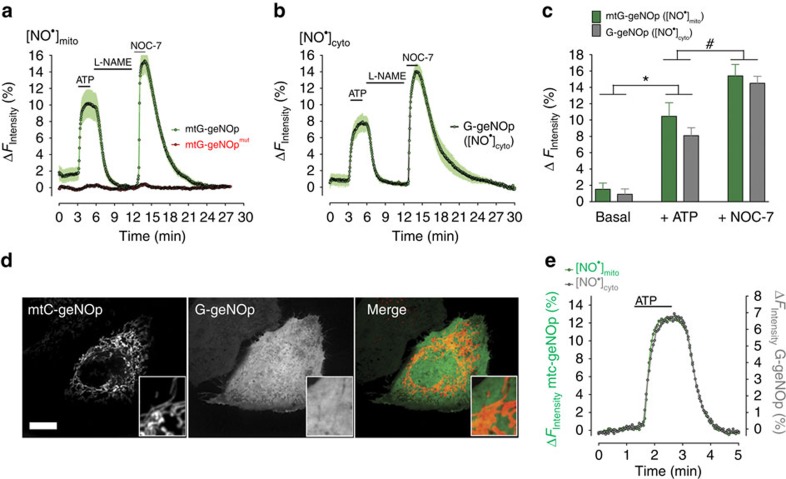 signals measured with mtG-geNOp expressed in EA.hy926 cells (green curve, n=7) and respective signals obtained with mtG-geNOpmut (red curve, n=7). Cells were treated first with 100 μM ATP, then with 1 mM L-NAME and subsequently with 10 μM NOC-7. (b) Average curves±s.e.m. showing cytsolic signals measured with G-geNOp expressed in EA.hy926 cells (green curve, n=5). As shown in a, cells were treated first with 100 μM ATP, then with 1 mM L-NAME and subsequently with 10 μM NOC-7. (c) Columns represent maximal average values of curves shown in a and b. *P<0.05 versus basal. #P<0.05 versus +ATP. P values were calculated using unpaired t-test. (d) Confocal images of endothelial cells expressing both mtC-geNOp (left image) and cytosolic G-geNOp (middle image). Scale bar, 10 μm. (e) Representative simultaneous recordings of mtC-geNOp (grey curve) and cytosolic G-geNOp (green curve) signals over time in a single EA.hy926 cell in response to 100 μM ATP.
Comment in
-
SENSORS AND PROBES. Yes to genetically encoded NO• sensors.Nat Methods. 2016 Apr;13(4):288. doi: 10.1038/nmeth.3827. Nat Methods. 2016. PMID: 27482570 No abstract available.
Similar articles
-
Application of Genetically Encoded Fluorescent Nitric Oxide (NO•) Probes, the geNOps, for Real-time Imaging of NO• Signals in Single Cells.J Vis Exp. 2017 Mar 16;(121):55486. doi: 10.3791/55486. J Vis Exp. 2017. PMID: 28362417 Free PMC article.
-
SENSORS AND PROBES. Yes to genetically encoded NO• sensors.Nat Methods. 2016 Apr;13(4):288. doi: 10.1038/nmeth.3827. Nat Methods. 2016. PMID: 27482570 No abstract available.
-
Genetic biosensors for imaging nitric oxide in single cells.Free Radic Biol Med. 2018 Nov 20;128:50-58. doi: 10.1016/j.freeradbiomed.2018.01.027. Epub 2018 Feb 2. Free Radic Biol Med. 2018. PMID: 29398285 Free PMC article. Review.
-
Intact mitochondrial Ca2+ uniport is essential for agonist-induced activation of endothelial nitric oxide synthase (eNOS).Free Radic Biol Med. 2017 Jan;102:248-259. doi: 10.1016/j.freeradbiomed.2016.11.049. Epub 2016 Dec 5. Free Radic Biol Med. 2017. PMID: 27923677 Free PMC article.
-
Imaging signal transduction in living cells with GFP-based probes.IUBMB Life. 2000 May;49(5):375-9. doi: 10.1080/152165400410218. IUBMB Life. 2000. PMID: 10902568 Review.
Cited by
-
DNA-based fluorescent probes of NOS2 activity in live brains.Proc Natl Acad Sci U S A. 2020 Jun 30;117(26):14694-14702. doi: 10.1073/pnas.2003034117. Epub 2020 Jun 17. Proc Natl Acad Sci U S A. 2020. PMID: 32554491 Free PMC article.
-
Probing Subcellular Iron Availability with Genetically Encoded Nitric Oxide Biosensors.Biosensors (Basel). 2022 Oct 21;12(10):903. doi: 10.3390/bios12100903. Biosensors (Basel). 2022. PMID: 36291039 Free PMC article.
-
Development of heme protein based oxygen sensing indicators.Sci Rep. 2018 Aug 7;8(1):11849. doi: 10.1038/s41598-018-30329-5. Sci Rep. 2018. PMID: 30087408 Free PMC article.
-
A DNA-based fluorescent probe maps NOS3 activity with subcellular spatial resolution.Nat Chem Biol. 2020 Jun;16(6):660-666. doi: 10.1038/s41589-020-0491-3. Epub 2020 Mar 9. Nat Chem Biol. 2020. PMID: 32152543
-
Sensors and controllers-for and from plants.Plant Physiol. 2021 Oct 5;187(2):473-476. doi: 10.1093/plphys/kiab364. Plant Physiol. 2021. PMID: 34608975 Free PMC article. No abstract available.
References
-
- SoRelle R. Nobel prize awarded to scientists for nitric oxide discoveries. Circulation 98, 2365–2366 (1998). - PubMed
-
- Hirst D. G. & Robson T. Nitric oxide physiology and pathology. Methods Mol. Biol. 704, 1–13 (2011). - PubMed
-
- Xu W., Liu L. Z., Loizidou M., Ahmed M. & Charles I. G. The role of nitric oxide in cancer. Cell Res. 12, 311–320 (2002). - PubMed
Publication types
MeSH terms
Substances
Grants and funding
LinkOut - more resources
Full Text Sources
Other Literature Sources
Miscellaneous
