

Growth Charts for Prader-Willi Syndrome During Growth Hormone Treatment
- PMID: 26842920
- PMCID: PMC5922433
- DOI: 10.1177/0009922815617973
Growth Charts for Prader-Willi Syndrome During Growth Hormone Treatment
Abstract
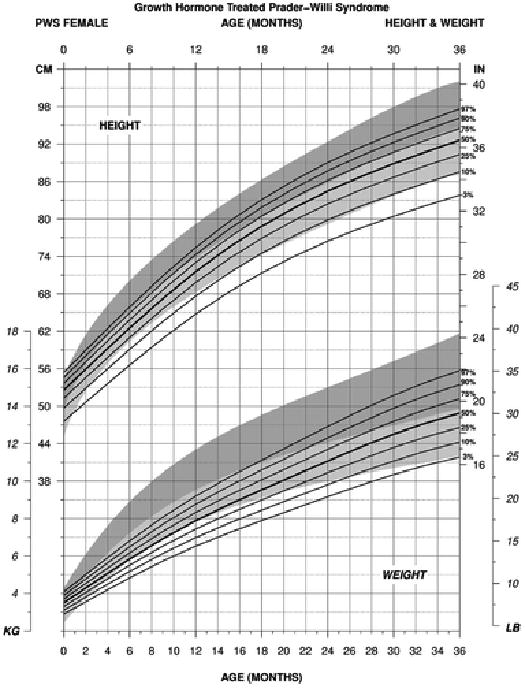
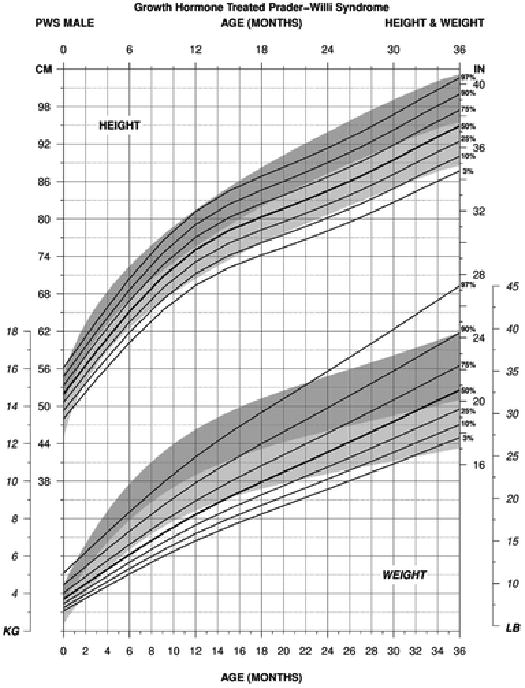
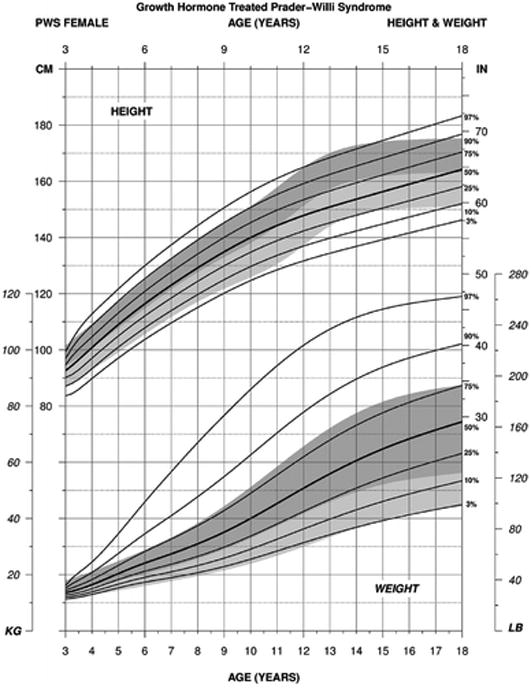
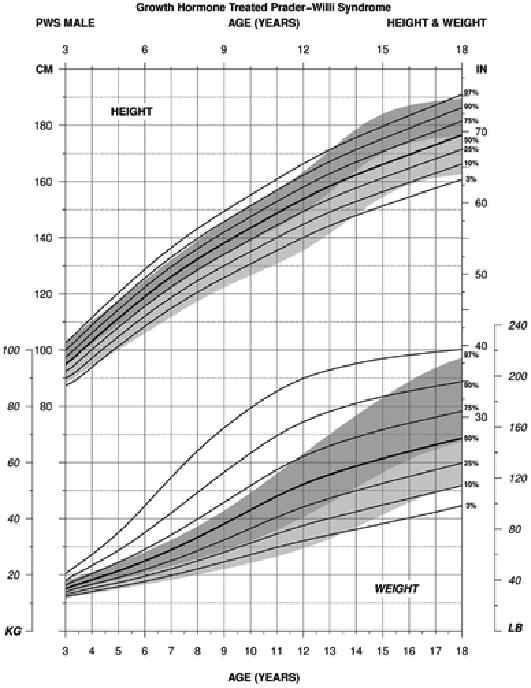
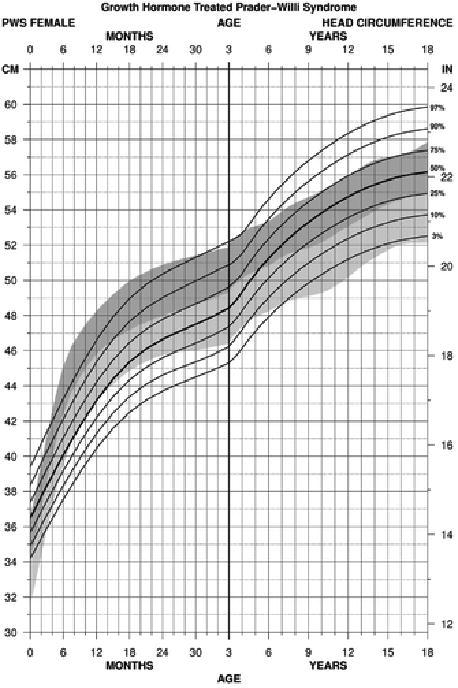
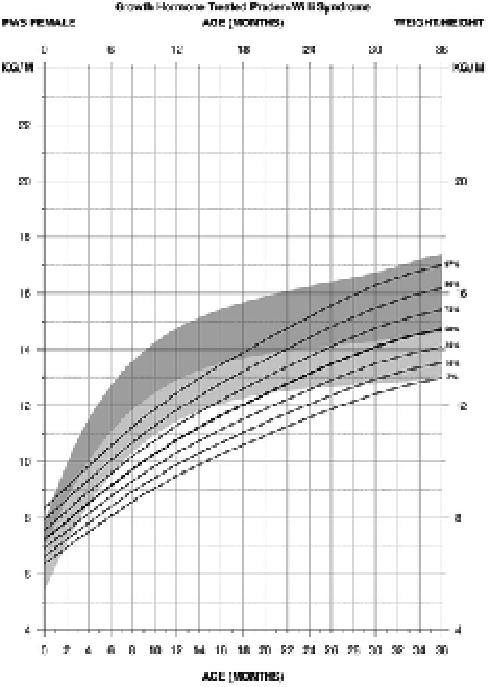
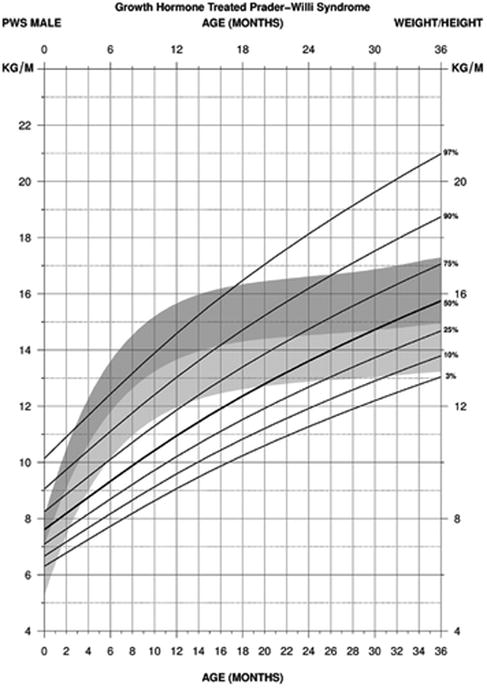
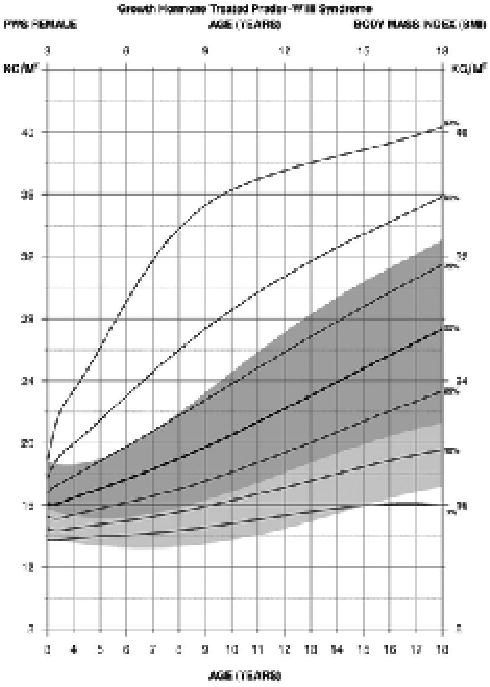
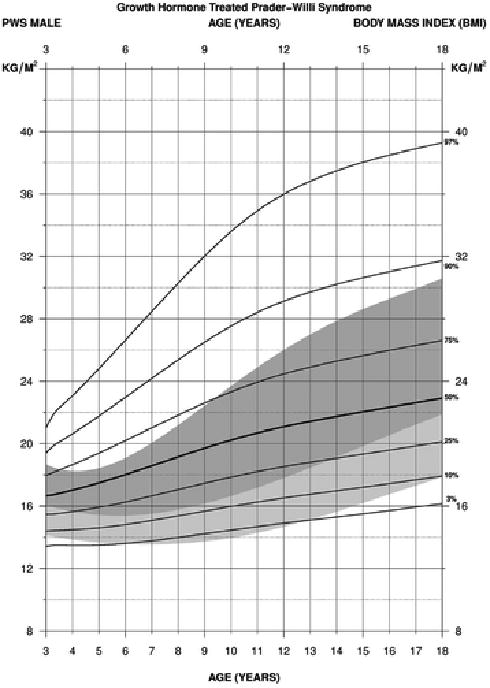
The purpose of the current study was to develop syndrome-specific standardized growth curves for growth hormone-treated Prader-Willi syndrome (PWS) individuals aged 0 to 18 years. Anthropometric growth-related measures were obtained on 171 subjects with PWS who were treated with growth hormone for at least 40% of their lifespan. They had no history of scoliosis. PWS standardized growth curves were developed for 7 percentile ranges using the LMS method for weight, height, head circumference, weight/length, and BMI along with normative 3rd, 50th, and 97th percentiles plotted using control data from the literature and growth databases. Percentiles were plotted on growth charts for comparison purposes. Growth hormone treatment appears to normalize stature and markedly improves weight in PWS compared with standardized curves for non-growth hormone-treated PWS individuals. Growth chart implications and recommended usage are discussed.
Keywords: Prader-Willi syndrome; children; genetic subtype; growth hormone treatment; infants; standardized growth curves.
© The Author(s) 2016.
Conflict of interest statement
Figures

Similar articles
-
Growth charts for non-growth hormone treated Prader-Willi syndrome.Pediatrics. 2015 Jan;135(1):e126-35. doi: 10.1542/peds.2014-1711. Epub 2014 Dec 8. Pediatrics. 2015. PMID: 25489013 Free PMC article.
-
Growth standards of infants with Prader-Willi syndrome.Pediatrics. 2011 Apr;127(4):687-95. doi: 10.1542/peds.2010-2736. Epub 2011 Mar 14. Pediatrics. 2011. PMID: 21402637 Free PMC article.
-
Growth charts for Thai children with Prader-Willi syndrome aged 0-18 years.Orphanet J Rare Dis. 2020 May 6;15(1):111. doi: 10.1186/s13023-020-01388-7. Orphanet J Rare Dis. 2020. PMID: 32375863 Free PMC article.
-
What is the value of growth hormone therapy in Prader Willi syndrome?Arch Dis Child. 2014 Feb;99(2):166-70. doi: 10.1136/archdischild-2013-303760. Epub 2013 Oct 25. Arch Dis Child. 2014. PMID: 24162007 Review.
-
Current and emerging therapies for managing hyperphagia and obesity in Prader-Willi syndrome: A narrative review.Obes Rev. 2020 May;21(5):e12992. doi: 10.1111/obr.12992. Epub 2019 Dec 30. Obes Rev. 2020. PMID: 31889409 Review.
Cited by
-
Prader-Willi Syndrome - Clinical Genetics, Diagnosis and Treatment Approaches: An Update.Curr Pediatr Rev. 2019;15(4):207-244. doi: 10.2174/1573396315666190716120925. Curr Pediatr Rev. 2019. PMID: 31333129 Free PMC article. Review.
-
Prader-Willi Syndrome: The Disease that Opened up Epigenomic-Based Preemptive Medicine.Diseases. 2016 Mar 11;4(1):15. doi: 10.3390/diseases4010015. Diseases. 2016. PMID: 28933395 Free PMC article. Review.
-
Premature adrenarche in Prader-Willi syndrome is associated with accelerated pre-pubertal growth and advanced bone age.J Pediatr Endocrinol Metab. 2022 Dec 5;36(2):185-194. doi: 10.1515/jpem-2022-0468. Print 2023 Feb 23. J Pediatr Endocrinol Metab. 2022. PMID: 36458449 Free PMC article.
-
Early Diagnosis in Prader-Willi Syndrome Reduces Obesity and Associated Co-Morbidities.Genes (Basel). 2019 Nov 6;10(11):898. doi: 10.3390/genes10110898. Genes (Basel). 2019. PMID: 31698873 Free PMC article.
-
Survival trends from the Prader-Willi Syndrome Association (USA) 40-year mortality survey.Genet Med. 2018 Jan;20(1):24-30. doi: 10.1038/gim.2017.92. Epub 2017 Jul 6. Genet Med. 2018. PMID: 28682308 Free PMC article.
References
-
- Prader A, Labhart A, Willi H. Ein Syndrom von Adipositas, Kleinwuchs, Kryptorchismus und Oligophrenie nach Myatonieartigem Zustand im Neugeborenenalter. Schweiz Med Wschr. 1956;86:1260–1261.
-
- Butler MG, Lee PDK, Whitman BY, editors. Management of Prader-Willi Syndrome. 3rd. New York, NY: Springer-Verlag; 2006.
-
- Cassidy SB, Schwartz S, Miller JL, Driscoll DJ. Prader-Willi syndrome. Genet Med. 2012;14:10–26. - PubMed
Publication types
MeSH terms
Substances
Grants and funding
LinkOut - more resources
Full Text Sources
Other Literature Sources
Medical
