. 2016 Feb 4:7:10552.
doi: 10.1038/ncomms10552.

MeCP2 SUMOylation rescues Mecp2-mutant-induced behavioural deficits in a mouse model of Rett syndrome

Affiliations

MeCP2 SUMOylation rescues Mecp2-mutant-induced behavioural deficits in a mouse model of Rett syndrome

Derek J C Tai et al. Nat Commun. .

Abstract

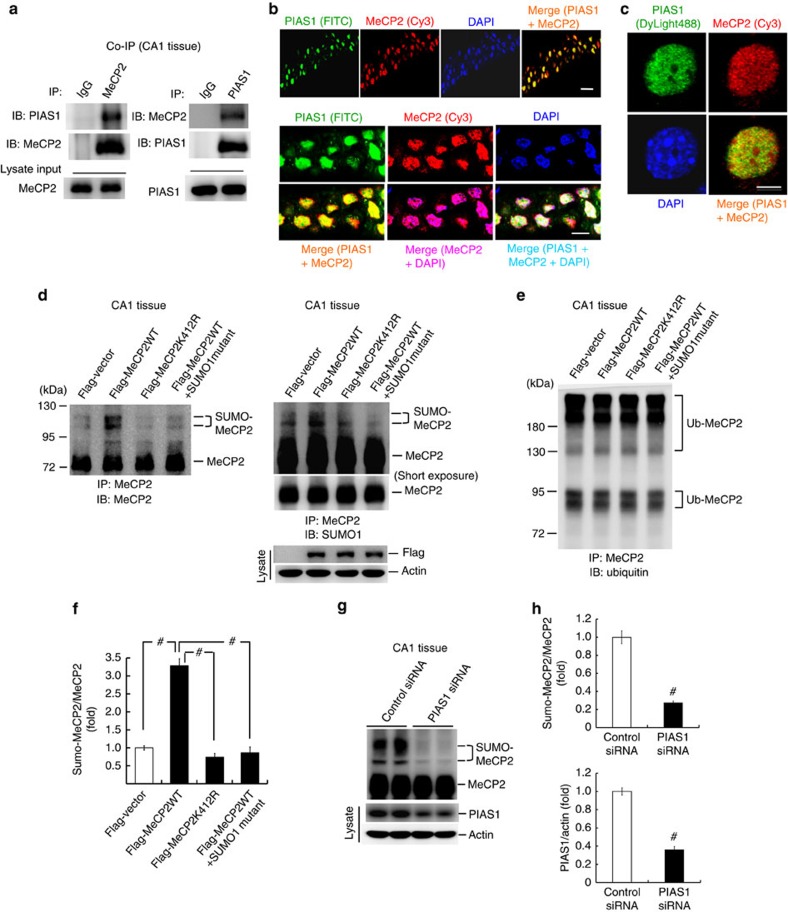
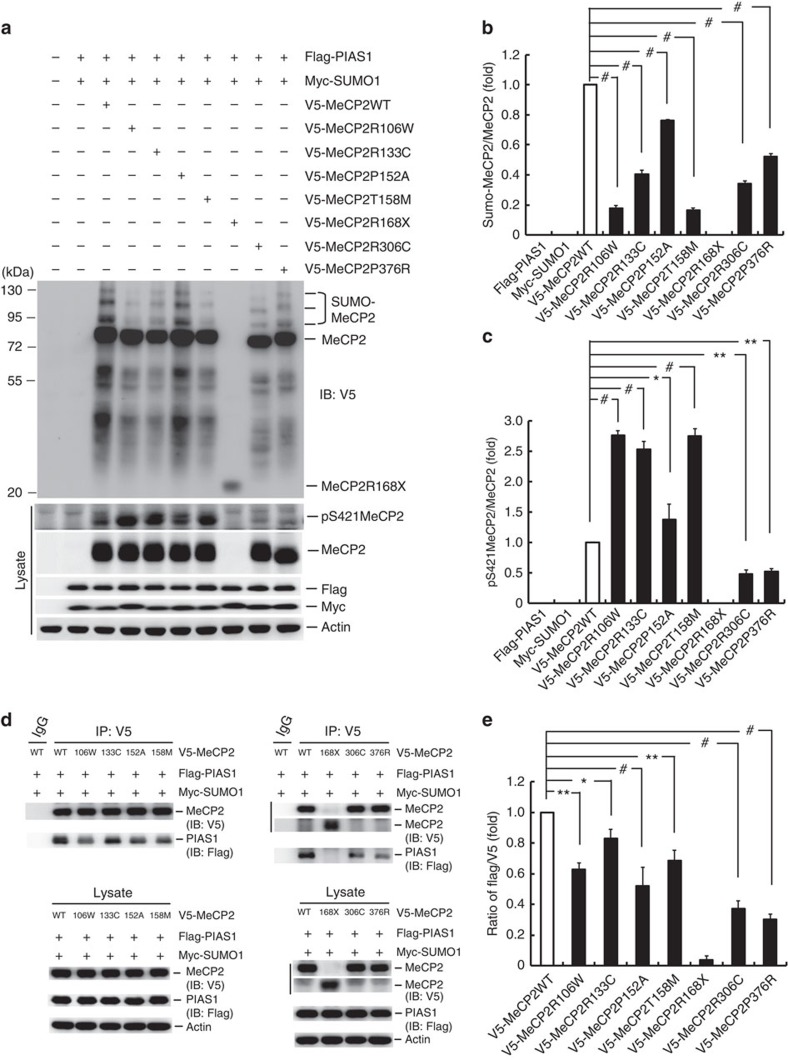
The methyl-CpG-binding protein 2 (MeCP2) gene, MECP2, is an X-linked gene encoding the MeCP2 protein, and mutations of MECP2 cause Rett syndrome (RTT). However, the molecular mechanism of MECP2-mutation-caused RTT is less known. Here we find that MeCP2 could be SUMO-modified by the E3 ligase PIAS1 at Lys-412. MeCP2 phosphorylation (at Ser-421 and Thr-308) facilitates MeCP2 SUMOylation, and MeCP2 SUMOylation is induced by NMDA, IGF-1 and CRF in the rat brain. MeCP2 SUMOylation releases CREB from the repressor complex and enhances Bdnf mRNA expression. Several MECP2 mutations identified in RTT patients show decreased MeCP2 SUMOylation. Re-expression of wild-type MeCP2 or SUMO-modified MeCP2 in Mecp2-null neurons rescues the deficits of social interaction, fear memory and LTP observed in Mecp2 conditional knockout (cKO) mice. These results together reveal an important role of MeCP2 SUMOylation in social interaction, memory and synaptic plasticity, and that abnormal MeCP2 SUMOylation is implicated in RTT.


Figures

Figure 1
Figure 1. Identification of candidate SUMO sites on MeCP2.
(a) In vitro SUMOylation assay showing MeCP2 SUMOylation by PIAS1. Purified GST-E1, His-E2, His-PIAS1, GST-MeCP2 and GST-SENP1 proteins were added to the reaction for this assay. (b) V5-MeCP2 and Myc-SUMO1 plasmids were co-transfected with different amounts of Flag-PIAS1 plasmid to HEK293T cells confirming MeCP2 SUMOylation by PIAS1. (c) SUMO2.0 Software prediction of candidate SUMO acceptors on MeCP2. The ‘K' letter indicated by the arrow represents the candidate SUMO sites. (d) Flag-PIAS1 and Myc-SUMO1 (or Myc-SUMO1ΔGG) plasmids were co-transfected with V5-MeCP2WT or different V5-MeCP2 lysine mutant plasmids to HEK293T cells. MeCP2 SUMOylation was examined by immunoblotting using anti-V5 antibody. The quantified result is shown in the lower panel (n=2 each group; F9,10=240.59, #P<0.001; q=12.73, #P<0.001 comparing lane 3 versus lane 9; q=21.1, #P<0.001 comparing lane 3 versus lane 10; q=8.37, **P<0.01 comparing lane 9 versus lane 10, one-way ANOVA followed by Newman–Keul post hoc multiple comparisons). (e) V5-MeCP2 or V5-MeCP2K412R plasmid was co-transfected with Myc-SUMO1 and Flag-PIAS1 plasmids to HEK293T cells. The cell lysate was immunoprecipitated with anit-Myc antibody and immunoblotted with anti-V5 antibody for confirmation of MeCP2 SUMOylation at Lys-412. The arrow indicates MeCP2 SUMOylation at Lys-412. All experiments are in two repeats. Data are expressed as mean±s.e.m.
Figure 2
Figure 2. MeCP2 is associated with PIAS1 and can be sumoylated by PIAS1 at Lys-412 in rat hippocampus.
(a) Co-IP experiment showing PIAS1 association with MeCP2 and vice versa in rat CA1 area. Experiments are in two repeats. (b) Immunohistochemistry showing PIAS1 and MeCP2 are both present in the nucleus of the same neurons in the CA1 area of the rat brain. N=3. Scale bar, 25 μm for the upper panel and scale bar, 10 μm for the lower panel. (c) Immunocytochemistry showing PIAS1 and MeCP2 are colocalized in the nucleus of the same neuron from rat hippocampal culture. Scale bar, 5 μm. Experiments are in two repeats. (d) Flag-vector, Flag-MeCP2WT (with or without the addition of SUMO1-mutant protein) and Flag-MeCP2K412R plasmids were transfected to rat CA1 area, and in vitro SUMOylation assay was carried out 48 h later to determine MeCP2 SUMOylation at Lys-412 in the hippocampus. Left panel: immunoblotted with anti-MeCP2 antibody. Right panel: immunoblotted with anti-SUMO1 antibody. Plasmid transfection and expression was confirmed with western blot analysis using anti-Flag antibody. The quantified result is shown in f (n=4 each group; F3,12=76.75, #P<0.001; q=16.5, #P<0.001 comparing the Flag-MeCP2WT group with Flag-vector group; q=18.39, #P<0.001 comparing the Flag-MeCP2K412R group with Flag-MeCP2WT group; q=17.47, #P<0.001 comparing the Flag-MeCP2WT+SUMO1-mutant group with Flag-MeCP2WT group, one-way ANOVA followed by post hoc Newman–Keuls multiple comparisons). (e) Cell lysates from the same plasmid transfections as described in d were immunoprecipitated with anti-MeCP2 antibody and immunoblotted with anti-ubiquitin antibody. Ub-MeCP2: ubiquitinated MeCP2. (g) Control siRNA or PIAS1 siRNA (8 pmol) was transfected to the CA1 area in the rat brain and endogenous MeCP2 SUMOylation was determined using in vitro SUMOylation assay. (h) The quantified result of MeCP2 SUMOylation is shown in the upper panel (n=6 each group; t1,10=9.65, #P<0.001, Student's t-test). The level of PIAS1 expression after PIAS1 siRNA transfection was determined by western blot analysis, and the quantified result is shown in the lower panel (n=6 each group; t1,10=11.38, #P<0.001, Student's t-test). Data are expressed as mean±s.e.m.
Figure 3
Figure 3. MeCP2 phosphorylation facilitates MeCP2 SUMOylation and MeCP2 SUMOylation is induced by NMDA and IGF-1 and by CRF treatments in the hippocampus.
(a) Flag-vector, Flag-MeCP2WT, Flag-MeCP2S421A or Flag-MeCP2T308A plasmid was transfected to rat CA1 area, and MeCP2 SUMOylation was determined by in vitro SUMOylation assay and quantified (n=4 each group; F3,12=40.85, #P<0.001; q=12.02, #P<0.001, Flag-MeCP2WT group versus Flag-vector group; q=12.1, #P<0.001, Flag-MeCP2S421A group versus Flag-MeCP2WT group; q=13.88, #P<0.001, Flag-MeCP2T308A group versus Flag-MeCP2WT group). (b) The same plasmids were transfected to rat CA1 area as described above. NMDA (2 μg μl−1) was administered 47 h after plasmid transfection. An additional group with Flag-vector transfection+PBS injection served as the control group. MeCP2 SUMOylation was determined by in vitro SUMOylation assay, and MeCP2 phosphorylation at Ser-421 was determined by western blot analysis using anti-phospho-Ser421MeCP2 antibody 1 h after NMDA injection (for MeCP2 SUMOylation, n=4 each group; F4,15=74.65, #P<0.001; q=12.7, #P<0.001, Flag-vector+NMDA group versus Flag-vector+PBS group; q=4.65, **P<0.01, Flag-MeCP2WT+NMDA group versus Flag-vector+NMDA group; q=12.15, #P<0.001, Flag-MeCP2S421A+NMDA group versus Flag-vector+NMDA group; q=14.42, #P<0.001, Flag-MeCP2T308A+NMDA group versus Flag-vector+NMDA group. For MeCP2 phosphorylation at Ser-421, n=4 each group; F4,15=23.65, #P<0.001; q=5.97, **P<0.01 comparing the Flag-vector+NMDA group with Flag-vector+PBS group; q=4.59, **P<0.01, Flag-MeCP2WT+NMDA group versus Flag-vector+NMDA group; q=8.17, #P<0.001, Flag-MeCP2S421A+NMDA group versus Flag-MeCP2WT+NMDA group; q=3.58, *P<0.05, Flag-MeCP2S421A+NMDA group versus Flag-vector+NMDA group). ns: non-significant. (c) PBS or IGF-1 (100 ng ml−1) was injected to rat CA1 area, and MeCP2 SUMOylation was determined 1 h later. Left panel: immunoblotted with anti-MeCP2 antibody. Right panel: immunoblotted with anti-SUMO1 antibody (n=6 each group; t1,10=15.9, #P<0.001). (d) PBS or CRF (100 ng μl−1) was injected to rat CA1 area, and MeCP2 SUMOylation was determined 1 h later (n=6 each group; t1,10=10.91, #P<0.001). (e) DMSO or dexamethasone (Dex, 30 ng μl−1) was injected to rat CA1 area and MeCP2 SUMOylation was determined 1 h later (n=6 each group; t1,10=0.57, P>0.05). One-way ANOVA followed by post hoc Newman–Keuls multiple comparisons (a,b) or Student's t-test (ce). Data are expressed as mean±s.e.m.
Figure 4
Figure 4. SUMOylation of MeCP2 decreases its interaction with CREB and increases CREB DNA binding and Bdnf gene expression and methyl-DNA binding.
(a) Flag-vector, Flag-MeCP2WT, Flag-MeCP2K412R or Flag-MeCP2WT-SUMO1 fusion plasmid was transfected to rat CA1 area, and the association between MeCP2 and CREB was examined by co-IP using anti-Flag and anti-CREB antibodies. Plasmid transfection and expression was confirmed with western blot analysis using anti-Flag antibody (left panel). Cell lysates were also immunoprecipitated with anti-MeCP2 antibody and immunoblotted with anti-SUMO1 antibody showing the specific band of sumoylated MeCP2 (middle panel). The quantified result of co-IP is shown in the right panel (n=3 each group; F3,8=72.69, #P<0.001; q=11.99, #P<0.001, Flag-MeCP2K412R group versus Flag-MeCP2WT group; q=4.31, *P<0.05, Flag-MeCP2WT-SUMO1 group versus Flag-MeCP2WT group. (b) The same plasmids were transfected to the rat CA1 area, and CREB DNA-binding activity was determined using oligo pull-down assay. CREB expression was determined with western blot analysis. Plasmid transfection and expression was confirmed with western blot analysis using anti-Flag antibody (n=7 each group; F3,24=52.07, #P<0.001; q=3.26, *P<0.05, Flag-MeCP2WT group versus Flag-vector group; q=8.94, #P<0.001, Flag-MeCP2K412R group versus Flag-vector group; q=8.2, #P<0.001, Flag-MeCP2WT-SUMO1 group versus Flag-vector group; q=12.21, #P<0.001, Flag-MeCP2K412R group versus Flag-MeCP2WT group; q=4.93, *P<0.05, Flag-MeCP2WT-SUMO1 group versus Flag-MeCP2WT group; q=17.14, #P<0.001, Flag-MeCP2WT-SUMO1 group versus Flag-MeCP2K412R group). (c) The same plasmids were transfected to the rat CA1 area, and the Bdnf mRNA level was determined with RT–qPCR and quantified over the Gapdh mRNA level (n=6 each group; F3,20=38.45, #P<0.001; q=7.26, #P<0.001, Flag-MeCP2K412R group versus Flag-vector group; q=7.56, #P<0.001, Flag-MeCP2WT-SUMO1 group versus Flag-vector group. (d) The same plasmids were transfected to the rat CA1 area, and direct CREB binding to the Bdnf promoter was determined using chromatin IP assay. Plasmid transfection and expression was confirmed with western blot analysis using anti-Flag antibody. (e) V5-MeCP2T158M, V5-MeCP2WT alone or together with the Flag-PIAS1 and Myc-SUMO1 plasmids were co-transfected to HEK293T cells and cell lysates were subjected to methyl-DNA-binding assay and in vitro SUMOylation assay (n=3 each group; F3,8=230.02, #P<0.001; q=11.53, #P<0.001, V5-MeCP2T158M group versus V5-MeCP2WT group; q=15.75, #P<0.001, Flag-PIAS1+Myc-SUMO1+V5-MeCP2WT group versus V5-MeCP2WT group). One-way ANOVA followed by post hoc Newman–Keuls multiple comparisons. Data are expressed as mean±s.e.m.
Figure 5
Figure 5. Several MECP2 mutations identified in RTT patients show a decreased level of MeCP2 SUMOylation and decreased interaction with PIAS1.
(a) V5-MeCP2WT plasmid or different V5-MeCP2-mutant plasmids associated with RTT were co-transfected with Flag-PIAS1 and Myc-SUMO1 plasmids to HEK293T cells and cell lysates were subjected to in vitro SUMOylation assay. The level of MeCP2 phosphorylation at Ser-421 was examined using the phospho-Ser-421 MeCP2 antibody. The lower band in lane 8 indicates the truncated MeCP2R168X protein. (b) The quantified result of MeCP2 SUMOylation is shown (n=4 each group; F9,30=579.1, #P<0.001; q=57.8, #P<0.001, V5-MeCP2R106W group versus V5-MeCP2WT group; q=41.81, #P<0.001, V5-MeCP2R133C group versus V5-MeCP2WT group; q=16.69, #P<0.001, V5-MeCP2P152A group versus V5-MeCP2WT group; q=58.68, #P<0.001, V5-MeCP2T158M group versus V5-MeCP2WT group; q=46.2, #P<0.001, V5-MeCP2R306C group versus V5-MeCP2WT group; q=33.56, #P<0.001, V5-MeCP2P376R group versus V5-MeCP2WT group, one-way ANOVA followed by post hoc Newman–Keuls multiple comparisons). (c) The quantified result of MeCP2 phosphorylation at Ser-421 is shown (n=3 each group; F9,20=119.55, #P<0.001; q=16.73, #P<0.001, V5-MeCP2R106W group versus V5-MeCP2WT group; q=14.48, #P<0.001, V5-MeCP2R133C group versus V5-MeCP2WT group; q=3.54, *P<0.05, V5-MeCP2P152A group versus V5-MeCP2WT group; q=16.63, #P<0.001, V5-MeCP2T158M group versus V5-MeCP2WT group; q=4.97, **P<0.01, V5-MeCP2R306C group versus V5-MeCP2WT group; q=4.52, **P<0.01, V5-MeCP2P376R group versus V5-MeCP2WT group, one-way ANOVA followed by post hoc Newman–Keuls multiple comparisons). (d) V5-MeCP2WT plasmid or V5-tagged individual MeCP2-mutant plasmid was transfected to HEK293T cells, and co-IP experiments were carried out with immunoprecipitation using anti-V5 antibody and immunoblotting using anti-Flag antibody. The expression level of MeCP2 (WT or mutant proteins) was examined with western blot analysis using anti-V5 antibody. (e) The quantified result of the association between PIAS1 and MeCP2 (or MeCP2-mutant proteins) is shown (n=3 each group; F7,16=27.47, #P<0.001; q=5.85, **P<0.01, V5-MeCP2R106W group versus V5-MeCP2WT group; q=3.01, *P=0.05, V5-MeCP2R133C group versus V5-MeCP2WT group; q=8.46, #P<0.001, V5-MeCP2P152A group versus V5-MeCP2WT group; q=5.60, **P<0.01, V5-MeCP2T158M group versus V5-MeCP2WT group; q=11.09, #P<0.001, V5-MeCP2R306C group versus V5-MeCP2WT group; q=10.88, #P<0.001, V5-MeCP2P376R group versus V5-MeCP2WT group, one-way ANOVA followed by post hoc Newman–Keuls multiple comparisons). Data are expressed as mean±s.e.m.
Figure 6
Figure 6. SUMOylation of MeCP2 rescues Mecp2 cKO mice-induced behavioural and LTP deficits.
Mecp2 loxp and Mecp2 cKO mice transducted with different MeCP2 lenti-mRFP vectors in their BLA area were subject to (a) motor activity test, (b) social ability test and (c) social novelty test 7–10 days later (n=10–11 each group; F4,47=19.87, #P<0.001 for sniffing to right stranger 2; q=8.55, Mecp2 cKO+lenti-mRFP-vector group versus Mecp2 loxp+lenti-mRFP-vector group; q=7.85, Mecp2 cKO+lenti-mRFP-MeCP2WT group versus Mecp2 cKO+lenti-mRFP-vector group; q=6.56, Mecp2 cKO+lenti-mRFP-MeCP2K412R group versus Mecp2 cKO+lenti-mRFP-MeCP2WT group; q=8.29, Mecp2 cKO+lenti-mRFP-MeCP2WT-SUMO1 group versus Mecp2 cKO+lenti-mRFP-MeCP2K412R group). (d) The same mice were subjected to cued fear-conditioning learning 7 days later (F4,47=37.17, #P<0.001; q=10.77, Mecp2 cKO+lenti-mRFP-vector group versus Mecp2 loxp+lenti-mRFP-vector group; q=5.27, Mecp2 cKO+lenti-mRFP-MeCP2K412R group versus Mecp2 loxp+lenti-mRFP-vector group; q=5.75, Mecp2 cKO+lenti-mRFP-MeCP2K412R group versus Mecp2 cKO+lenti-mRFP-vector group; q=4.07, Mecp2 cKO+lenti-mRFP-MeCP2WT-SUMO1 group versus Mecp2 loxp+lenti-mRFP-vector group). (e) The BLA tissues from Mecp2 loxp+lenti-mRFP-vector and Mecp2 cKO+lenti-mRFP-vector groups of mice were subjected to western blot analysis of MeCP2 expression (t1,18=20.99, #P<0.001). (f) The BLA tissue of mice from Mecp2 cKO+lenti-mRFP vector, Mecp2 cKO+lenti-mRFP-MeCP2WT and Mecp2 cKO+lenti-mRFP-MeCP2K412R groups were subjected to western blot analysis of MeCP2 expression and MeCP2 phosphorylation at Ser-421 (for MeCP2 expression, F2,28=241.64, #P<0.001; q=27.46, Mecp2 cKO+lenti-mRFP-MeCP2WT group versus Mecp2 loxp+lenti-mRFP-vector group; q=26.58, Mecp2 cKO+lenti-mRFP-MeCP2K412R group versus Mecp2 loxp+lenti-mRFP-vector group. For pS421MeCP2, F2,28=3.72, *P<0.05; q=3.59, Mecp2 cKO+lenti-mRFP-MeCP2WT group versus Mecp2 loxp+lenti-mRFP-vector group; q=3.04, Mecp2 cKO+lenti-mRFP-MeCP2K412R group versus Mecp2 loxp+lenti-mRFP-vector group). (g) Aged female Mecp2 cKO mice transducted with different MeCP2 lenti-mRFP vectors in their CA1 area were subjected to LTP recording 7 days later under HFS paradigm. The Mecp2 loxp mice received lenti-mRFP vector transduction (n=5 each group; F3,16=14.36, #P<0.001; q=6.3, Mecp2 cKO group versus Mecp2 loxp group; q=8.45, Mecp2 cKO+MeCP2WT group versus Mecp2 cKO group; q=3.31, Mecp2 cKO+MeCP2K412R group versus Mecp2 cKO group for the first 10-min recording. (h) The same groups of mice were subjected to LTP recording under TBS paradigm (n=5 each group; F3,16=14.65, #P<0.001; q=7.08, Mecp2 cKO group versus Mecp2 loxp group; q=8.05, Mecp2 cKO+MeCP2WT group versus Mecp2 cKO group; q=4.69, Mecp2 cKO+MeCP2K412R group versus Mecp2 cKO group for the first 10-min recording). Arrow indicates delivery of HFS or TBS. One-way or two-way ANOVA and Newman–Keuls statistics. *P<0.05 and #P<0.001. Data are expressed as mean±s.e.m.
Figure 7
Figure 7. An illustration showing the relationship among MeCP2 SUMOylation, its association with CREB and other proteins in the repressor complex, CREB DNA binding to the Bdnf gene promoter and Bdnf gene expression.
(a) Under physiological condition, MeCP2 binds to the methylated DNA and is associated with Sin3a, HDAC1 and CREB to form a repressor complex that suppresses CREB binding to the CRE element and inhibits Bdnf gene expression. (b) On stimulation, MeCP2 phosphorylation (at Thr-308 and Ser-421)-dependent MeCP2 SUMOylation takes place that enhances MeCP2 binding to methylated DNA, dissociates CREB from the repressor complex, which allows more CREB, in association with CBP, to bind to the CRE element on DNA promoter and increases Bdnf gene expression.

Similar articles

Cited by

References

    1. Amir R. E. et al. Rett syndrome is caused by mutations in X-linked MECP2, encoding methyl-CpG-binding protein 2. Nat. Genet. 23, 185–188 (1999). - PubMed
    1. Clouaire T. & Stancheva I. Methyl-CpG binding proteins: specialized transcriptional repressors or structural components of chromatin? Cell Mol. Life Sci. 65, 1509–1522 (2008). - PMC - PubMed
    1. Nan X. et al. Transcriptional repression by the methyl-CpG-binding protein MeCP2 involves a histone deacetylase complex. Nature 393, 386–389 (1998). - PubMed
    1. Jones P. L. et al. Methylated DNA and MeCP2 recruit histone deacetylase to repress transcription. Nat. Genet. 19, 187–191 (1998). - PubMed
    1. Chahrour M. et al. MeCP2, a key contributor to neurological disease, activates and represses transcription. Science 320, 1224–1229 (2008). - PMC - PubMed

Publication types

MeSH terms

Substances