. 2016 Mar;26(3):385-96.
doi: 10.1101/gr.197590.115. Epub 2016 Feb 3.

Models of human core transcriptional regulatory circuitries

Affiliations

Models of human core transcriptional regulatory circuitries

Violaine Saint-André et al. Genome Res. 2016 Mar.

Abstract

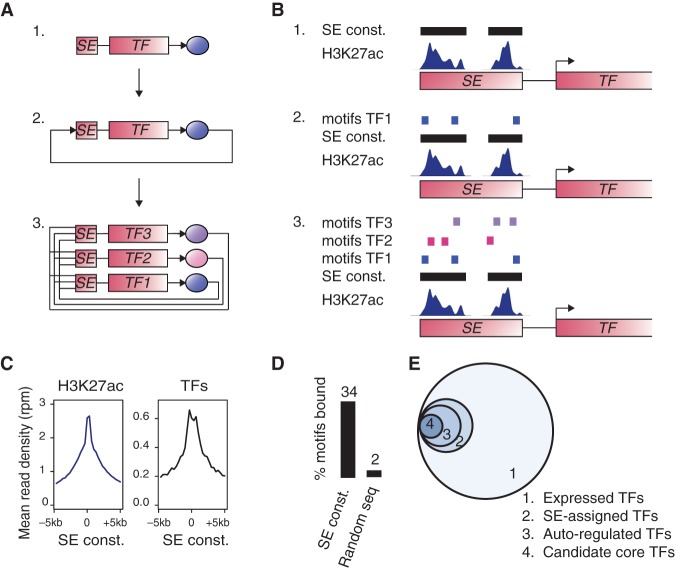
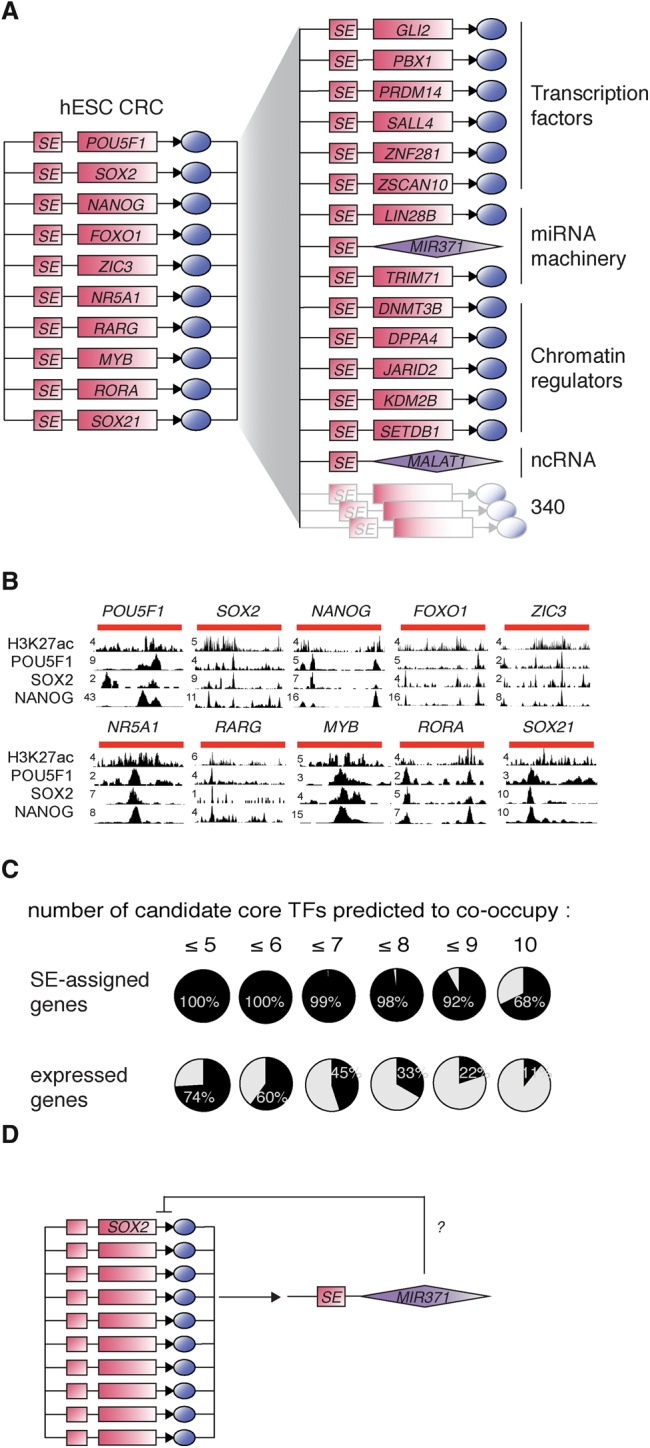
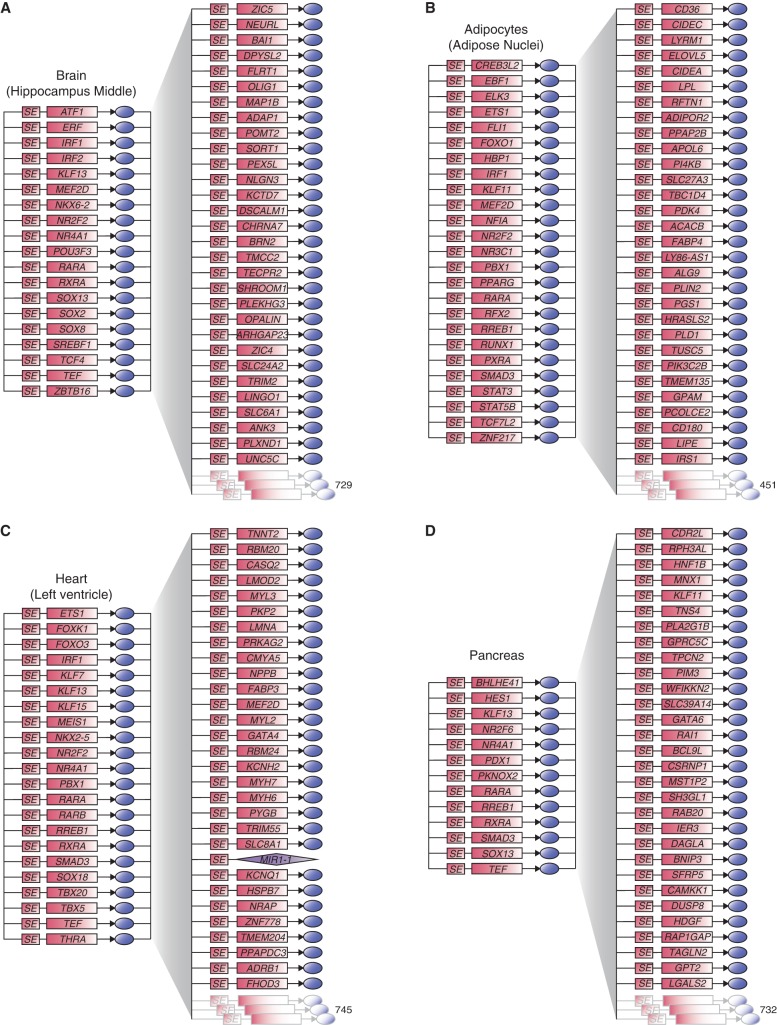
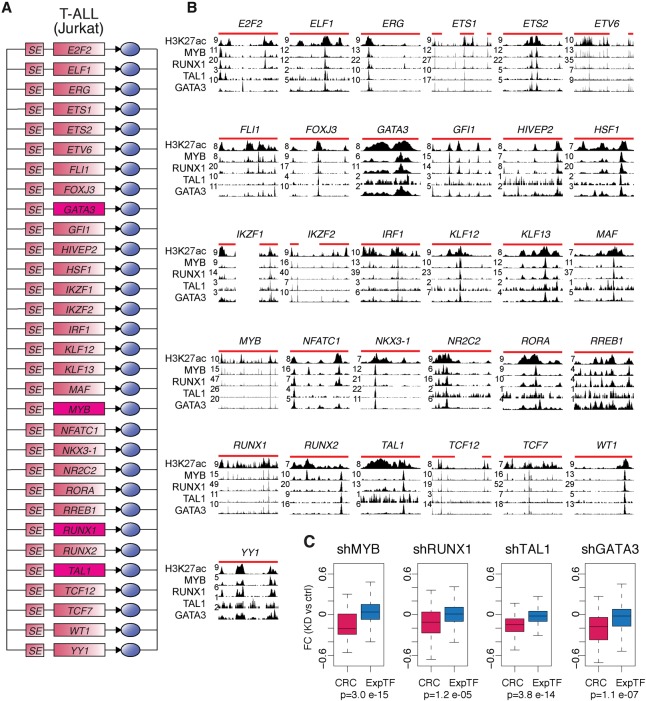
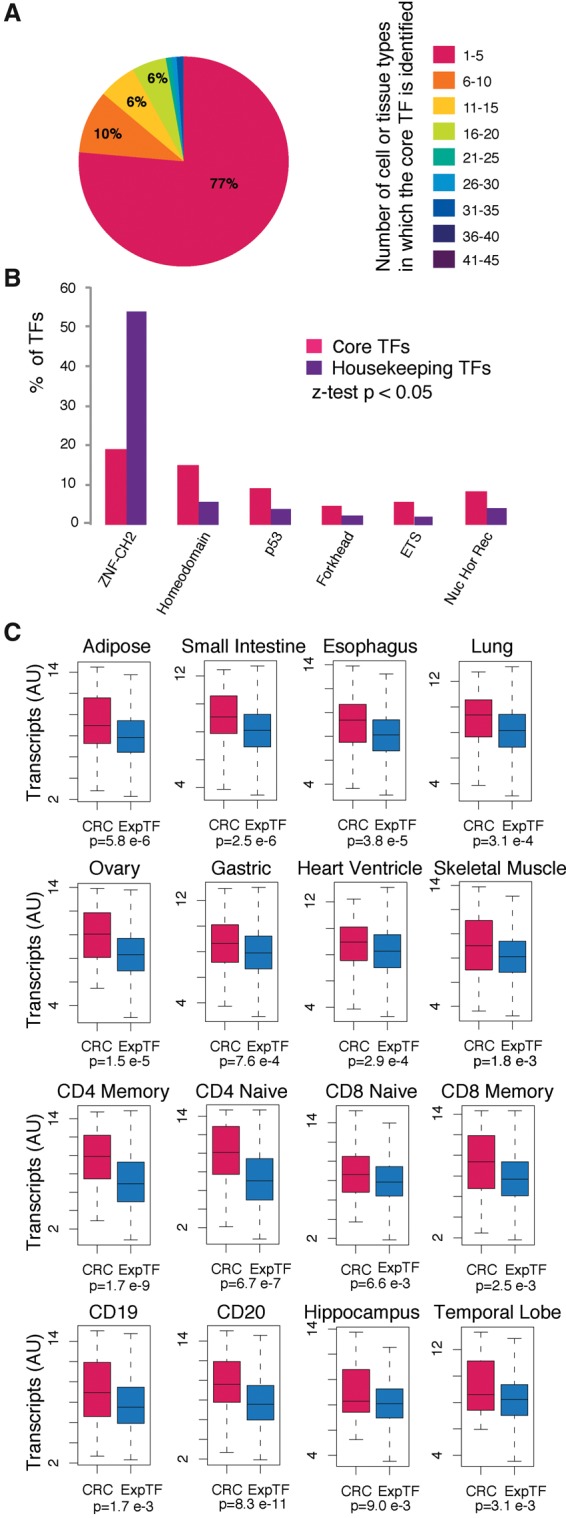
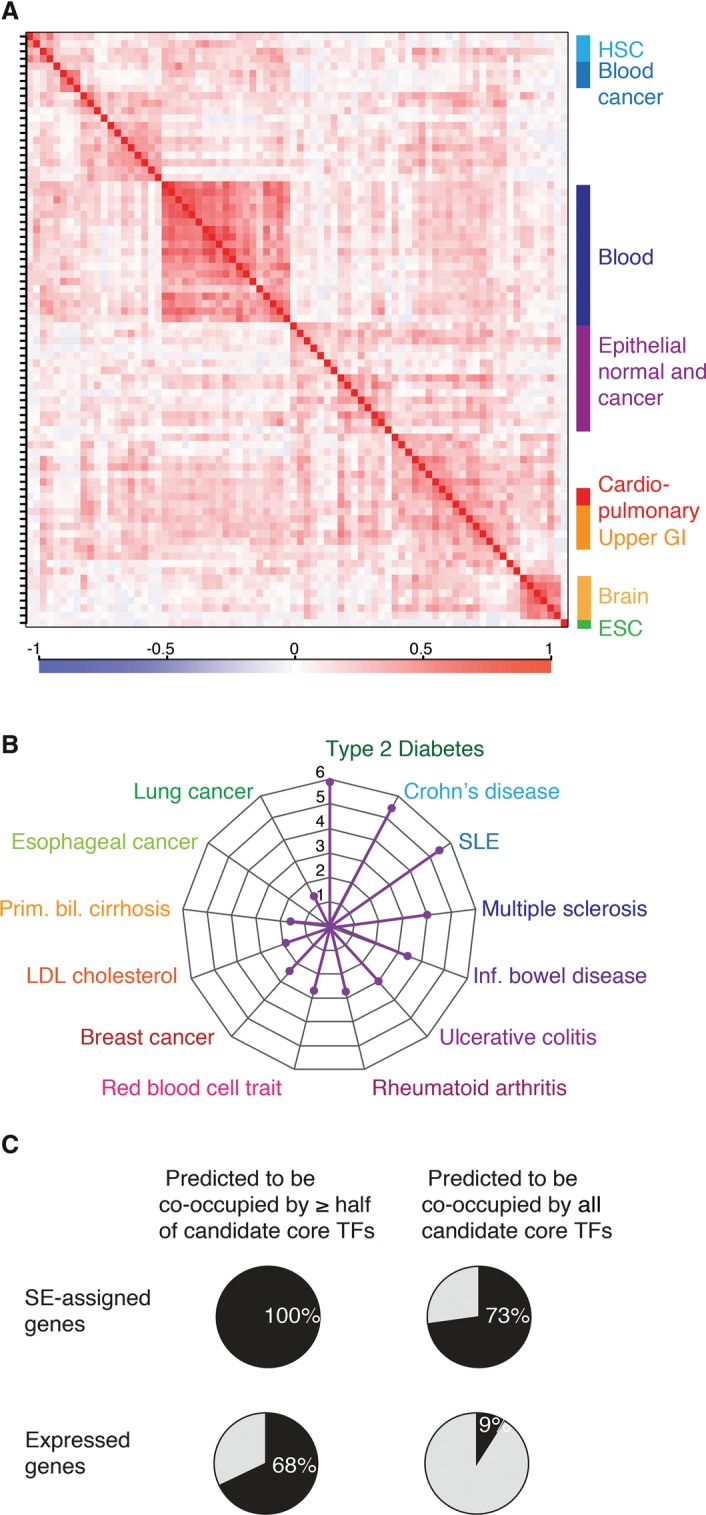
A small set of core transcription factors (TFs) dominates control of the gene expression program in embryonic stem cells and other well-studied cellular models. These core TFs collectively regulate their own gene expression, thus forming an interconnected auto-regulatory loop that can be considered the core transcriptional regulatory circuitry (CRC) for that cell type. There is limited knowledge of core TFs, and thus models of core regulatory circuitry, for most cell types. We recently discovered that genes encoding known core TFs forming CRCs are driven by super-enhancers, which provides an opportunity to systematically predict CRCs in poorly studied cell types through super-enhancer mapping. Here, we use super-enhancer maps to generate CRC models for 75 human cell and tissue types. These core circuitry models should prove valuable for further investigating cell-type-specific transcriptional regulation in healthy and diseased cells.


Figures

Figure 1.
Figure 1.
A method to build core regulatory circuitry. (A) Graphical description of the method used to create core regulatory circuitry (CRC) models. 1. Identification of SE-assigned expressed TFs. 2. Identification of the TFs that are predicted to bind their own SE, considered as auto-regulated. 3. CRCs are assembled as fully interconnected loops of auto-regulated TFs. (B) Cartoon showing: 1. TF-assigned SE constituents defined by H3K27ac ChIP-seq peak signals; 2. TFs having at least three DNA-binding sequence motif instances in their SE constituents are considered auto-regulated; 3. TFs with SEs having at least three DNA-binding sequence motif instances for each of the other predicted auto-regulated TFs together form an interconnected auto-regulatory loop. (C) Metagenes for the ChIP-seq signal for H3K27ac (left) and for the average ChIP-seq signal for POU5F1, SOX2, and NANOG (right) in H1 hESCs in the region ±5 kb around the center of the SE constituents. (D) Average percentage of DNA-binding motifs that are actually bound by the TFs from ChIP-seq data for POU5F1, SOX2, and NANOG in H1 hESCs, in either SE constituents or sets of random genomic sequences of the same size. (E) Venn diagram showing the average numbers, across 84 samples, of: 1. TFs having motifs that are expressed (445 TFs); 2. TFs having motifs that are expressed and assigned to a SE (61 TFs); 3. TFs having motifs that are expressed and assigned to a SE and that are predicted to bind their own SE (39 TFs); 4. TFs that are part of the CRC model (15 TFs).
Figure 2.
Figure 2.
H1 ESC core and extended regulatory circuitry. (A) (Left) CRC model for H1 human embryonic stem cells. The role of each TF in ESC pluripotency and self-renewal is listed in Table 1. (Right) H1 hESC extended regulatory circuit. Examples of SE-assigned genes that are predicted to be bound by each of the TFs in the CRC. The role of these factors in ESC pluripotency and self-renewal is listed in Supplemental Table S5. (B) ChIP-seq data for H3K27ac, POU5F1, SOX2, and NANOG showing binding of the TFs to each of the SEs of the SE-assigned TFs in the hESC CRC. SE genomic locations are depicted by red lines on top of the tracks. (C) Pie charts showing the percentages of SE-assigned genes (top row) or all expressed genes (bottom row) whose regulatory sequences are predicted to be bound by increasing numbers of hESC candidate core TFs. (D) Diagram showing putative transcriptional regulation of miR-371a on SOX2 expression in hESCs.
Figure 3.
Figure 3.
Core and extended regulatory circuitry for multiple cells and tissue types. Core and extended circuitry for (A) brain (hippocampus middle), (B) adipocytes (adipose nuclei), (C) heart (left ventricle), and (D) pancreas. The number of SE-assigned genes predicted to be co-occupied by each of the candidate core TFs and 30 examples of those are displayed on the right part of the maps.
Figure 4.
Figure 4.
Experimental validation for T-ALL Jurkat cell circuitry. (A) Core regulatory circuit containing GATA3, MYB, RUNX1, and TAL1 for T-ALL Jurkat cells. (B) ChIP-seq data for H3K27ac, MYB, RUNX1, TAL1, and GATA3 showing binding of the TF to each of the SEs in the T-ALL Jurkat cell core circuit. SE genomic locations are depicted by red lines on top of the tracks. (C) Boxplots showing fold change (FC) in expression for Jurkat cells transfected with the indicated shRNAs vs. control shRNAs, for either the set of candidate core TFs displayed in A (red) or the full set of TFs considered expressed in Jurkat cells (blue). P-values quantifying the difference between the two sets were calculated using a Wilcoxon test.
Figure 5.
Figure 5.
Features of candidate core TFs. (A) Percentages of TFs identified as candidate core TFs in a given number of cell or tissue types. The number of cell or tissue types in which a TF is identified as a candidate core TF is displayed with boxes on the right. A representative sample of each cell and tissue type is used when multiple samples from the same cell or tissue type are present in the data set. (B) DNA-binding domains that are significantly differentially represented in the set of candidate core TFs and housekeeping TFs. (C) Transcript levels for the set of candidate core TFs and for the full set of TFs considered expressed in each sample. P-values quantifying the difference between the two sets were calculated using a Wilcoxon test.
Figure 6.
Figure 6.
Properties of CRCs of multiple human cell and tissue types. (A) CRCs cluster according to cell type similarity. Hierarchical clustering of candidate core TFs for 80 human samples. The matrix of correlation based on Pearson coefficients identifies specific clusters for hematopoietic stem cells (HSC), blood cancer cells, blood cells, epithelial normal and cancer cells, cardio-pulmonary system cells, upper gastrointestinal system, and brain cells. Correlation values range from −1 to 1 and are colored from blue to red according to the color scale. (B) Radar plot showing the enrichment of candidate core TFs, compared to noncore TFs, in GWAS list of genes for multiple diseases or traits. P-values were calculated using a z-test, and 1/P-values are plotted for the diseases or traits that showed an enrichment P-value <5 × 10⁻² of candidate core TFs. (C) Pie charts showing the average percentages for all samples of SE-assigned genes (top row) or of all expressed genes (bottom row) whose regulatory sequences are predicted to be co-occupied by more than half or by all the TFs in the CRC.

References

    1. Adelman K, Lis JT. 2012. Promoter-proximal pausing of RNA polymerase II: emerging roles in metazoans. Nat Rev Genet 13: 720–731. - PMC - PubMed
    1. Alon U. 2007. Network motifs: theory and experimental approaches. Nat Rev Genet 8: 450–461. - PubMed
    1. Avilion AA, Nicolis SK, Pevny LH, Perez L, Vivian N, Lovell-Badge R. 2003. Multipotent cell lineages in early mouse development depend on SOX2 function. Genes Dev 17: 126–140. - PMC - PubMed
    1. Bar-Joseph Z, Gerber GK, Lee TI, Rinaldi NJ, Yoo JY, Robert F, Gordon DB, Fraenkel E, Jaakkola TS, Young RA, et al. 2003. Computational discovery of gene modules and regulatory networks. Nat Biotechnol 21: 1337–1342. - PubMed
    1. Barnea E, Bergman Y. 2000. Synergy of SF1 and RAR in activation of Oct-3/4 promoter. J Biol Chem 275: 6608–6619. - PubMed

Publication types

Substances