. 2016 Jun;32(6):921-34.
doi: 10.1007/s10554-016-0848-6. Epub 2016 Feb 2.

Adaptive anisotropic gaussian filtering to reduce acquisition time in cardiac diffusion tensor imaging

Affiliations

Adaptive anisotropic gaussian filtering to reduce acquisition time in cardiac diffusion tensor imaging

Ria Mazumder et al. Int J Cardiovasc Imaging. 2016 Jun.

Abstract

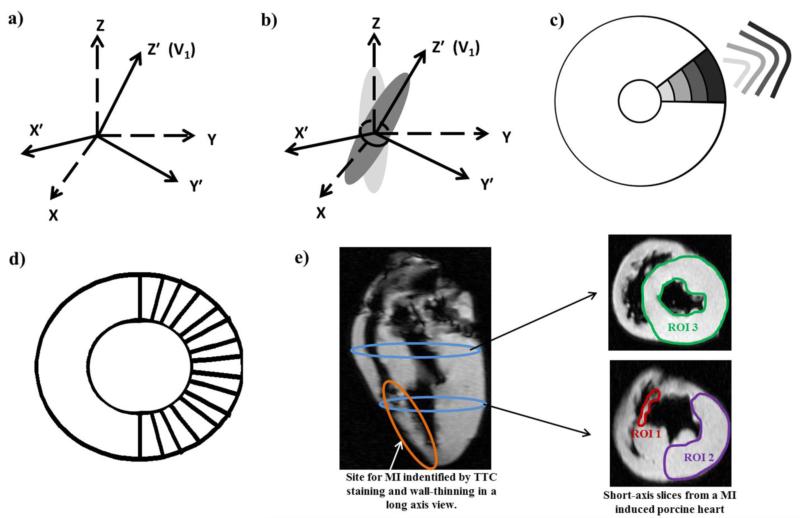
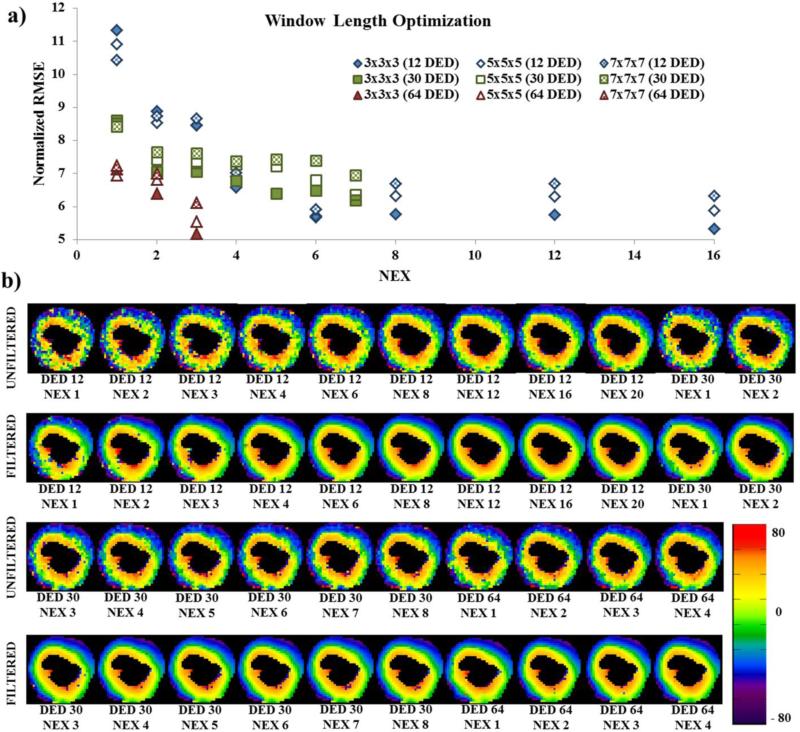
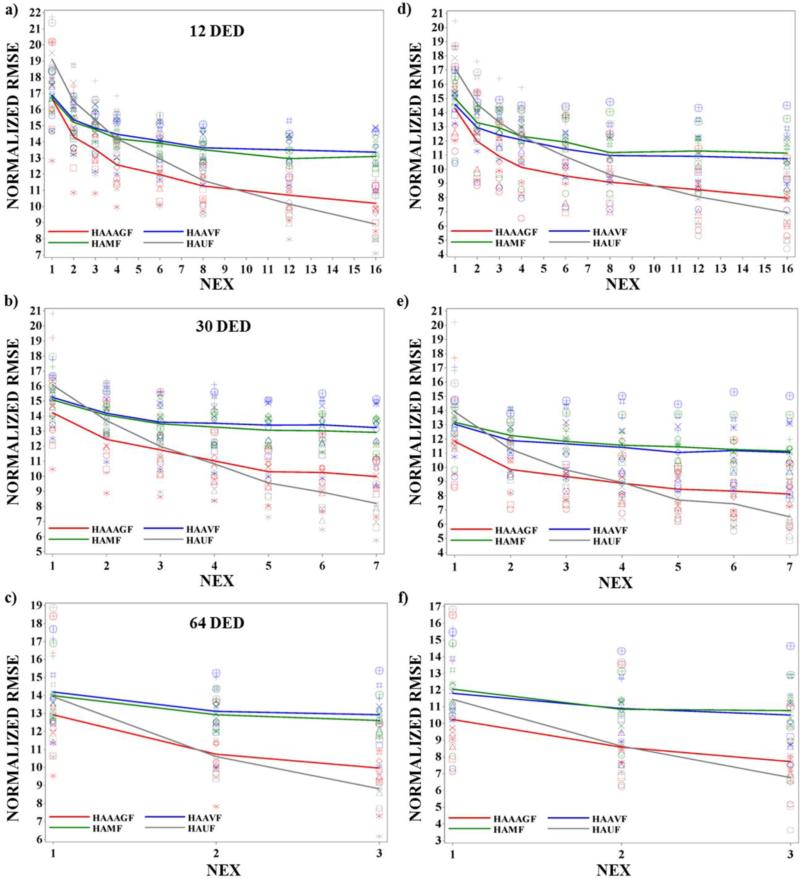
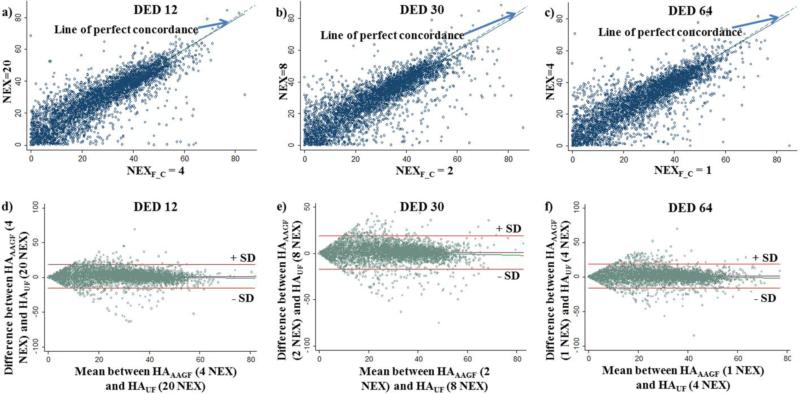
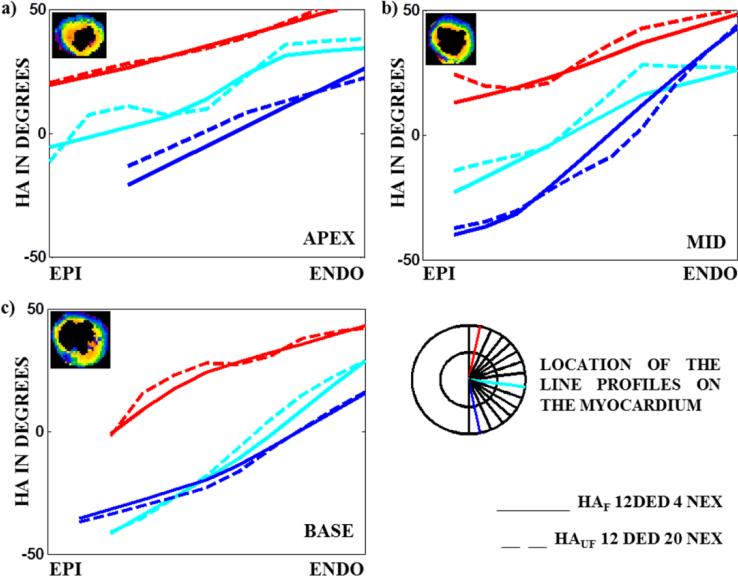
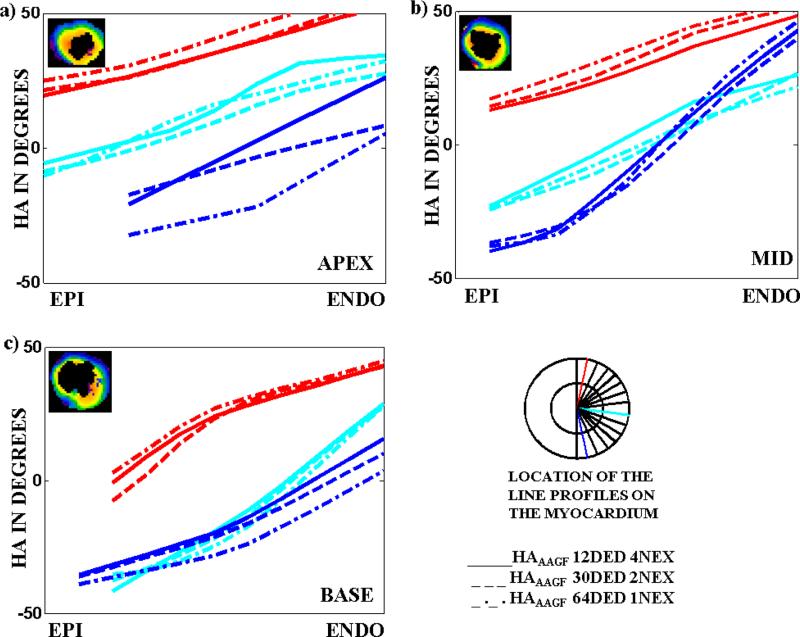
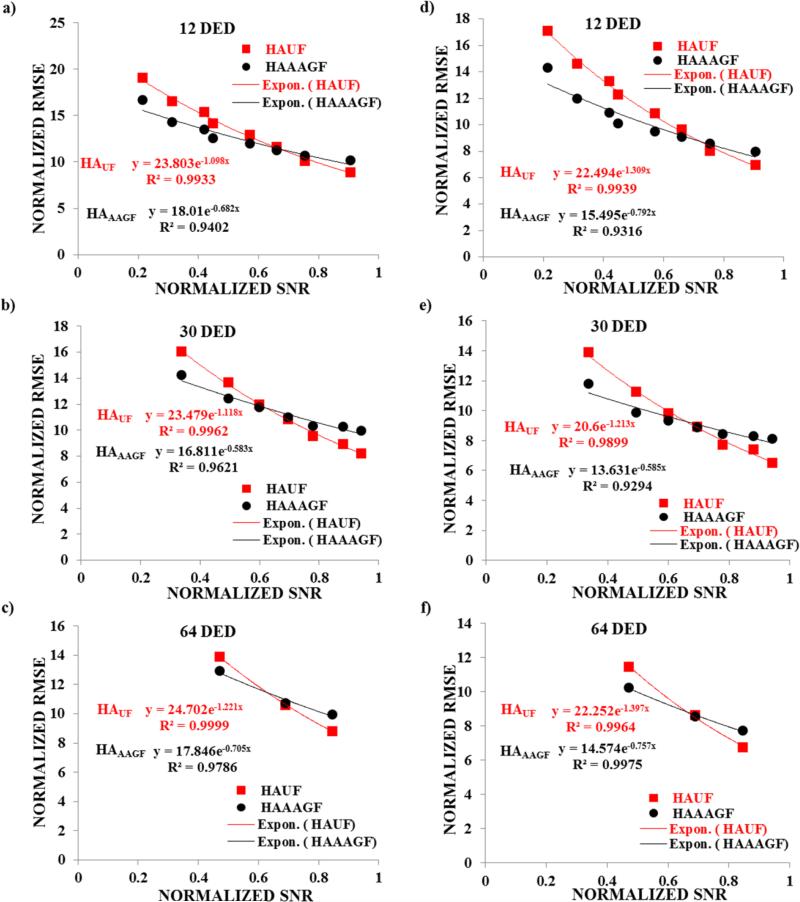
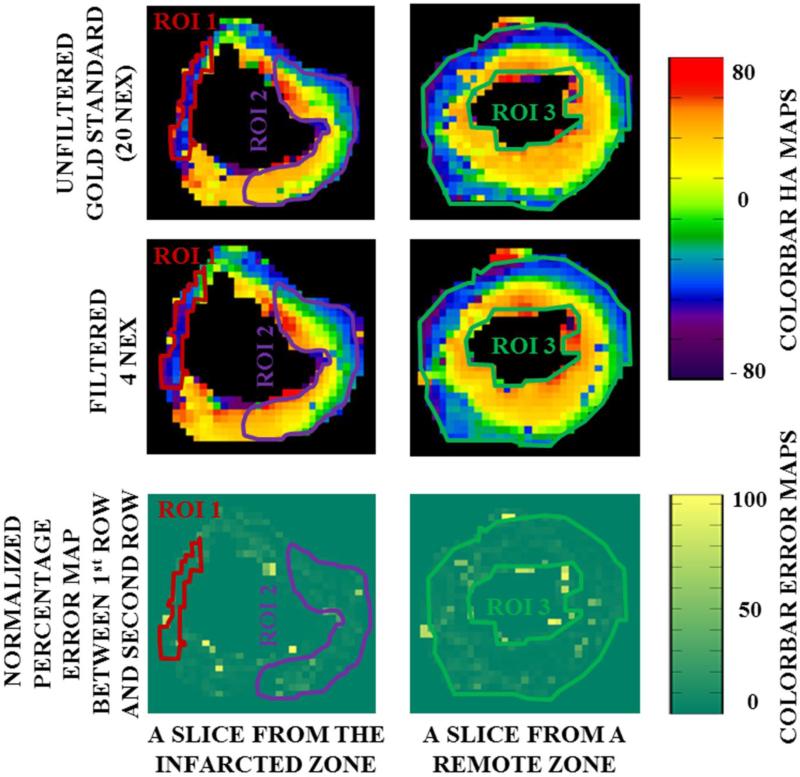
Diffusion tensor imaging (DTI) is used to quantify myocardial fiber orientation based on helical angles (HA). Accurate HA measurements require multiple excitations (NEX) and/or several diffusion encoding directions (DED). However, increasing NEX and/or DED increases acquisition time (TA). Therefore, in this study, we propose to reduce TA by implementing a 3D adaptive anisotropic Gaussian filter (AAGF) on the DTI data acquired from ex-vivo healthy and infarcted porcine hearts. DTI was performed on ex-vivo hearts [9-healthy, 3-myocardial infarction (MI)] with several combinations of DED and NEX. AAGF, mean (AVF) and median filters (MF) were applied on the primary eigenvectors of the diffusion tensor prior to HA estimation. The performance of AAGF was compared against AVF and MF. Root mean square error (RMSE), concordance correlation-coefficients and Bland-Altman's technique was used to determine optimal combination of DED and NEX that generated the best HA maps in the least possible TA. Lastly, the effect of implementing AAGF on the infarcted porcine hearts was also investigated. RMSE in HA estimation for AAGF was lower compared to AVF or MF. Post-filtering (AAGF) fewer DED and NEX were required to achieve HA maps with similar integrity as those obtained from higher NEX and/or DED. Pathological alterations caused in HA orientation in the MI model were preserved post-filtering (AAGF). Our results demonstrate that AAGF reduces TA without affecting the integrity of the myocardial microstructure.

Keywords: Anisotropic filtering; Diffusion tensor imaging (DTI); Fiber orientation; Helical angle (HA); Myocardial infarction (MI).


Figures

Fig 1
Fig 1. Schematic of filter design and analysis
a) Local coordinate system for each voxel, defining the orientation of the Gaussian filter for that particular voxel. b) Rotated anisotropic Gaussian kernel G′. c) σz′ of the rotated Gaussian kernel G′ increases with increasing radial distance as shown by the Gaussian profiles. d) Sixteen radial transmural profiles were examined to investigate the HA line profiles. e) Location of MI on a long axis view with arrows indicating the location of the 2 short axis slices used to perform filter sensitivity analysis on 3 ROIs (red, purple and green).
Fig 2
Fig 2. AAGF window length optimization in the entire heart and HA map of a single slice for all 21 acquisitions
a) Plot of NEX vs normalized RMSE of HA maps obtained with three filter windows 3×3×3, 5×5×5 and 7×7×7 for all the 21 acquisition to determine optimal window length. b) Unfiltered and filtered (filter window length used: 3×3×3) HA maps from a mid-ventricular 2 mm slice for all 21 acquisitions (labelled below each image). 1st and 3rd Row: HAUF. 2nd and 4th Row: HAAAGF.
Fig 3
Fig 3. Normalized RMSE vs NEX for the entire heart and 5 center slices for all the 9 healthy hearts
Plot of normalized RMSE vs NEX for unfiltered HA maps and HA maps filtered using the 3 different filtering techniques (AAGF, AVF and MF) for a) 12 DED b) 30 DED and c) 64 DED for the entire heart and for d) 12 DED e) 30 DED f) 64 DED for the center slices in 9 healthy animals. The different markers represent normalized RMSE from each animal. The mean normalized RMSE profile for each filtering technique (AAGF (red), AVF (blue) and MF (green)) and the unfiltered maps (gray) is shown on the plot.
Fig 4
Fig 4. Concordance-correlation and Bland-Altman's Analysis
Plot of Concordance-correlation between reference standard and NEXF_C for a) 12 DED, b) 30 DED, c) 64 DED acquisition. The solid line corresponds to the reduced major axis and the dashed line corresponds to the line of perfect concordance. Bland-Altman's analysis was performed between reference standard and NEXF_C generated maps for a) 12 DED, b) 30 DED, c) 64 DED acquisition. The solid lines show mean ± 1 SD.
Fig 5
Fig 5. Three line profiles (the location of the profiles are shown in the cartoon of the LV) showing HA transition on a slice from the apex, mid-ventricle and base of the LV comparing HA maps obtained from NEXF_C to the reference standard in a 12 DED acquisition
HA maps of the slice in the a) apex b) mid and c) base for which the profiles have been generated are shown in the top left hand corner of each image. Line profiles generated from filtered HA maps obtained from NEXF_C (4 NEX, solid line) show a smooth transition from the epicardium to the endocardium and are in agreement with the reference standard (20 NEX, dotted line).
Fig 6
Fig 6. Three line profiles (the location of the profiles are shown in the cartoon of the LV) showing HA transition on a slice from the apex, mid-ventricle and base of the LV comparing HA maps obtained from NEXF_C for all the 3 DED settings (12, 30 and 64)
HA maps of the slice in the a) apex b) mid and c) base for which the profiles have been generated are shown in the top left hand corner of each image. Line profiles generated from filtered HA maps obtained from NEXF_C, for 12 (solid), 30 (dashed) and 64 (dashed-dotted) DED show a smooth transition from the epicardium to the endocardium and are in agreement with the each other.
Fig 7
Fig 7. Regression analysis of normalized RMSE (both from AAGF filtered and unfiltered) vs normalized SNR for the entire heart and center slices
Plot of normalized RMSE vs normalized SNR for HAUF maps and HAAAGF for a) 12 DED b) 30 DED and c) 64 DED for the entire heart and for d) 12 DED e) 30 DED f) 64 DED for the center slices in 9 healthy animals. The R2 values for each correlation for the exponential regression analysis is shown in each figure and the fit is denoted by a solid lines for both HAUF (red) and HAAAGF (black).
Fig 8
Fig 8. HA maps and error profiles for infarcted myocardium. 1st Row
HAUF map Left: From an infarcted region Right: From a basal slice, remote to the infarction site. 2nd Row: HAAAGF mapLeft: From an infarcted region Right: From a basal slice, remote to the infarction site. 3rd Row: Percentage difference between HAUF and HAAAGF Left: From an infarcted region Right: From a basal slice, remote to the infarction site. Error map is very uniform within the three different ROI under investigation.

Similar articles

References

    1. Hunter PJ, Pullan AJ, Smaill BH. Modeling total heart function. Annu Rev Biomed Eng. 2003;5:147–77. - PubMed
    1. Kanai A, Salama G. Optical mapping reveals that repolarization spreads anisotropically and is guided by fiber orientation in guinea pig hearts. Circ Res. 1995;77(4):784–802. - PubMed
    1. Taccardi B, Lux RL, Ershler PR, et al. Anatomical architecture and electrical activity of the heart. Acta Cardiol. 1997;52(2):91–105. - PubMed
    1. LeGrice IJ, Takayama Y, Covell JW. Transverse shear along myocardial cleavage planes provides a mechanism for normal systolic wall thickening. Circ Res. 1995;77(1):182–93. - PubMed
    1. Waldman LK, Nosan D, Villarreal F, Covell JW. Relation between transmural deformation and local myofiber direction in canine left ventricle. Circ Res. 1988;63(3):550–62. - PubMed

MeSH terms

LinkOut - more resources