

Using growth velocity to predict child mortality
- PMID: 26843152
- PMCID: PMC4763491
- DOI: 10.3945/ajcn.115.118679
Using growth velocity to predict child mortality
Abstract
Background: Growth assessment based on the WHO child growth velocity standards can potentially be used to predict adverse health outcomes. Nevertheless, there are very few studies on growth velocity to predict mortality.
Objectives: We aimed to determine the ability of various growth velocity measures to predict child death within 3 mo and to compare it with those of attained growth measures.
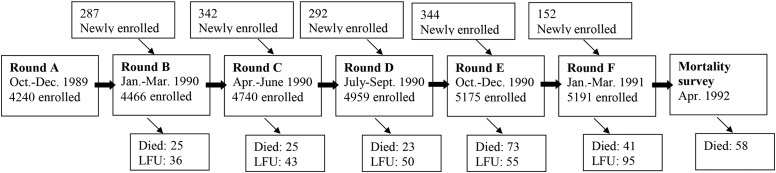
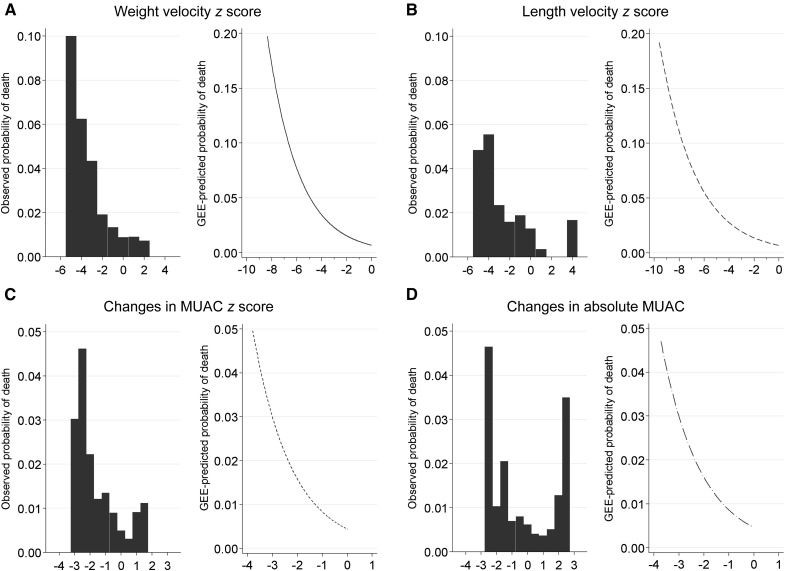
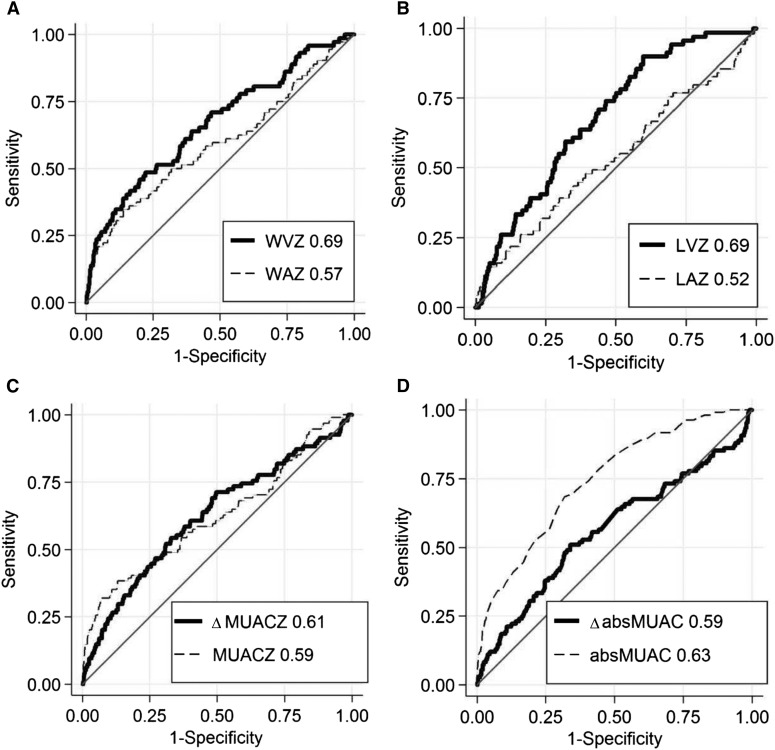
Design: Data from 5657 children <5 y old who were enrolled in a cohort study in the Democratic Republic of Congo were used. Children were measured up to 6 times in 3-mo intervals, and 246 (4.3%) children died during the study period. Generalized estimating equation (GEE) models informed the mortality risk within 3 mo for weight and length velocity z scores and 3-mo changes in midupper arm circumference (MUAC). We used receiver operating characteristic (ROC) curves to present balance in sensitivity and specificity to predict child death.
Results: GEE models showed that children had an exponential increase in the risk of dying with decreasing growth velocity in all 4 indexes (1.2- to 2.4-fold for every unit decrease). A length and weight velocity z score of <-3 was associated with an 11.8- and a 7.9-fold increase, respectively, in the RR of death in the subsequent 3-mo period (95% CIs: 3.9, 35.5, and 3.9, 16.2, respectively). Weight and length velocity z scores had better predictive abilities [area under the ROC curves (AUCs) of 0.67 and 0.69] than did weight-for-age (AUC: 0.57) and length-for-age (AUC: 0.52) z scores. Among wasted children (weight-for-height z score <-2), the AUC of weight velocity z scores was 0.87. Absolute MUAC performed best among the attained indexes (AUC: 0.63), but longitudinal assessment of MUAC-based indexes did not increase the predictive value.
Conclusion: Although repeated growth measures are slightly more complex to implement, their superiority in mortality-predictive abilities suggests that these could be used more for identifying children at increased risk of death.
Keywords: WHO growth velocity standards; anthropometry; longitudinal growth; mortality; prediction.
Figures
Comment in
-
Growth monitoring and the prognosis of mortality in low-income settings.Am J Clin Nutr. 2016 Mar;103(3):681-2. doi: 10.3945/ajcn.115.130013. Epub 2016 Feb 17. Am J Clin Nutr. 2016. PMID: 26888709 No abstract available.
References
-
- de Onis M, Wijnhoven TM, Onyango AW. Worldwide practices in child growth monitoring. J Pediatr 2004;144:461–5. - PubMed
-
- O’Neill SM, Fitzgerald A, Briend A, Van den Broeck J. Child mortality as predicted by nutritional status and recent weight velocity in children under two in rural Africa. J Nutr 2012;142:520–5. - PubMed
-
- Akinbami FO, Hamzat TH, Orimadegun AE, Tongo O, Oyeyemi L, Okafor O, Akinyinka OO. Body mass composition: a predictor of admission outcomes among hospitalized Nigerian under 5 children. Asia Pac J Clin Nutr 2010;19:295–300. - PubMed
Publication types
MeSH terms
LinkOut - more resources
Full Text Sources
Other Literature Sources
